

Abstract
We developed a multicellular model of the mammalian circadian clock characterized by a high degree of heterogeneity with respect to single cell periodicity and behavior (intrinsic and driven oscillators), neurotransmitter release (VIP, GABA and glutamate synthesis) and spatial organization (core and shell regions), mimicking structural patterns within the SCN associated with distinct circadian functions. We simulated the SCN core and shell separately utilizing experimentally derived connectivity schemes for the two subdivisions as observed within the rat SCN. The core was modeled via a small world network characterized by VIP and GABA co-localization, whereas the shell was simulated as a nearest neighbor network promoting local GABAergic connections. To study the function of the axonal plexus extending from the densely innervated ventrolateral region to distal areas across the dorsomedial SCN, directed long range links from the core to the shell were gradually introduced via a probability pcs that ranged from 0 to 1. A probability value of 0 excluded core-shell interactions, whereas pcs =1 achieved maximal connectivity between the two regions. Our model exhibited a threshold in the number of core-to-shell links required for sufficient cell-to-cell coordination to maintain periodicity and rhythmic behavior across the entire model network (including both shell and core populations) in constant darkness as well as 12:12 hour light-dark cycles. By contrast, constant light was shown to increase phase synchronization across the shell while core populations remained poorly synchronized, suggesting differential light response across the two SCN compartments. We further simulated increasing percentages of intrinsic oscillators and demonstrated a negative correlation between the number of intrinsic oscillators distributed across the SCN and the ability of the system to produce synchronized signals. Simulations that differed with respect to the placement of intrinsic oscillators supported the hypothesis that improved synchronization is achieved with networks characterized by localized intrinsic oscillators placed exclusively within the shell versus networks containing uniformly distributed intrinsic oscillators in both SCN compartments. This study has successfully reproduced a number of spatiotemporal and behavioral attributes of the SCN, providing a useful computational tool to correlate observed circadian phenotypes with distinct chemoarchitectural properties of spatially localized neural populations.
Keywords: SCN, Core, Shell, Network Connectivity, VIP, GABA, Glutamate, Light entrainment
1. Introduction
The suprachiasmatic nucleus (SCN) of the hypothalamus is the predominant circadian pacemaker in mammalian organisms. Circadian regulation of behavioral and physiological rhythms is principally dependent on the properties and the organization of cell populations within the SCN. Morphological studies in a variety of mammals (Abrahamson and Moore 2001; Card and Moore 1984; Moore 1983) have demonstrated that the SCN is organized into two structurally and functionally distinct subdivisions. The two regions, differentiated based on their neuropeptide content and network architecture, have been designated as the “core” and the “shell” (Abrahamson and Moore 2001; Robert 1996). The core refers to the ventral region of the nucleus comprised of approximately 40% of all SCN neurons, which primarily produce vasoactive intestinal peptide (VIP) or gastrin-releasing peptide (GRP) co-localized with GABA (Moore et al. 2002). The core receives direct photic input, as retinohypothalamic tract (RHT) projections have been shown to terminate almost exclusively within the ventral region of the SCN overlapping the distribution of VIP and GRP synthesizing neurons (Abrahamson and Moore 2001; Ibata et al. 1989; Moore et al. 2002; Morin 2007).
The shell surrounds the core and contains approximately 60% of the SCN cell population. Shell neurons produce primarily arginine vasopressin (AVP) (Ibata et al. 1993; Kalamatianos et al. 2004) co-localized with GABA (Moore et al. 2002). Characterized by the lack of direct retinal innervations (Antle and Silver 2005; Moore et al. 2002), the shell contains restricted dendritic arbors confined mostly between proximal neurons (Pennartz et al. 1998; Strecker et al. 1997; Vandenpol 1980). By contrast, the axonal plexus originating from VIP and GRP synthesizing cells of the core extends densely over the entire SCN establishing synaptic connections between core neurons expressing VIP (Daikoku et al. 1992) as well as with shell neurons expressing AVP (Ibata et al. 1993; Kalamatianos et al. 2004). Functional axonal projections originating from the densely innervated core to distal areas across the shell are therefore postulated to have an active role in the synchronization of the circadian signal across the SCN and entrainment to various light schedules (Abrahamson and Moore 2001; Jobst et al. 2004).
Contributing to heterogeneity of the circadian network, SCN neurons were further demonstrated to differ in their intrinsic rhythmic behavior in the absence of cell-to-cell communication. Treatments that desynchronize rhythms among SCN neurons have revealed that approximately 30% of the population behaves as intrinsic oscillators (Aton and Herzog 2005). Data concerning the spatial organization of intrinsic oscillators across the SCN network remain controversial. A number of experimental studies have revealed the differential regulation of clock genes in the two distinct SCN compartments, suggesting the confinement of intrinsically rhythmic cells within the shell and arrhythmic cells within the core (Hamada et al. 2004; Hamada et al. 2001; Maywood et al. 2006). By contrast, a more recent study argued against the concept of an anatomically localized class of cell-autonomous pacemakers, instead concluding that SCN neurons are intrinsic but unstable circadian oscillators which rely on network interactions to stabilize their rhythms (Webb et al. 2009).
One of the most important attributes of the SCN is its ability to perceive photic input and adapt its periodicity to various light and dark schedules. Entrainment of the SCN is primarily achieved via glutamate and pituitary adenylate cyclase activating peptide (PACAP) neurotransmitters released within nerve terminals located predominantly in the ventrolateral, retinorecipient core region (Hannibal et al. 2000). Glutamate release initially activates AMPA receptors on retinorecipient cells, depolarizing them and further potentiating the effects of NMDA receptors (Colwell 2001; Mintz and Albers 1997). Stimulation of these iontropic glutamate receptors is associated with increased calcium influx (Ghosh and Greenberg 1995; Gillette and Mitchell 2002), which has been shown to activate a number of protein kinases which ultimately induce core-clock gene transcription (Paul et al. 2005; Schurov et al. 1999) via activation of the cAMP response element binding protein (CREB) (Ginty et al. 1991). PACAP exerts its function within the SCN via two G-protein coupled receptors, PAC1 (Cagampang et al. 1998a; Hannibal et al. 1997) and VPAC2 (Cagampang et al. 1998b). Upon bindings its receptors, PACAP has been shown to instigate a signaling cascade involving a cAMP/protein kinase dependent pathway (Hannibal et al. 1997), which in turn stimulates the phosphorylation of CREB ultimately inducing core-clock gene expression (von Gall et al. 1998).
Previously developed mathematical models (Bernard et al. 2007; Li et al. 2009) have also focused on structural and functional heterogeneities observed within the SCN. In these studies non-identical oscillators expressing a range of intrinsic periods were distributed across the model SCN network. Distinct coupling schemes were utilized to capture the network topology of each SCN compartment. Although the precise network architectures adopted differed, in both studies the ventrolateral region (core) was assumed to contain light-inducible neurons which projected their signal to the non-retinorecipient dorsomedial region (shell). Although computationally efficient, these models utilized phenomenological coupling mechanisms and omitted a number of signaling pathways important for circadian regulation. The purpose of the present study was to capture the molecular events responsible for circadian rhythm generation to investigate the interplay between SCN spatiotemporal organization and behavioral attributes on a mechanistic level.
For the purpose of this study a previously developed model comprised of molecular descriptions of gene expression, neural firing and intracellular signaling pathways was utilized (Vasalou and Henson 2010). To mimic known SCN network topology, we utilized distinct connectivity schemes for each SCN subdivision. Although the compartmentalization of core and shell regions is specific to the organization of the rat SCN, the analysis of neural groups distinct with respect to their neurochemical content and topological features can generally advance understanding of how individual groups affect circadian behavior and rhythm generation. The densely innervated core was simulated via a small world network that promoted both VIP and GABA signaling (Vasalou et al. 2009), whereas the shell was simulated as a locally connected network promoting GABAergic coupling between nearest neighbors. Our main objective was to evaluate the functional importance of long range connections extending from the retinorecipient core to the sparsely connected shell and to investigate the effects of network organization on cell-to-cell coordination, system periodicity and rhythmic behavior as various light schedules were imposed. We simulated different percentages of intrinsic oscillators to establish a relationship between the size of the number of intrinsic oscillators distributed across the SCN and the ability of the system to produce phase synchronized signals. We further compared networks of intrinsic oscillators evenly distributed across the SCN shell and core regions with networks where intrinsic oscillators were confined exclusively within the shell to investigate the relationship between specific cell types and their spatial localization on circadian rhythmicity and behavioral phenotypes.
2. Materials and Methods
2.1. Intracellular Oscillator Model
The gene expression model utilized in our simulations originated from a previously published core oscillator model (Leloup and Goldbeter 2003) modified to include intercellular communication between multiple cells. Each model neuron was defined by 16 ordinary differential equations that described negative and positive transcriptional feedback loops involving key genes of the circadian clock. The model included Per and Cry gene transcription activated by a dimer formed from the CLOCK and BMAL1 proteins and subsequently suppressed by a PER-CRY protein complex. Circadian rhythmicity resulted from the accumulation and degradation of these two protein complexes over the course of the day. Our model did not include a positive feedback loop involving Rev-Erbα as it is not required for rhythm generation.
2.2. Electrophysiology Model
The firing rate-code model obtained from our previous study (Vasalou and Henson 2010) described electrical events on the SCN neuron membrane responsible for the generation of action potentials. Our model took into account contributions of relevant ion channels as well as extracellular synaptic stimuli involving VIP, GABA and glutamate that influenced membrane excitability and neural firing. The glutamate pathway was modified from our original model (Vasalou and Henson 2010) to include direct activation of NMDA/AMPA receptors (Colwell 2001; Mintz and Albers 1997) as well as increased Ca2+ influx (Ghosh and Greenberg 1995; Gillette and Mitchell 2002) in response to glutamate binding to the cell surface. Membrane properties such as resting potential and resistance were modeled to display sustained circadian variations in agreement with the literature (Kuhlman and McMahon 2004; Pennartz et al. 2002). The firing rate-code model reproduced circadian oscillations in neural firing frequency that peaked during circadian day in accordance with experimental data (Brown et al. 2007). Additional details about the electrophysiology model are contained in our original study (Vasalou and Henson 2010).
2.3. Intercellular Coupling Model
Intercellular couplings amongst SCN model neurons were mediated by VIP, GABA and glutamate neurotransmitters. The VIP and GABA pathways were directly obtained from our previous study (Vasalou et. al 2011), while the glutamate pathway was reformulated to include direct NMDA/AMPA receptor activation and induced calcium influx. As in our previous model the VIP release rate was assumed to depend on the neural firing frequency, which fluctuated over the course of the day (Vasalou and Henson 2010). The VIP concentration sensed by each neuron and available for binding VPAC2 receptors was computed as:
| (1) |
where γi is the VIP concentration bound on neuron i, ki is the number of synaptic inputs received by neuron i, N is the total number of neurons in the population, ρj is the concentration of the VIP released by neuron j and αij is a binary coupling term that assumed a value of one when a VIPergic connection between neuron j and i was present and was zero otherwise. VIP binding to the VPAC2 receptor was assumed to form a complex that initiated a signaling cascade which involved a number of steps and ultimately produced activation of Per transcription. Additional details about the signaling model are contained in our original studies (To et al. 2007; Vasalou and Henson 2010).
The model included the effects of the GABA neurotransmitter upon binding its GABAA receptor. As in our previous model (Vasalou et. al 2011), GABA was rhythmically released from the cell as a function of the firing frequency. The GABA concentration sensed by each neuron and available to bind GABAA receptors was computed as:
| (3) |
where δi is the GABA concentration sensed by neuron i, μi is the number of synaptic inputs received by neuron i and εij is a binary coupling term that assumed a value of one when a GABAergic connection between neuron j and i was present and was zero otherwise.
The glutamate pathway was modified from our previous study (Vasalou and Henson 2010) to include circadian oscillations in glutamate uptake as well as the combined effects of AMPA and NMDA receptors. Expression of the NMDA and AMPA receptors across the SCN oscillates with a circadian periodicity, further affecting glutamate uptake (Chambille 1999; Ishida et al. 1994). The glutamate concentration sensed by each neuron i (Glui) was therefore assumed to fluctuate over the course of the day in a constant phase relationship to Per mRNA (MPi):
| (4) |
where vGlu represents the maximum concentration and KGlu is the saturation constant of Glui oscillations. For the purpose of this study we considered the combined effects of AMPA and NMDA receptors on glutamate uptake. A simple model of receptor/ligand binding was utilized, assuming glutamate is a monovalent ligand binding its monovalent receptor. The extent of receptor saturation (bGluR) was computed as:
| (5) |
where KGluR is the equilibrium dissociation constant. Because NMDA and AMPA receptor activation is closely correlated with an increase in cytosolic calcium levels (Colwell and Menaker 1992; Ghosh and Greenberg 1995; Gillette and Mitchell 2002; Michel et al. 2002), the Ca2+ influx (vo) was modeled as a function of the extent of receptor saturation:
| (6) |
where vGluR represents the rate of Ca2+ entering through the cell membrane due to NMDA receptor activation. The model included the effects of photic stimuli conveyed via glutamate and PACAP neurotransmitters (Morin and Allen 2006). Retinal input directly affected core neurons, which in turn transmitted the signal to the neural population of the shell in agreement with the literature (Hamada et al. 2004). Photic stimuli causing increased glutamate and PACAP release were modeled by assuming complete saturation of AMPA/NMDA receptors (bGluR=1) and VPAC2 receptors (bvip=1), respectively, of neurons in the core population.
2.4. Cellular Network Model
To mimic spatial organization of the SCN we utilized distinct connectivity schemes for the shell and core subdivisions. A total of 425 neurons were distributed across the two regions such that the core contained 40% and the shell 60% of all SCN cells in agreement with experimental data (Abrahamson and Moore 2001; Moore et al. 2002). The number of cells utilized was chosen sufficiently large to ensure that our simulation results remained unaffected by the population size. Our previous study (Vasalou et al. 2009) demonstrated that insufficient population sizes produced high variability in model outputs as well as decreased synchronicity. The network topology of the core was simulated via a small world network model as in our previous study (Vasalou et al. 2009), with an ensemble of 169 heterogeneous cells placed on an equally spaced two dimensional grid (13×13 neurons). Each neuron was initially connected to its four nearest neighbors to establish local connections and then a probability ranging from 0 to 1 was specified to randomly add additional shortcut links across the core grid. A probability p = 0.05 was used throughout this study based on our previous work on small network modeling of the core network (Vasalou et al. 2009).
Cell couplings within the core network were established by VIP and GABA signaling. VIP is synthesized by approximately 20% of all SCN cells and these VIP producing cells are localized predominantly within the core (Moore et al. 2002). Because the core contains ~40% of all SCN neurons, the VIP-producing cells were assumed to constitute 50% of the core neural population. To achieve this percentage of VIP synthesizing neurons the simulations involved the additional step of randomly zeroing VIP production from 50% of the core model cells and eliminating VIP connectivity from these non-VIP synthesizing cells. This procedure resulted in the formation of directed connectivity patterns (Vasalou et al. 2009). By contrast GABA is known to be synthesized by most (if not all) SCN neurons (Abrahamson and Moore 2001; Moore et al. 2002). Therefore, GABAergic network topologies were modeled with reciprocal, undirected connections (Fig. 1). More details about the methodology utilized to produce the VIPergic and GABAergic networks are contained in our original study (Vasalou et. al 2011).
Figure 1.
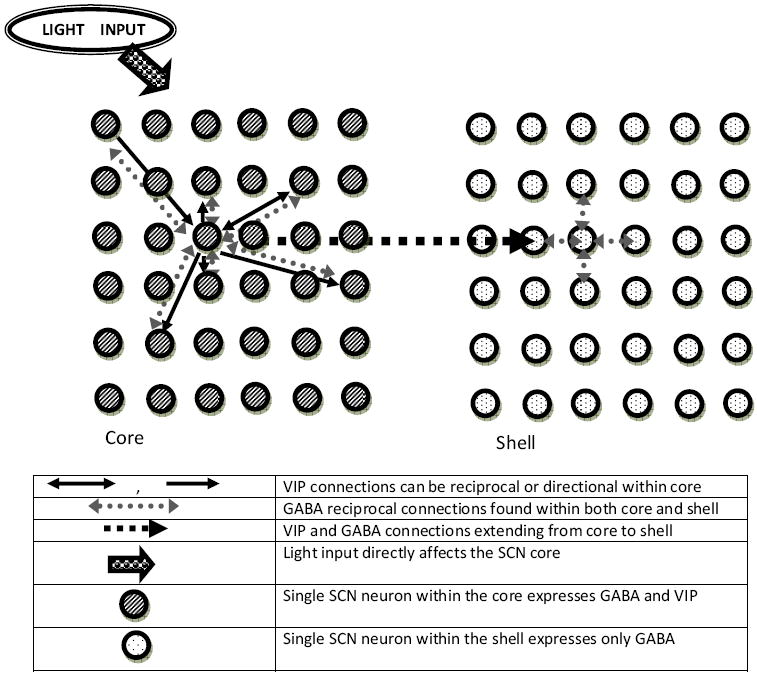
Schematic representation of the model architecture utilized to mimic the spatial organization of the SCN. The core and the shell subdivisions were simulated using distinct connectivity schemes. The core was modeled with a small world network promoting cell-to-cell couplings via VIP and GABA instigated signaling cascades. A locally connected architecture promoting nearest neighbor GABAergic links was used to describe the SCN shell. VIP was expressed by 50% of the core neurons (20% of all SCN neurons), yielding a heterogeneous network with both reciprocal and non-reciprocal connections. GABA was synthesized by all model neurons and yielded cell-to-cell couplings characterized exclusively by bi-directional connections. The two SCN compartments were connected via long range connections, randomly added according to a probability pcs, that extended from the VIP-synthesizing neurons of the core and terminating within the shell. The core network served as the retinorecipient region of the model, directly receiving photic stimuli and transmitting signals to the non-retinorecipient shell.
The topology of the shell network was simulated via a nearest neighbor model to mimic the short range connectivity observed in the dorsomedial region of the nucleus (Pennartz et al. 1998; Strecker et al. 1997; Vandenpol 1980). An ensemble of 256 heterogeneous cells was placed on an equally spaced two dimensional grid (16×16 neurons). Each neuron was connected to its four nearest neighbors to establish local connections. Cell-to-cell communication within the shell was instigated by GABA, which was expressed by all neurons across the shell yielding undirected, reciprocal connections (Fig. 1). Although VIP synthesis is absent within shell neurons (Moore et al. 2002), the VPAC2 receptor is expressed by ~90% of cells in the shell (Kalamatianos et al. 2004). Therefore, all model neurons in the shell were assumed to have VPAC2 receptors. To mimic the axonal plexus extending from the core towards the shell, we assigned a probability (pcs) ranging from 0 to 1 to the VIP-synthesizing cells within the core, according to which additional directed links connecting core neurons to shell neurons were introduced (Fig. 1). The value pcs = 0 produced two independent networks as interactions between core and shell populations were excluded, whereas a value of pcs = 1 produced maximal connectivity between the two networks as all VIP-synthesizing neurons of the core were fully connected to every neuron within the shell. Because GABA and VIP were always co-expressed within VIP-synthesizing model neurons of the core, cell couplings extending from core to shell neurons were instigated by both neurotransmitters.
2.5. Computational Studies and Data Analysis
Dynamic simulations of the multicellular model were performed using MATLAB (The MathWorks, Natick, MA). Each model neuron was characterized by twenty-one differential equations that described gene regulatory events within the cell nucleus, cytosolic Ca2+ variations, and oscillations in VIP, GABA and phosphorylated CREB concentrations (Vasalou and Henson 2010). Nominal model parameter values were mostly obtained from our previous study (Vasalou et. al 2011) on which the present model was based. The small number of parameter values altered from the original reference (Vasalou et. al 2011) to produce firing rate and Per mRNA oscillations within an experimentally observed range and achieve maximum synchronization are presented in Table 1. Initial cell states were obtained from our previously published studies (Vasalou and Henson 2010).
Table 1.
Model parameter values
| Parameter | Value | Justification |
|---|---|---|
| k1 | 0.49 nM * | Parameter altered to adjust the average period of the population in LD cycles and DD. |
| vsp0 | 0.95 nM h-1 * | Parameter altered to generate a 30% pacemaker population. |
| vGlu | 16 nM | |
| KGlu | 4 nM | |
| KGluR | 2 nM | |
| vGluR | 0.08 nM h-1 |
Parameters altered from our previous study (Vasalou et. al 2011). Justification for each change is presented in the third column.
Experiments which decouple individual oscillators across the SCN network have revealed that approximately 30% of the population shows intrinsic rhythmic behavior in the absence of cell-to-cell signaling and that these cells display a broad distribution of circadian periods (Aton et al. 2005). To mimic such cellular heterogeneities, random perturbations in the basal Per transcription rate (vsp0) with a 6% standard deviation around its nominal value were introduced in each neuron to generate a population of ~30% intrinsic oscillators. Random perturbations in the Bmal1 transcription rate (vsB) and in the Bmal1 mRNA degradation rate (vmB) with a 1% standard deviation around their nominal values were assigned to each neuron to produce a distribution of circadian periods among uncoupled intrinsic oscillators ranging between 21-25 hours, as observed experimentally (Aton et al. 2005). The parameters selected to achieve such heterogeneities resulted from a sensitivity analysis discussed in our previous study (Vasalou et al. 2009).
The multicellular model comprised of 425 heterogeneous neurons was solved using the MATLAB differential-algebraic equation solver ode23 with a 6 minute time step to ensure accurate solutions with reasonable computational cost. Intercellular communication mediated by VIP and GABA instigated signaling mechanisms was introduced at t = 150 h, after which simulations were allowed to run for an additional 350 hours (≥ 14 oscillation cycles) to provide sufficient results to assess phase synchronicity and circadian behavior. All results were generated by computing the average and standard deviation across 10 independent runs. To assess the degree of phase synchronicity we utilized the synchronization index (SI) (Strogatz 2000) computed from the Per mRNA concentration of each neuron across the 425 cell ensemble at the end of each oscillation cycle:
| (1) |
where N is the number of rhythmic cells and θj is the phase of the jth cell computed as the difference between the time of peak in the Per mRNA signal of the jth neuron and the peak of the average Per mRNA of the entire population divided by the mean period of the population and multiplied by 2π to convert to radians. To provide a direct measure of the synchronicity across oscillators, non-rhythmic cells were excluded from the calculation of SI. Cells that had circadian amplitude (peak-to-trough) equal to zero were regarded as non-oscillators. Due to the deterministic nature of the model, cycle-to-cycle amplitude and period variability were not observed; therefore SI values were not subject to such fluctuations. Because SI values depended on the relative phase relationship of rhythmic cells, the synchronization index was not observed to significantly vary across one complete oscillation cycle. Single cell periodicity was computed using the method of crossover analysis as described by Abe et. al (2002), according to which the crossings of a 3 hour and 24 hour running average calculated from the detrended time series provide the rising and falling phase markers of each cycle. Mean periodicity and period variability were computed as the average and standard deviation, respectively, of the periods of all oscillating cells.
3. Results
3.1. Effect of Network Connectivity on System Behavior in Constant Darkness
We varied the probability pcs to determine the effects of adding core-to-shell connections on system behavior under conditions of constant darkness (DD). System synchronicity was evaluated via the SI measure calculated at the end of 14 circadian cycles following the initiation of intercellular coupling. Because pcs determined the number of directed links initiated from the core and terminating within the shell, increasing pcs values had a direct effect on the circadian population of the shell but had no effect on the core. Therefore, phase synchrony across the core network remained constant (SI = 0.9) throughout the range of probabilities tested (Fig 2A). A zero probability (pcs = 0) that excluded interactions between SCN core and shell networks was shown to produce populations characterized by poor synchronization within the shell (Fig 2A), primarily due to insufficient local coupling across the shell network. SI values within the shell were shown to monotonically increase from approximately 0.3 to 0.9 as a function of pcs and reach their upper asymptote for pcs = 0.05. The increasing cell-to-cell coordination across the shell affected the SI trend of the entire SCN model network, as system synchronicity calculated across both shell and core networks also increased in the range 0.001 ≤ pcs ≤1 reaching its maximal value at pcs = 0.05 (Fig 2A). Changes in the circadian response of the entire SCN were exclusively attributable to the shell network, as the core network was unaffected by the pcs value.
Figure 2.
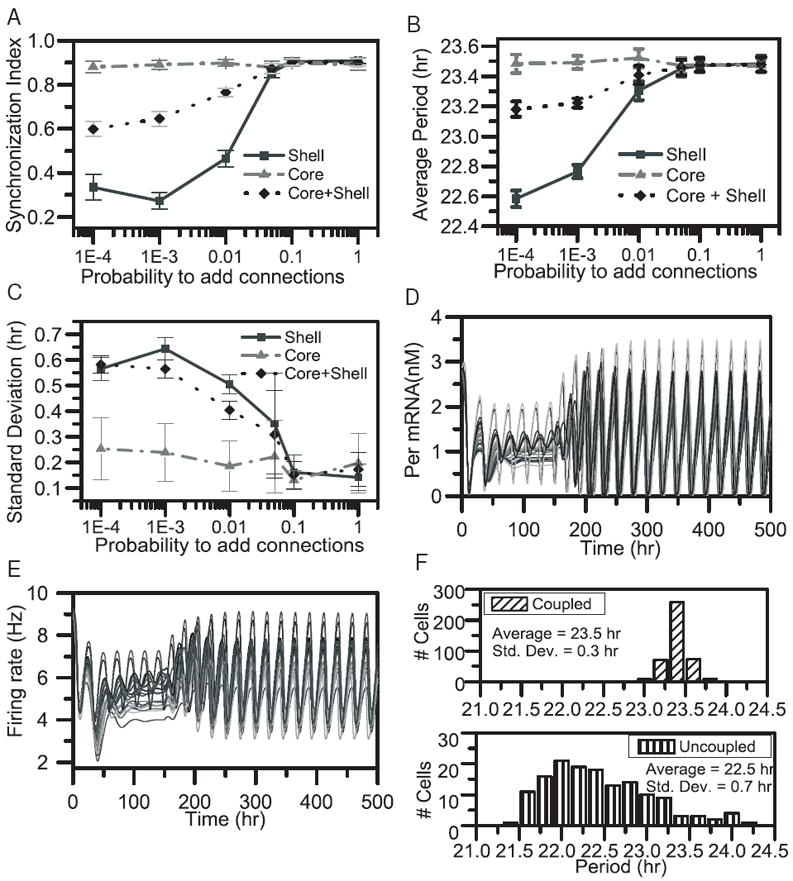
System behavior as a function of core-to-shell connectivity under conditions of constant darkness. For each pcs value the mean (circle) and standard deviation (error bars) were computed across 10 independent runs. SI values (A), the average period of the population (B) and the period variability across individual oscillators of the coupled network (C) as a function of increasing probabilities pcs were calculated across the core (solid line), shell (dashed line) and entire SCN (dotted line) networks at the end of 14 simulations cycles. Per mRNA (D) and firing rate (E) profiles of 20 randomly selected model neurons for pcs = 0.05. Cell-to-cell couplings were introduced at t = 150h. (F) The distribution of periods at the 14th circadian cycle computed for pcs = 0.05 for all cells within the coupled populations (top panel) and for intrinsic oscillators in the uncoupled population (lower panel).
Increasing pcs values were also observed to influence system periodicity. As discussed earlier, the average period and period variability of individual oscillators across the core network remained constant regardless of the pcs value applied. Fluctuations in core period variability versus pcs (Fig. 2C) were regarded insignificant and a distinct trend between the two values could not be extracted. By contrast, absence of core-to-shell connectivity (pcs = 0) was shown to produce reduced average periods (22.6 h) and increased standard deviations of individual periods (0.6 h) across the shell neurons. Progressively higher pcs values resulted in a gradual increase in the average period and a simultaneous decrease in period variability across the shell. Both measures achieved their asymptotic values for pcs = 0.05. Due to these variations across the shell a similar trend was noted for the entire SCN network, as the average period increased and the period variability decreased in the range 0.001 ≤pcs ≤1 reaching their asymptotic values at pcs = 0.05 (Fig. 2B, C). This model prediction is consistent with experimental reports demonstrating reduced periods and increased period variability across the SCN population in the absence of functional intercellular couplings (Aton et al. 2005; Colwell et al. 2003).
Per mRNA and firing rate profiles of 425 model neurons across the population showed that core-to-shell connectivity generated at pcs = 0.05 was sufficient to produce sustained and highly phased synchronized oscillations across the network (Figs 2 D, E). Intercellular signaling introduced at t = 150h caused individual Per mRNA and firing rate profiles to display an increase in circadian amplitude and produce an asymptotic SI value of 0.9, similar to experimental data (Vasalou et al. 2009). The average period across the synchronized population at the end of 14 cycles was 23.5 h and the standard deviation was 0.3 h, while the average period across uncoupled intrinsic oscillators was 22.5 h and the distribution of periods among these intrinsic oscillators had a standard deviation of 0.7 h (Fig. 2 F). These model predictions are consistent with experimental work reporting shortened average periods (Aton et al. 2005; Colwell et al. 2003; Webb et al. 2009) and increased period variability among rhythmic SCN cells due to elimination of intercellular coupling (Brown and Piggins 2009; Herzog et al. 2004; Herzog et al. 1998; Maywood et al. 2006). The uncoupled population further predicted reduced circadian Per mRNA and firing rate amplitudes as shown experimentally (Brown and Piggins 2009). Experiments on hamsters have demonstrated the initiation of Per mRNA rhythms from the dorsomedial SCN and their subsequent spread towards the ventrolateral regions (Hamada et al. 2004). This characteristic has not been captured by our model as we primarily focused on the structure of the rat SCN.
3.2. Relationship between System Behavior and the Percentage of Intrinsic Oscillators
We simultaneously varied the percentage of intrinsic oscillators across the SCN model network and the probability pcs to evaluate the combined effects of intrinsic rhythmic behavior and network connectivity on the circadian system under conditions of constant darkness. Increasing percentages of intrinsic oscillators were generated by increasing the basal value of the Per mRNA transcription rate (vsP0), while implementing random perturbations with a 6% standard deviation around this basal value (Table 2). The percentage of non-rhythmic cells across the coupled population was determined as a function of network connectivity. Across ten independent runs, networks with the complete absence of core-to-shell connectivity (pcs = 0) were shown to produce the largest percentage of non-oscillators. The size of the non-rhythmic population was strongly dependent on the percentage of intrinsic oscillators dispersed across the network, varying from approximately 60% for 0% intrinsic oscillators to 0% for 100% intrinsic oscillators (Fig. 3A). The non-oscillating neurons were primarily found within the shell network, as directed links added via probability pcs affected circadian behavior of the shell but not the core. The percentage of non-oscillators monotonically decreased over the range 0.001 ≤pcs ≤1 and reached its minimum at pcs = 0.05 across all networks investigated, regardless of the percentage of intrinsic oscillators utilized. Therefore, sustained rhythms across most populations are predicted to be network-induced as they emerge from sufficient connectivity across the population.
Table 2.
The value of the Per mRNA basal transcription rate affects the percentage of intrinsic oscillators across uncoupled populations.
| Basal vsp0 value | % Pacemakers |
|---|---|
| 0.85 | 0 |
| 0.87 | 2 |
| 0.9 | 9 |
| 0.95 | 31 |
| 0.98 | 53 |
| 1 | 65 |
| 1.05 | 89 |
| 1.1 | 97 |
| 1.2 | 100 |
* Random perturbations with a 6% standard deviation around all nominal vsp0 values were implemented to generate a distribution of intrinsic periods across all populations tested.
Figure 3.

The effect of different percentages of intrinsically rhythmic cells and the probability pcs on system behavior under conditions of constant darkness. For each pcs value the mean (circle) and standard deviation (error bars) were computed across 10 independent runs. The percentage of non-oscillators across the coupled SCN population (A) and SI values (B) computed at the end of 14 cycle simulations as a function of the probability pcs for 0% (dotted line), 25% (solid line), 60% (dashed line) and 100% (dash-dotted line) intrinsic oscillators. (C) SI values for pcs = 0.05 as a function of increasing percentages of intrinsic oscillators. The distribution of periods across coupled populations with pcs = 0.05 containing 0% (D) and 100% (E) intrinsic oscillators for the core, the shell and the entire SCN.
We also computed phase synchronicity for coupled populations with varying percentages of intrinsic oscillators as a function of the probability pcs. Across ten independent runs, networks generated at pcs = 0 produced populations characterized by decreased synchrony compared to more highly connected topologies. Cell-to-cell coordination was shown to rapidly increase in the range 0.001 ≤pcs ≤1, with SI reaching its maximal value at pcs = 0.05 regardless of the percentage of intrinsic oscillators dispersed across the network (Fig. 3B). The SI trend of the entire SCN model network was predominantly affected by the synchronization behavior of the shell, as SI values across this network were shown to increase with progressively larger pcs values, and not the core, which remained highly phase synchronized for the range of probabilities tested.
Although cell-to-cell coordination across networks of varying intrinsic oscillator populations was maximized at pcs = 0.05, the final SI values corresponding to each population were highly dependent on the percentage of intrinsic oscillators utilized. Higher percentages of intrinsic oscillators were observed to result in poor phase synchronization, as maximal SI values of 0.4 were obtained for populations consisting exclusively of intrinsic oscillators (Fig. 3C). An increase in the number of intrinsic oscillators was also shown to influence period variability across coupled neurons, while having no effect on the average period of the population. The standard deviation across individual oscillators increased from 0.05 to 0.85 h with progressively higher percentages of pacemakers, whereas the average period remained at approximately 23.5 h over the range of intrinsic oscillators tested (Fig. 3D, E). This prediction suggests a correlation between the fraction of intrinsic oscillators and the ability of the coupled network to coordinate its individual signals and produce phase synchronized rhythms. These results are in agreement with the modeling study of Gonze et. al (2005), which demonstrated reduced synchrony across populations of sustained oscillators as compared to networks of damped oscillators.
3.3. Light Entrainment and System Behavior
We exposed the model SCN network to various light schedules to investigate the effects of photic input on system synchronicity and circadian behavior. Light was assumed to directly affect the core population by complete saturation of the AMPA/NMDA and VPAC2 receptors within this network. For the purpose of this study two light schedules were considered: 12 hours of light followed by 12 hours of dark (LD cycles) and constant light (LL). Per mRNA profiles of 425 model neurons across the SCN population exhibited high amplitude oscillations that phase synchronized to produce an asymptotic SI value of 0.9 during LD cycles (Fig 4A, B). The population was entrained to the LD cycle, producing an average period of exactly 24 hours and a low period variability of approximately 0.2 h (Fig. 4C). Because photic signals were directly received by core neurons and subsequently transmitted to the shell, the mean Per mRNA profile across the shell population was phase delayed by approximately 2.5 hours relative to the core population (Fig. 4D). This model output can be compared with studies demonstrating delayed response between ventral and dorsal regions of the hamster SCN following exposure to a light pulse (Hamada et al. 2004). Constant light also generated high amplitude Per mRNA circadian oscillations, but unlike LD exposure LL produced desynchronized populations with SI values of approximately 0.35 (Fig. 4B, E) and increased period variability across individual oscillators (Fig. 4F). Such behavior is in agreement with experimental data demonstrating that individual cells remain rhythmic but lose their synchrony due to exposure to bright light (Arvanitogiannis et al. 2000; Ohta et al. 2006).
Figure 4.

The effect of photic input on circadian behavior of the model SCN network with pcs = 0.05 when intercellular coupling was introduced at t = 150h. (A) Per mRNA profiles of 20 randomly selected model neurons for 12:12 LD cycles. (B) SI values for LD cycles (solid line) and LL (dashed line). (C) The distribution of periods across coupled populations in LD cycles for the core, the shell and the entire SCN. (D) The mean Per mRNA profile of the core (solid line) and shell (dashed line) averaged over the number of cells located within each network for 12:12 LD cycles. (E) Per mRNA profiles of 20 randomly selected model neurons generated for LL. (F) The distribution of periods across coupled populations under LL for the core, the shell and the entire SCN.
3.4. Light Entrainment and Network Connectivity
We varied the probability pcs for different light schedules to determine their combined effects on system behavior. For each pcs value, ten network realizations were simulated to calculate the average period and standard deviation of individual oscillators across the SCN model network. As discussed earlier, due to the directionality of the core-to-shell connections circadian behavior across core neurons remained unaltered as pcs was varied. By contrast, elimination of core-to-shell connectivity (pcs = 0) in LD cycles produced shortened periods (22.6 h) and increased standard deviations (0.6 h) across the shell oscillators. As pcs was increased, the average period increased and the period variability decreased across the shell network with asymptotic values reached at pcs = 0.05. These variations in shell behavior had a direct effect on the circadian response of the entire SCN, as progressively larger pcs values resulted in a gradual increase in mean periodicity and a simultaneous decrease in period variability (Fig 5 A, C). Exposure to LL did not produce a distinct trend across the shell population for the range of probabilities tested. The average period across individual oscillators was shown to slightly increase (from 22.3 to 22.6hr) while the period variability was observed to reach a maximum at pcs = 0.01, rendering a possible correlation between network connectivity and system periodicity unclear (Fig. 5 B, D).
Figure 5.

The combined effects of different photic stimuli and core-to-shell connectivity on system behavior. For each pcs value the mean (circle) and standard deviation (error bars) were computed across 10 independent runs. The average period (A), period variability across coupled oscillators (C) and SI values (E) as a function of the probability pcs across the core (solid line), shell (dashed line) and entire SCN (dotted line) networks in LD cycles. Average period (B), period variability across coupled oscillators (D) and SI values (F) as a function of the probability pcs in LL across the core (solid line), shell (dashed line) and entire SCN (dotted line) networks.
System synchronicity was evaluated for both LD and LL schedules via the SI measure, calculated at the end of 14 circadian cycles. SI values across the core network remained constant for the range of probabilities tested (SI = 0.96 for LD cycles and SI = 0.15 for LL). By contrast, the removal of core-to-shell connectivity (pcs = 0) in LD cycles produced reduced SI values (SI = 0.3) across the shell. SI values were observed to monotonically increase in the range of 0.001 ≤pcs ≤1, with the maximal value of 0.94 achieved at pcs = 0.05. A slight decrease in synchronicity accompanied by an increase in period variability (Fig. 5C, E) across the shell was observed between pcs values of 10-4 −10-3. This trend was attributed to the effects of newly added core-to-shell links, whose output signal carried information from the core network and was hypothesized to temporarily counteract the underlying oscillatory signal of the shell. Increasing synchronicity across the shell affected cell-to-cell coordination of the entire SCN network, as increasing SI values were observed with higher pcs values (Fig.5E).
By contrast to LD cycles, exposure to LL produced decreased SI values across the entire population for the range of probabilities tested. Although system synchronicity across the entire SCN network in LL was observed to increase with higher pcs values, SI never obtained a sufficiently high value to produce coordinated rhythms across the population (SI = 0.57 for pcs = 1). This modest increase in synchronicity across the model SCN can be attributed to improved system response of the shell population upon introduction of core-to-shell links. Interestingly, SI values computed across the shell under LL conditions increased for probabilities pcs ≥ 0.01 finally reaching a maximum of 0.83 at pcs = 1 (Fig. 5F). Large pcs values were therefore seen to produce highly synchronized populations within the shell network, but were unable to promote coordinated rhythms across the entire SCN due to poor synchronization in the core. The slight decrease in synchronicity accompanied by an increase in period variability observed for pcs = 0.01 can be attributed to the competing signals emerging from the core and shell networks. Because pcs values determine the effect of the core output signal on the circadian behavior of the shell, pcs = 0.01 is hypothesized as the transition point above which the core gains control over the shell and begins to effectively synchronize its signals. As previously mentioned SI values were computed at the end of 14 oscillation cycles. Populations characterized by higher synchronicity (larger pcs values) appeared to stabilize their SI values after 14 cycles, while populations with reduced synchronicity (smaller pcs values) were seen to desynchronize with comparable rates over time (see Fig. 4B) and therefore the end of the 14th cycle was regarded as a representative snapshot of the system in time.
3.5. Localization of Intrinsic Oscillators
We simulated two populations of model neurons, distinct with regard to the placement of autonomously rhythmic cells across the modeled SCN, to determine the effects of intrinsic oscillator localization on system behavior. Both networks tested contained 425 model neurons consisting of a 60% intrinsic oscillator population, which were either randomly distributed across the entire SCN network or completely confined within the shell network. These simulations were motivated by recent experimental studies which disagree about the relationship between intrinsic circadian behavior of individual cells and their spatial organization within the SCN (Hamada et al. 2004; Hamada et al. 2001; Maywood et al. 2006). Specifically, a number of studies (Hamada et al. 2004; Hamada et al. 2001; Maywood et al. 2006) support the assumption that the group of intrinsic oscillators is confined within a restricted spatial area (i.e. the shell), whereas a more recent study by Webb et. al (2009) suggested the absence of such confinement and argued that autonomous oscillators are found randomly across the SCN network. The probability pcs was varied to determine the effect of additional core-to-shell links on rhythmic behavior and cell-to-cell coordination. For each pcs value 10 network realizations were simulated. The elimination of core-to-shell connections (pcs = 0) was observed to produce a ~25% population of non-rhythmic cells across coupled shell networks of evenly distributed intrinsic oscillators. The population of non-rhythmic cells was eliminated at pcs = 0.05. By contrast, increasing pcs probabilities did not influence the rhythmic behavior of shell networks of locally distributed intrinsic oscillators, as the percentage of non-oscillators across the entire network remained zero for the range of pcs values tested (Fig. 6A). We also investigated the effects of increasing pcs values on system synchronicity for both networks. Networks with evenly distributed intrinsic oscillators showed highly synchronized populations for pcs values above 0.05. Similar SI values were obtained for networks consisting of locally distributed intrinsic oscillators (Fig. 6B), suggesting that the placement of autonomously rhythmic cells across the SCN does not affect synchronization behavior of the circadian population. This prediction is consistent with several experimental studies (Maywood et al. 2006; Webb et al. 2009) which despite their conflicting findings concerning the localization of intrinsic oscillators, produced circadian populations characterized by a high degree of phase synchrony.
Figure 6.

The relationship between intrinsic oscillator placement across the SCN network and circadian behavior under conditions of constant darkness. The percentage of non-oscillators (A) and the synchronization index (B) across coupled populations with 60% intrinsic oscillators, which were either randomly distributed across the SCN network (solid line) or completely confined within the SCN shell (dashed line), as a function of probability pcs. (C) Per mRNA profiles of 20 randomly selected model neurons in the core characterized by the lack of intrinsic oscillators (top panel) and their ability to self synchronize (bottom panel) for pcs = 0 after cell-to-cell coupling was introduced at t = 150h. (D) Per mRNA profiles of 20 randomly selected model neurons in the shell comprised exclusively of intrinsic oscillators (top panel) and their ability to self-synchronize (bottom panel) for pcs = 0 after cell-to-cell coupling was introduced at t = 150h. (E) Per mRNA profiles of 20 randomly selected model neurons in the core consisting of 60% distributed intrinsic oscillators (top panel) and their ability to self synchronize (bottom panel) for pcs = 0. (F) Per mRNA profiles of 20 randomly selected model neurons in the shell consisting of 60% distributed intrinsic oscillators (top panel) and their ability to self-synchronize (bottom panel) for pcs = 0.
Per mRNA profiles of core and shell neurons were generated for pcs = 0 to investigate system response and synchronicity of the two separate subdivisions as a function of intrinsic oscillator placement across the SCN network. Increased cell-to-cell coordination was observed across the core network regardless of intrinsic oscillator placement, as both networks tested reached the same maximal SI value of approximately 0.9 (Fig. 6C, E). By contrast, shell circadian behavior was shown to differ between SCN networks of evenly distributed and locally distributed intrinsic oscillators. Although both populations were characterized by poor phase synchronization (SI = 0.1), shell networks comprised of 60% evenly distributed intrinsic oscillators produced a population of non-rhythmic neurons which was absent in shell networks with locally distributed intrinsic oscillators (Fig 6D, F). Our model results of evenly distributed oscillators may be relevant to the observation that separating the dorsal and ventral SCN abolished synchrony in the dorsal SCN, while cells in the ventral slice continued to cycle with clear synchronicity (Yamaguchi et al. 2003). Although a small population size was recorded within the dorsal SCN, neurons across the shell were shown to oscillate in asynchrony while their circadian amplitudes did not dampen for several days, demonstrating that desynchronization does not necessary coincide with reduced amplitude of individual oscillators (Yamaguchi et al. 2003). These experimental results are therefore in agreement with the SCN network model of locally distributed intrinsic oscillators, which is based on the hypothesis that intrinsic oscillators are localized within the shell and driven by damped oscillators within the core.
4. Discussion
The SCN consists of a heterogeneous group of cells that can be differentiated according to their neuropeptide content (Vandenpol and Tsujimoto 1985), their oscillatory behavior (Moore et al. 2002; Shinohara et al. 1995), their ability to perceive light (Antle and Silver 2005) and their network architecture (Abrahamson and Moore 2001; Robert 1996). We developed a multicellular model of the mammalian circadian clock characterized by a high degree of heterogeneity with respect to single cell periodicity and behavior (intrinsic and driven oscillators), neurotransmitter release (VIP, GABA and glutamate synthesis) and spatial organization (core and shell regions), mimicking structural patterns within the SCN associated with distinct circadian functions. The main objective of this study was to investigate interactions between the structurally and functionally distinct core and shell regions of the SCN and the resulting circadian phenotypes.
Our simulations involved the gradual introduction of core-to-shell shortcut links to investigate the effect on circadian behavior in various light schedules. Under conditions of DD and 12:12 LD cycles the model predicted a threshold in the density of long range core-to-shell connections that is required to achieve maximal system synchronization and enhance the time keeping ability of the system. Under LL conditions cell-to-cell coordination across the shell population increased while the core network was characterized by poor phase synchronization as the pcs value was increased. Our previous study (Vasalou et al. 2009) which focused exclusively on core populations suggested enhanced synchronicity with progressively higher connection density across the core under conditions of DD, while simulations of LD cycles and LL suggested that network connectivity within the core was inconsequential upon introduction of photic inputs. LD cycles produced highly synchronized populations and LL produced asynchronous populations regardless of the connection density utilized across the core network These results indicate a differential response of the two SCN compartments upon introduction of photic stimuli under the condition of sufficiently high core-to-shell connectivity, and further suggest a threshold in the circadian signal produced by the retinorecipient core population above which the shell displays increased synchronicity and rhythmic behavior. This behavior is most likely due to the presence of distinct neurotransmitters within each SCN compartment, which respond differently upon the introduction of photic stimuli. Due to these mechanisms the core is ensured to robustly entrain to various environmental stimuli and readily transmit the signal towards the rest of the SCN, whereas the role of the shell is to stabilize these oscillations across the entire network.
Simulations of the SCN model network with the probability pcs = 0.05 produced robust Per mRNA and firing rate rhythms that self-synchronized despite the lack of photic signals, yielding SI values comparable to data collected from SCN slices (Vasalou et al. 2009). The ability of our model network with pcs = 0.05 to synchronize under conditions of constant light and to entrain to 12 hours of light followed by 12 hours of dark was also investigated. Implementation of 12:12 LD cycles produced high amplitude Per mRNA oscillations characterized by high SI values, with the population entraining to a period of 24 hours. By contrast exposure to LL conditions produced desynchronized circadian populations, in agreement with experimental data demonstrating reduced cell-to-cell coordination despite sustained rhythmic behavior across individual cells (Arvanitogiannis et al. 2000; Ohta et al. 2006). Actograms of wheel running activity from constant light-treated mice demonstrated a slower desynchronization of circadian behavior (Ohta et al. 2006) than the trend produced by our model. This discrepancy might be due to the exclusion of relevant brain regions that are involved in the relay of photic information and may potentially contribute to the stabilization of circadian rhythmicity. Our simulations treated the SCN as an autonomous entity and interacting tissues were ignored for the purposes of this study. Low SI values were observed for both the core and shell networks, consistent with literature reporting disrupted circadian rhythms in the two SCN compartments due to constant light exposure (Beaule et al. 2003).
We varied the percentage of intrinsic oscillators distributed across the entire SCN network while increasing pcs values to investigate the combined effects of intrinsic rhythmicity and network connectivity on system behavior under conditions of constant darkness. A strong correlation between core-to-shell connectivity and the percentage of non-rhythmic cells across coupled networks was found. Increasing pcs values resulted in decreased percentages of non-oscillators with the non-oscillating population minimized at the probability pcs = 0.05, regardless of the percentage of intrinsic oscillators utilized. Cell-to-cell coordination was also a function of core-to-shell connectivity, as whole network SI values were observed to increase with pcs and reach their maximum at pcs = 0.05 across all networks tested. This result suggests that a minimum number of core-to-shell shortcut links is necessary to eliminate non-oscillators and drive circadian rhythmicity across the entire coupled SCN population. We further demonstrated a relationship between the percentage of intrinsic oscillators distributed across the network and SI values computed across the model population. Cell-to-cell coordination was observed to deteriorate with elevated percentages of intrinsic oscillators, suggesting a negative correlation between the percentage of intrinsic oscillators and network synchronization. These simulations indicate a competition between single cell signals and network properties, the outcome of which determines the final degree of synchronicity. Our predictions are consistent with previous computational studies demonstrating fast synchronization across networks of damped oscillators as compared to populations of sustained oscillators (Gonze et al. 2005). The experimentally observed ~30% intrinsically rhythmic population (Aton et al. 2005) corresponds to the plateau of the SI value versus fraction of intrinsic oscillators (Fig. 3C), further implying the circadian system is robust and does not easily deteriorate due to variations in the rhythmic behavior of only a few cells. A 30% intrinsic oscillating population is sufficiently low to allow rapid synchronization but also large enough to set the phase and lead circadian rhythmicity across the SCN population. Verification of these model predictions would require placement of SCN neurons on a dish and monitoring of their rhythmic behavior, which would aid in their categorization as autonomous or non-autonomous as well as provide data for calculation of the synchronization index (SI) across the network.
To analyze the importance of intrinsic oscillator placement across the SCN, we simulated two populations consisting of 60% intrinsic oscillators either randomly distributed across the entire network or completely restricted within the shell. These simulations were motivated by conflicting experimental data suggesting the confinement of intrinsically rhythmic cells within the shell (Hamada et al. 2004; Hamada et al. 2001; Maywood et al. 2006) or indicating no relationship between rhythmic behavior and neuropeptidergic or spatial attributes (Webb et al. 2009). We found rhythmic behavior across the two networks with evenly and locally distributed intrinsic oscillators to differ in the absence of core-to-shell connectivity (pcs = 0). Shell networks of evenly distributed intrinsic oscillators were characterized by a population of non-rhythmic cells which was absent in networks comprised exclusively of locally distributed intrinsic oscillators for pcs = 0. These predictions are consistent with experimental studies which accomplished in vitro separation of the dorsal and ventral SCN. Although the number of cells recorded across the dorsal SCN was low, synchrony across this region appeared to be disrupted (Yamaguchi et al. 2003). By contrast, cells in the ventral slice continue to cycle with clear synchronicity. Although cell-to-cell coordination across the modeled shell population appeared markedly reduced, individual neurons continued to express sustained circadian oscillations for several days, reproducing the experimental observation that desynchronization does not necessary coincide with reduced amplitude of individual rhythmic oscillators (Yamaguchi et al. 2003). These experimental results therefore appear to be in agreement with the hypothesis of localized intrinsic oscillators, which postulates that the SCN network consists of intrinsic oscillators restricted within the shell and the core containing only driven oscillators.
-
➢
We model distinct subdivisions of the circadian network characterized by a high degree of heterogeneity.
-
➢
We find a threshold in functional long range connectivity across SCN subdivisions required for robust behavior.
-
➢
Connectivity threshold occurs for a range of populations that contain increasing percentages of pacemakers.
-
➢
Individual SCN subdivisions are found to respond differently depending on light input and network connectivity.
Acknowledgments
This work was supported by National Institute of Health grant GM078993 and the National Science Foundation-sponsored Institute for Cellular Engineering IGERT program DGE-0654128.
Footnotes
Publisher's Disclaimer: This is a PDF file of an unedited manuscript that has been accepted for publication. As a service to our customers we are providing this early version of the manuscript. The manuscript will undergo copyediting, typesetting, and review of the resulting proof before it is published in its final citable form. Please note that during the production process errors may be discovered which could affect the content, and all legal disclaimers that apply to the journal pertain.
References
- Abrahamson EE, Moore RY. Suprachiasmatic nucleus in the mouse: retinal innervation, intrinsic organization and efferent projections. Brain Research. 2001;916:172–191. doi: 10.1016/s0006-8993(01)02890-6. [DOI] [PubMed] [Google Scholar]
- Antle MC, Silver R. Orchestrating time: arrangements of the brain circadian clock. Trends in Neurosciences. 2005;28:145–151. doi: 10.1016/j.tins.2005.01.003. [DOI] [PubMed] [Google Scholar]
- Arvanitogiannis A, Robinson B, Beaule C, Amir S. Calbindin-D28k immunoreactivity in the suprachiasmatic nucleus and the circadian response to constant light in the rat. Neuroscience. 2000;99:397–401. doi: 10.1016/s0306-4522(00)00327-4. [DOI] [PubMed] [Google Scholar]
- Aton SJ, Colwell CS, Harmar AJ, Waschek J, Herzog ED. Vasoactive intestinal polypeptide mediates circadian rhythmicity and synchrony in mammalian clock neurons. Nature Neuroscience. 2005;8:476–483. doi: 10.1038/nn1419. [DOI] [PMC free article] [PubMed] [Google Scholar]
- Aton SJ, Herzog ED. Come together, right…now: Synchronization of rhythms in a mammalian circadian clock. Neuron. 2005;48:531–534. doi: 10.1016/j.neuron.2005.11.001. [DOI] [PMC free article] [PubMed] [Google Scholar]
- Beaule C, Houle LM, Amir S. Expression profiles of PER2 immunoreactivity within the shell and core regions of the rat suprachiasmatic nucleus - Lack of photic entrainment and disruption by constant light. Journal of Molecular Neuroscience. 2003;21:133–147. doi: 10.1385/JMN:21:2:133. [DOI] [PubMed] [Google Scholar]
- Bernard S, Gonze D, Cajavec B, Herzel H, Kramer A. Synchronization-induced rhythmicity of circadian oscillators in the suprachiasmatic nucleus. Plos Computational Biology. 2007;3:667–679. doi: 10.1371/journal.pcbi.0030068. [DOI] [PMC free article] [PubMed] [Google Scholar]
- Brown TM, Colwell CS, Waschek JA, Piggins HD. Disrupted neuronal activity rhythms in the suprachiasmatic nuclei of vasoactive intestinal polypeptide-deficient mice. Journal of Neurophysiology. 2007;97:2553–2558. doi: 10.1152/jn.01206.2006. [DOI] [PMC free article] [PubMed] [Google Scholar]
- Brown TM, Piggins HD. Spatiotemporal Heterogeneity in the Electrical Activity of Suprachiasmatic Nuclei Neurons and their Response to Photoperiod. Journal of Biological Rhythms. 2009;24:44–54. doi: 10.1177/0748730408327918. [DOI] [PubMed] [Google Scholar]
- Cagampang FRA, Piggins HD, Sheward WJ, Harmar AJ, Coen CW. Circadian changes in PACAP type 1 (PAC(1)) receptor mRNA in the rat suprachiasmatic and supraoptic nuclei. Brain Research. 1998a;813:218–222. doi: 10.1016/s0006-8993(98)01044-0. [DOI] [PubMed] [Google Scholar]
- Cagampang FRA, Sheward WJ, Harmar AJ, Piggins HD, Coen CW. Circadian changes in the expression of vasoactive intestinal peptide 2 receptor mRNA in the rat suprachiasmatic nuclei. Molecular Brain Research. 1998b;54:108–112. doi: 10.1016/s0169-328x(97)00327-6. [DOI] [PubMed] [Google Scholar]
- Card JP, Moore RY. THE SUPRACHIASMATIC NUCLEUS OF THE GOLDEN-HAMSTER - IMMUNOHISTOCHEMICAL ANALYSIS OF CELL AND FIBER DISTRIBUTION. Neuroscience. 1984;13:415–431. doi: 10.1016/0306-4522(84)90240-9. [DOI] [PubMed] [Google Scholar]
- Chambille I. Circadian rhythm of AMPA receptor GluR2/3 subunit-immunoreactivity in the suprachiasmatic nuclei of Syrian hamster and effect of a light-dark cycle. Brain Research. 1999;833:27–38. doi: 10.1016/s0006-8993(99)01460-2. [DOI] [PubMed] [Google Scholar]
- Colwell CS. NMDA-evoked calcium transients and currents in the suprachiasmatic nucleus: gating by the circadian system. European Journal of Neuroscience. 2001;13:1420–1428. doi: 10.1046/j.0953-816x.2001.01517.x. [DOI] [PMC free article] [PubMed] [Google Scholar]
- Colwell CS, Menaker M. NMDA AS WELL AS NON-NMDA RECEPTOR ANTAGONISTS CAN PREVENT THE PHASE-SHIFTING EFFECTS OF LIGHT ON THE CIRCADIAN SYSTEM OF THE GOLDEN-HAMSTER. Journal of Biological Rhythms. 1992;7:125–136. doi: 10.1177/074873049200700204. [DOI] [PubMed] [Google Scholar]
- Colwell CS, Michel S, Itri J, Rodriguez W, Tam J, Lelievre V, Hu Z, Liu X, Waschek JA. Disrupted circadian rhythms in VIP- and PHI-deficient mice. American Journal of Physiology-Regulatory Integrative and Comparative Physiology. 2003;285:R939–R949. doi: 10.1152/ajpregu.00200.2003. [DOI] [PubMed] [Google Scholar]
- Daikoku S, Hisano S, Kagotani Y. NEURONAL ASSOCIATIONS IN THE RAT SUPRACHIASMATIC NUCLEUS DEMONSTRATED BY IMMUNOELECTRON MICROSCOPY. Journal of Comparative Neurology. 1992;325:559–571. doi: 10.1002/cne.903250408. [DOI] [PubMed] [Google Scholar]
- Ghosh A, Greenberg ME. CALCIUM SIGNALING IN NEURONS - MOLECULAR MECHANISMS AND CELLULAR CONSEQUENCES. Science. 1995;268:239–247. doi: 10.1126/science.7716515. [DOI] [PubMed] [Google Scholar]
- Gillette MU, Mitchell JW. Signaling in the suprachiasmatic nucleus: selectively responsive and integrative. Cell and Tissue Research. 2002;309:99–107. doi: 10.1007/s00441-002-0576-1. [DOI] [PubMed] [Google Scholar]
- Ginty DD, Glowacka D, Bader DS, Hidaka H, Wagner JA. INDUCTION OF IMMEDIATE EARLY GENES BY CA2+ INFLUX REQUIRES CAMP-DEPENDENT PROTEIN-KINASE IN PC12 CELLS. Journal of Biological Chemistry. 1991;266:17454–17458. [PubMed] [Google Scholar]
- Gonze D, Bernard S, Waltermann C, Kramer A, Herzel H. Spontaneous synchronization of coupled circadian oscillators. Biophysical Journal. 2005;89:120–129. doi: 10.1529/biophysj.104.058388. [DOI] [PMC free article] [PubMed] [Google Scholar]
- Hamada T, Antle MC, Silver R. Temporal and spatial expression patterns of canonical clock genes and clock-controlled genes in the suprachiasmatic nucleus. European Journal of Neuroscience. 2004;19:1741–1748. doi: 10.1111/j.1460-9568.2004.03275.x. [DOI] [PMC free article] [PubMed] [Google Scholar]
- Hamada T, LeSauter J, Venuti JM, Silver R, G l. Expression of Period genes: Rhythmic and nonrhythmic compartments of the suprachiasmatic nucleus pacemaker. Journal of Neuroscience. 2001;21:7742–7750. doi: 10.1523/JNEUROSCI.21-19-07742.2001. [DOI] [PMC free article] [PubMed] [Google Scholar]
- Hannibal J, Ding JM, Chen D, Fahrenkrug J, Larsen PJ, Gillette MU, Mikkelsen JD. Pituitary adenylate cyclase-activating peptide (PACAP) in the retinohypothalamic tract: A potential daytime regulator of the biological clock. Journal of Neuroscience. 1997;17:2637–2644. doi: 10.1523/JNEUROSCI.17-07-02637.1997. [DOI] [PMC free article] [PubMed] [Google Scholar]
- Hannibal J, Moller M, Ottersen OP, Fahrenkrug J. PACAP and glutamate are co-stored in the retinohypothalamic tract. Journal of Comparative Neurology. 2000;418:147–155. [PubMed] [Google Scholar]
- Herzog ED, Aton SJ, Numano R, Sakaki Y, Tei H. Temporal precision in the mammalian circadian system: A reliable clock from less reliable neurons. Journal of Biological Rhythms. 2004;19:35–46. doi: 10.1177/0748730403260776. [DOI] [PubMed] [Google Scholar]
- Herzog ED, Takahashi JS, Block GD. Clock controls circadian period in isolated suprachiasmatic nucleus neurons. Nature Neuroscience. 1998;1:708–713. doi: 10.1038/3708. [DOI] [PubMed] [Google Scholar]
- Ibata Y, Takahashi Y, Okamura H, Kawakami F, Terubayashi H, Kubo T, Yanaihara N. VASOACTIVE INTESTINAL PEPTIDE (VIP)-LIKE IMMUNOREACTIVE NEURONS LOCATED IN THE RAT SUPRACHIASMATIC NUCLEUS RECEIVE A DIRECT RETINAL PROJECTION. Neuroscience Letters. 1989;97:1–5. doi: 10.1016/0304-3940(89)90129-8. [DOI] [PubMed] [Google Scholar]
- Ibata Y, Tanaka M, Ichitani Y, Takahashi Y, Okamura H. NEURONAL INTERACTION BETWEEN VIP AND VASOPRESSIN NEURONS IN THE RAT SUPRACHIASMATIC NUCLEUS. Neuroreport. 1993;4:128–130. doi: 10.1097/00001756-199302000-00003. [DOI] [PubMed] [Google Scholar]
- Ishida N, Matsui M, Mitsui Y, Mishina M. CIRCADIAN EXPRESSION OF NMDA RECEPTOR MESSENGER-RNAS, EPSILON-3 AND ZETA-1 IN THE SUPRACHIASMATIC NUCLEUS OF RAT-BRAIN. Neuroscience Letters. 1994;166:211–215. doi: 10.1016/0304-3940(94)90488-x. [DOI] [PubMed] [Google Scholar]
- Jobst EE, Robinson DW, Allen CN. Potential pathways for intercellular communication within the calbindin subnucleus of the hamster suprachiasmatic nucleus. Neuroscience. 2004;123:87–99. doi: 10.1016/j.neuroscience.2003.08.059. [DOI] [PubMed] [Google Scholar]
- Kalamatianos T, Kallo I, Piggins HD, Coen CW, K r. Expression of VIP and/or PACAP receptor mRNA in peptide synthesizing cells within the suprachiasmatic nucleus of the rat and in its efferent target sites. Journal of Comparative Neurology. 2004;475:19–35. doi: 10.1002/cne.20168. [DOI] [PubMed] [Google Scholar]
- Kuhlman SJ, McMahon DG. Rhythmic regulation of membrane potential and potassium current persists in SCN neurons in the absence of environmental input. European Journal of Neuroscience. 2004;20:1113–1117. doi: 10.1111/j.1460-9568.2004.03555.x. [DOI] [PubMed] [Google Scholar]
- Leloup JC, Goldbeter A. Toward a detailed computational model for the mammalian circadian clock. Proceedings of the National Academy of Sciences of the United States of America. 2003;100:7051–7056. doi: 10.1073/pnas.1132112100. [DOI] [PMC free article] [PubMed] [Google Scholar]
- Li Y, Liu Z, Zhang J, Wang R, Chen L. Synchronisation mechanisms of circadian rhythms in the suprachiasmatic nucleus. Iet Systems Biology. 2009;3:100–112. doi: 10.1049/iet-syb.2007.0057. [DOI] [PubMed] [Google Scholar]
- Maywood ES, Reddy AB, Wong GKY, O’Neill JS, O’Brien JA, McMahon DG, Harmar AJ, Okamura H, Hastings MH. Synchronization and maintenance of timekeeping in suprachiasmatic circadian clock cells by neuropeptidergic signaling. Current Biology. 2006;16:599–605. doi: 10.1016/j.cub.2006.02.023. [DOI] [PubMed] [Google Scholar]
- Michel S, Itri J, Colwell CS. Excitatory mechanisms in the suprachiasmatic nucleus: The role of AMPA/KA glutamate receptors. Journal of Neurophysiology. 2002;88:817–828. doi: 10.1152/jn.2002.88.2.817. [DOI] [PMC free article] [PubMed] [Google Scholar]
- Mintz EM, Albers HE. Microinjection of NMDA into the SCN region mimics the phase shifting effect of light in hamsters. Brain Research. 1997;758:245–249. doi: 10.1016/s0006-8993(97)00022-x. [DOI] [PubMed] [Google Scholar]
- Moore RY. ORGANIZATION AND FUNCTION OF A CENTRAL NERVOUS-SYSTEM CIRCADIAN OSCILLATOR - THE SUPRACHIASMATIC HYPOTHALAMIC NUCLEUS. Federation Proceedings. 1983;42:2783–2789. [PubMed] [Google Scholar]
- Moore RY, Speh JC, Leak RK, Q l. Suprachiasmatic nucleus organization. Cell and Tissue Research. 2002;309:89–98. doi: 10.1007/s00441-002-0575-2. [DOI] [PubMed] [Google Scholar]
- Morin LP. SCN organization reconsidered. Journal of Biological Rhythms. 2007;22:3–13. doi: 10.1177/0748730406296749. [DOI] [PubMed] [Google Scholar]
- Morin LP, Allen CN. The circadian visual system, 2005. Brain Research Reviews. 2006;51:1–60. doi: 10.1016/j.brainresrev.2005.08.003. [DOI] [PubMed] [Google Scholar]
- Ohta H, Mitchell AC, McMahon DG. Constant light disrupts the developing mouse biological clock. Pediatric Research. 2006;60:304–308. doi: 10.1203/01.pdr.0000233114.18403.66. [DOI] [PubMed] [Google Scholar]
- Paul KN, Fukuhara C, Karom M, Tosini G, Albers HE. AMPA/kainate receptor antagonist DNQX blocks the acute increase of Per2 mRNA levels in most but not all areas of the SCN. Molecular Brain Research. 2005;139:129–136. doi: 10.1016/j.molbrainres.2005.05.017. [DOI] [PubMed] [Google Scholar]
- Pennartz CMA, de Jeu MTG, Bos NPA, Schaap J, Geurtsen AMS. Diurnal modulation of pacemaker potentials and calcium current in the mammalian circadian clock. Nature. 2002;416:286–290. doi: 10.1038/nature728. [DOI] [PubMed] [Google Scholar]
- Pennartz CMA, De Jeu MTG, Geurtsen AMS, Sluiter AA, Hermes M. Electrophysiological and morphological heterogeneity of neurons in slices of rat suprachiasmatic nucleus. Journal of Physiology-London. 1998;506:775–793. doi: 10.1111/j.1469-7793.1998.775bv.x. [DOI] [PMC free article] [PubMed] [Google Scholar]
- Robert MY. Entrainment pathways and the functional organization of the circadian system. Elsevier Amsterdam; Amsterdam: 1996. [DOI] [PubMed] [Google Scholar]
- Schurov IL, McNulty S, Best JD, Sloper PJ, Hastings MH. Glutamatergic induction of CREB phosphorylation and Fos expression in primary cultures of the suprachiasmatic hypothalamus in vitro is mediated by co-ordinate activity of NMDA and non-NMDA receptors. Journal of Neuroendocrinology. 1999;11:43–51. doi: 10.1046/j.1365-2826.1999.00289.x. [DOI] [PubMed] [Google Scholar]
- Shinohara K, Honma S, Katsuno Y, Abe H, Honma K. 2 distinct oscillators in the rat suprachiasmatic nucleus in-vitro. Proceedings of the National Academy of Sciences of the United States of America. 1995;92:7396–7400. doi: 10.1073/pnas.92.16.7396. [DOI] [PMC free article] [PubMed] [Google Scholar]
- Strecker GJ, Wuarin JP, Dudek FE. GABA(A)-mediated local synaptic pathways connect neurons in the rat suprachiasmatic nucleus. Journal of Neurophysiology. 1997;78:2217–2220. doi: 10.1152/jn.1997.78.4.2217. [DOI] [PubMed] [Google Scholar]
- Strogatz SH. From Kuramoto to Crawford: exploring the onset of synchronization in populations of coupled oscillators. Physica D. 2000;143:1–20. [Google Scholar]
- To TL, Henson MA, Herzog ED, Doyle FJ. A molecular model for intercellular synchronization in the mammalian circadian clock. Biophysical Journal. 2007;92:3792–3803. doi: 10.1529/biophysj.106.094086. [DOI] [PMC free article] [PubMed] [Google Scholar]
- Vandenpol AN. THE HYPOTHALAMIC SUPRACHIASMATIC NUCLEUS OF RAT - INTRINSIC ANATOMY. Journal of Comparative Neurology. 1980;191:661–702. doi: 10.1002/cne.901910410. [DOI] [PubMed] [Google Scholar]
- Vandenpol AN, Tsujimoto KL. Neurotransmitters of the hypothalamic suprachiasmatic nucleus - immunocytochemical analysis of 25 neuronal antigens. Neuroscience. 1985;15:1049–+. doi: 10.1016/0306-4522(85)90254-4. [DOI] [PubMed] [Google Scholar]
- Vasalou C, Henson MA. A Multiscale Model to Investigate Circadian Rhythmicity of Pacemaker Neurons in the Suprachiasmatic Nucleus. Plos Computational Biology. 2010;6 doi: 10.1371/journal.pcbi.1000706. [DOI] [PMC free article] [PubMed] [Google Scholar]
- Vasalou C, Herzog ED, Henson MA. Small-World Network Models of Intercellular Coupling Predict Enhanced Synchronization in the Suprachiasmatic Nucleus. Journal of Biological Rhythms. 2009;24:243–254. doi: 10.1177/0748730409333220. [DOI] [PMC free article] [PubMed] [Google Scholar]
- Vasalou C, Herzog ED, Henson MA. Mutlicellular Model for Intercellular Synchronization in Circadian Neural Networks. Biophysical Journal. 2011;101:12–20. doi: 10.1016/j.bpj.2011.04.051. [DOI] [PMC free article] [PubMed] [Google Scholar]
- von Gall C, Duffield GE, Hastings MH, Kopp MDA, Dehghani F, Korf HW, Stehle JH. CREB in the mouse SCN: A molecular interface coding the phase-adjusting stimuli light, glutamate, PACAP, and melatonin for clockwork access. Journal of Neuroscience. 1998;18:10389–10397. doi: 10.1523/JNEUROSCI.18-24-10389.1998. [DOI] [PMC free article] [PubMed] [Google Scholar]
- Webb AB, Angelo N, Huettner JE, Herzog ED. Intrinsic, nondeterministic circadian rhythm generation in identified mammalian neurons. Proceedings of the National Academy of Sciences of the United States of America. 2009;106:16493–16498. doi: 10.1073/pnas.0902768106. [DOI] [PMC free article] [PubMed] [Google Scholar]
- Yamaguchi S, Isejima H, Matsuo T, Okura R, Yagita K, Kobayashi M, Okamura H. Synchronization of cellular clocks in the suprachiasmatic nucleus. Science. 2003;302:1408–1412. doi: 10.1126/science.1089287. [DOI] [PubMed] [Google Scholar]