Abstract
Background.
QT dispersion (QTd) is increased in patients with dilated cardiomyopathy. Increased QTd has been associated with the risk of sudden death. We studied: a) the relation between QTd on 12-lead ECG and QTd-ECG Holter; b) the relation between QTd apex (QTda) and QTd end (QTde) on ECG Holter and the risk of ventricular arrhythmias in patients with dilated cardiomyopathy.
Methods and Results:
65 patients with dilated cardiomyopathy (33 idiopathic and 32 post-ischemic etiology; NYHA II–III) were studied. We divided the patients into: Group A -patients with not-sustained ventricular arrhythmias-; and Group B -patients without arrhythmias-. A significant direct correlation between QTd calculated from 12-lead ECG and from ECG Holter was found in all patients. QTda/24h was not significantly different in the two groups (Gr.A 59.9±7.8 msec vs Gr.B 53.6±8.4 msec p=ns) while QTde/24h was significantly higher in Group A (Gr.A 81.9±5.9 msec vs Gr.B 44.5±6.8 msec; p<0.005). In post-ischemic etiology (32 pts; 17 with arrhythmias) the correlation between QTde/24h and ventricular arrhythmias was confirmed (Gr.A 81.4±7.8 msec vs Gr.B 42.6±6.2 msec p<0.002).
Conclusions:
ECG Holter recordings can evaluate QTd as well as the QTd on 12-lead ECG. An increased QTde/24h seems to be correlated with the occurence of ventricular arrhythmias in patients with dilated cardiomyopathy and can then be a useful tool to select patients at high risk for sudden death.
KEY WORDS: QTdispersion, ECG-Holter, Ventricular arrhythmias, Dilated cardiomyopathy, Sudden death
INTRODUCTION
The QT dispersion (QTd) is the difference between QT max and QT min on the surface ECG and corresponds to the time between the beginning of depolarization and the end of repolarization: it is a marker of inhomogeneity in ventricular refractoriness. QTd in normal subjects varies from 20 to 40 msec (1), but other authors have proposed 65 msec (2).
QTd prognostic value regarding the risk of life-threatening ventricular arrhythmias is not fully established in post-myocardial infarction patients (3). An increased QTd value has been associated with the risk of sudden death in patients with idiopathic dilated cardiomyopathy (4, 5). Other studies suggest that QTd seems to have poor prognostic value regarding arrhythmic mortality in advanced heart failure (6), and in nonischemic dilated cardiomyopathy (7).
Therefore QTd could be a prognostic marker of tachyarrhytmic events but it is still unclear whether this applies to patients with idiopathic dilated cardiomyopathy or after a myocardial infarction.
In dilated cardiomyopathy and coronary artery disease, repolarization is abnormal, thus the differences in measured QTd can be influenced by variations in projection of the T wave loop, in particular the end of the T wave. Several methods consider the apex of the T wave as a fiducial point of the ventricular repolarization (8), but it does not really represent the end of the repolarization of all the myocardial cells (9). It is, therefore, interesting to calculate both QTapex dispersion (QTda) and QTend dispersion (QTde) for a better evaluation of the arrhythmic risk in these patients.
Aim of the present study was to evaluate:
- the relation between QTd on 12-lead ECG and on Holter monitoring;
- the relation between QT dispersion on 24 hour Holter ECG and the occurence of ventricular arrhythmias in a population of patients with idiopathic or post-ischemic dilated cardiomyopathy.
MATERIALS AND METHODS
Study population:
Sixty-five consecutive patients (48 men, 17 women; mean age 59±5 years; NYHA class II–III), 33 with idiopathic dilated cardiomyopathy (IDC) and 32 with post-ischemic dilated cardiomyopathy (PIDC), underwent: 12-lead ECG, 24-hour Holter recordings and transthoracic echocardiography (TTE). The study was performed with the subjects’ consent.
Inclusion criteria:
All patients were on sinus rhythm; absence of complete bundle branch block at 12-lead ECG was required. All patients were free from antiar-rhythmic drugs. Ejection fraction at TTE less than 35% was considered cut-off for inclusion.
Control group:
Forty-five normal subjects (31 men) with a mean age of 46±12 years, without any finding of cardiovascular disease at medical examination, with a normal 12-lead ECG and free from any drugs, underwent Holter recording (Tab. I).
TABLE I.
| Study population | |||
|---|---|---|---|
| IDC | PIDC | NS | |
| Number | 33 | 32 | 45 |
| Age (years) | 56±9 | 57±4 | 46 ±12 |
| LV EF (%) | 24±7 | 25±8 | – |
| LVDd (cm) | 6.7±1.8 | 6.6±2.1 | – |
| Anti-arrhythmic Drugs |
0 | 0 | 0 |
LV EF = Left Ventricular Ejection Fraction
LVDd = Left Ventricular Diastolic diameter
IDC = Idiopathic Dilated Cardiopathy
PIDC= Post-Ischemic Dilated Cardiopathy
NS = Normal Subjects
TABLE II.
| PIDC + IDC (65 pts) | NS (45 pts) | |
|---|---|---|
| QTde 12-lead ECG | 65.4±8 msec* 3 | 7.4±11.9 msec° |
| QTde ECG Holter | 62.4±20.4 msec* | 43.4±19.4 msec° |
| QTda 12-lead ECG | 73.5±9.9 msec # | 38.4±22.4 msec· |
| QTda ECG Holter | 56.3±7.5 msec # | 41.3±17.6 msec· |
p=ns
p=ns
p=ns
p <0.05
PIDC = Post-Ischemic Dilated Cardiopathy
IDC = Idiopathic Dilated Cardiopathy
NS = Normal Subjects
ns= not significant
Holter recordings were analyzed using Elatec System. The recordings were performed using three orthogonal bipolar leads (3-OL) X,Y and Z. The X lead (horizontal plane) was positioned at the 4th intercostal space on the two mid-axillary lines; the Y lead (frontal plane) immediately under the right clavicle and on either the upper leg or left iliac crest; the Z lead (sagittal plane) at the 4th intercostal space (V2 position) and posteriorly on the left side of the vertebral column. Positive electrodes were respectively left, inferior and anterior. The ECGs were corrected for artifacts and templates adjusted if necessary. The Elatec Holter System (Ela Medical, France) (10) calculates the mean QT intervals over 30-second periods over 24 hours.
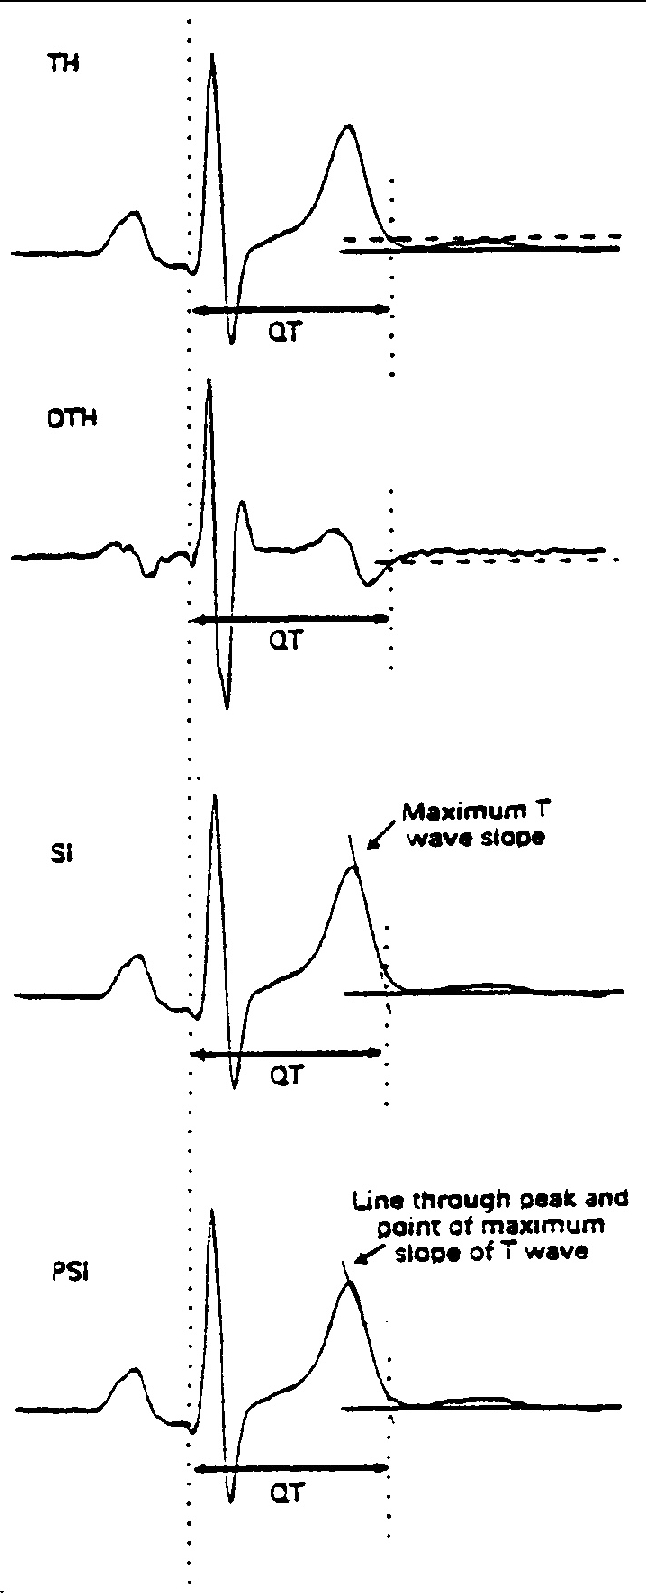
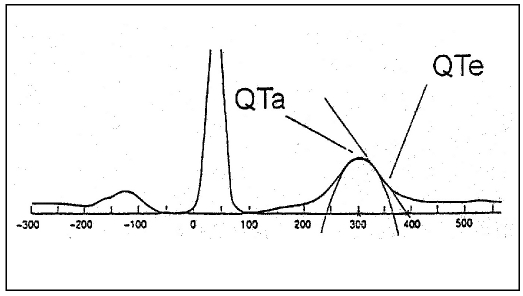
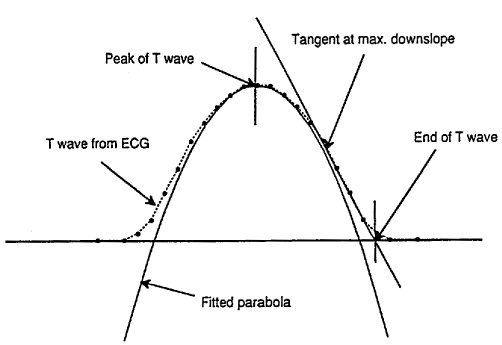
The software analyzes QT apex intervals determining the peak of the T wave: it fits a parabola through >20 microvolt samples of a window following the QRS complex. The end of the T wave is defined by the point of intersection of the maximal T wave deflection with the ECG baseline. Several Holter studies of ventricular repolarization mostly considered the Q to T apex interval because of problems in automatic identification of the end of the T wave (6, 9, 10). In this study we used a software to identify the end of the T wave in a simple way, after correcting for artifacts (Figs. 1, 2).
Fig. 1.
- Determination of QT apex: the peak of the T wave is defined by a parabola through the samples following the QRS complex. Determination of QT end: the end of the T wave is the point of baseline-intersection of a tangent drawn to the maximum of the T wave deflection.
Fig. 2.
- Determination of the peak and of the end of the T wave.
Fig. 3.

- Main automatic QT measurement. From top to bottom: threshold method applied to the original T wave (TH) or to its differential (DHT); tangent method to the steepest point of the descending limb of the T wave (SI); tangent method with a line through the T wave peak and the maximum slope point (PSI).
Using this software (11) we measured QT apex intervals (QTa: time between the onset of QRS and the apex of the T wave); QT end intervals (QTe: time between the onset of QRS and the end of the T wave); QTapex and QTend dispersion on Holter ECG (QTda/24 h and QTde/24h: mean value of all 2880 QTd measurements-one every 30 seconds- over 24 hours).
We also calculated QTda and QTde on 12-lead ECG in all patients. QTd was measured manually on 12-lead ECG. All the values of QT and QTd were corrected for heart rate.
Statistical analysis
All data are expressed as mean ± standard deviation. The statistical analysis was performed with Student’s t-test and the linear correlation co-efficient r. A two tailed p value <0.05 was considered statistically significant. To examine the predictors of ventricular arrhythmias we used a multivariate regression analysis.
RESULTS
In the control group no significant difference was found in QTde and QTda when calculated on 12-lead ECG and on Holter monitoring (QTde on 12-lead ECG: 37.4±11.9 msec VS QTde on Holter ECG: 43.4±19.4 msec p=ns); (QTda on 12-lead ECG: 38.4±22.4 msec VS QTda on Holter ECG: 41.3±17.6 msec p= ns).
In the study population no significant difference was found between QTde calculated from 12-lead ECG (mean values 65.4±8 msec) and from Holter recordings (62.4±20.4 msec). QTda values showed a greater difference (mean values 73.5±9.9 msec vs 56.3±7.5 msec).
In the second part of the study we divided the 65 patients into 2 groups: a) those with not-sustained ventricular arrhythmias on Holter recordings (Group A: 31 patients, 48%); b) those without ventricular arrhythmias (Group B: 34 patients, 52%).
We found that QTda/24h in group A was not significantly different from QTda/24h in group B (mean values: 59.9±7.8 msec vs 53.6±8.4 msec). On the other hand QTde/24h in group A was significantly higher than QTde/24h in group B (mean values: 81.9±5.9 msec vs 44.5±6.8msec p<0.005) (Tabs. III–IV).
TABLE III.
p=ns r= 0.89
| PIDC+IDC patients (65 pts) | ||
|---|---|---|
| Group A (31 pts) | Group B (34 pts) | |
| QTde/24h | 81.9±5.9 msec # | 44.5±6.8 msec # |
p<0.005 r= 0.45
PIDC = Post-Ischemic Dilated Cardiopathy
IDC = Idiopathic Dilated Cardiopathy
Group A = patients with ventricular arrhythmias
Group B = patients without venticular arrhythmias
ns= not significant
TABLE IV.
p=ns r= 0.83
p= <0.005 r= 0.52
PIDC = Post-Ischemic Dilated Cardiopathy
IDC = Idiopathic Dilated Cardiopathy
Group A = patients with ventricular arrhythmias
Group B = patients without venticular arrhythmias
ns= not significant
When we considered the subgroup with post-ischemic dilated cardiomyopathy (PIDC; 32 patients), 17 patients were included in group A (53%) and 15 in group B (47%). In post-ischemic patients the correlation between QTde/24h and ventricular arrhythmias was confirmed (81.4±7.8 msec in patients with arrhythmias vs 42.6±6.2 msec in patients without arrhythmias p<0.002). We also confirmed the absence of correlation between QTda/24h and arrhythmias in post-ischemic patients (Tab. V).
TABLE V.
p=ns r= 0.93
p<0.002 r= 0.49
PIDC = Post-Ischemic Dilated Cardiopathy
Group A = patients with ventricular arrhythmias
Group B = patients without venticular arrhythmias
ns= not significant
By multiple regression analysis QTde/24h on Holter monitoring and QTde on 12-lead ECG were only weakly predictive of ventricular arrhythmias in the overall study group and in the two subgroups (cut off values: >60 msec for QTde/24h, p=0.05; >65 msec for QTde on 12-lead ECG, p=0.06), while the other parameters (QTda/24h and QTda on 12-lead ECG) were not predictive.
DISCUSSION
Our study suggests and confirms (4,5) that QTd evaluated by Holter recordings (indicating temporal variability in QT dispersion interval) can provide the same information as QTd evaluated by 12-lead ECG (indicating the spatial variability in QTd). So the 24-hour Holter monitoring offers the opportunity to evaluate the temporal variability rather than the previously well-studied spatial variability in QT interval dispersion. Moreover the Holter recordings have the advantage of speeding-up and making the calculation easier as compared to the 12-lead method (10–12).
Several Holter studies of ventricular repolarization mostly considered the Q to T apex interval because of problems in automatic identification of the end of the T wave (6, 9, 14). In our study we used a software that allowed us to identify the end of the T wave in a simple way.
Comparing Holter and 12-lead ECG the correlation was stronger with QTde rather than QTda. These results stress the importance of the end of the T wave for the evaluation of repolarization heterogeneities, in particular in patients with dilated cardiomyopathy: in this population the end of the T wave provides some more information about repolarization than in normal subjects, as confirmed by various authors (13–16).
When we evaluated the episodes of ventricular arrhythmias we found that an increased QTde/24h was more strongly correlated with the evidence of arrhythmias on Holter ECG: this correlation was even stronger in post-ischemic patients in whom QTd is highly influenced by variations in projection of the T wave loop due to ischemia. On the other hand, we found no significant differences in QTda/24h in patients with or without arrhythmias in general population and in post-ischemic group.
The late repolarization contained in the end of the T wave is important for identification of disorders of QT interval and T wave in pathological situations such as idiopathic dilated cardiomyopathy and myocardial ischemia as suggested by other authors (16, 17). Myocardial ischemia can prolong QT interval and QT dispersion: the heterogeneities of spatial repolarization are increased and the arrhytmic risk is higher (18, 19).
These preliminary data allow us to conclude that the QTde/24h can give other important information about the inhomogeneity of myocardial repolarization also in patients with dilated cardiomyopathy and myocardial ischemia. In our opinion an increased QTde/24h seems to be useful to evaluate the risk of ventricular arrhythmias in patients with dilated cardiomyopathy.
The main limitation of our study is the lack of prognostic information on the patients’ follow up so that we did not provide an association between the outcome and the predictors of events: our principal aim was to compare QTd on Holter and ECG and to compare QTde with QTda. Moreover, normal subjects did not undergo complete cardiac evaluation to exclude occult disease.
CONCLUSIONS
Holter recordings can evaluate QTd (in particular QTd end) as well as the 12-lead ECGs and has the advantage of speeding-up and making the calculation easier.
QTd end/24h seems to be better than QTd apex/24h (and at least similar to QTd end/12–lead ECG) for the evaluation of disorders in ventricular repolarization and is more useful in identifying patients at higher risk of ventricular arrhythmias.
REFERENCES
- 1.Day CP, Mc Comb JM, Campbell RWF. QT-Dispersion: An indication of arrhythmia risk in patients with long QT-intervals. Br Heart J. 1990;63:342–4. doi: 10.1136/hrt.63.6.342. [DOI] [PMC free article] [PubMed] [Google Scholar]
- 2.Zaidi M, Robert A, Fesler R, Derwael C, Brohet C. Dispersion of ventricular repolarisation: A marker of ventricular arrhythmias in patients with previous myocardial infarction. Heart. 1997;78:371–5. doi: 10.1136/hrt.78.4.371. [DOI] [PMC free article] [PubMed] [Google Scholar]
- 3.Oikarinen L, Viitasalo M, Toivonen L. Dispersion of the QT interval in postmyocardial infarction patients with ventricular tachycardia or with ventricular fibrillation. Am J Cardiol. 1998;81:694–7. doi: 10.1016/s0002-9149(97)01002-3. [DOI] [PubMed] [Google Scholar]
- 4.De Bruyne MC, Hoes AW, Kors JA, Hofman A, Van Bemmel JH, Grobbee DE. QTc dispersion predicts cardiac mortality in the elderly. The Rotterdam Study. Circulation. 1998;97:467–72. doi: 10.1161/01.cir.97.5.467. [DOI] [PubMed] [Google Scholar]
- 5.Grimm W, Steder U, Menz V, Hoffmann J, Grote F, Maisch B. Clinical significance of increased QT dispersion in the 12-lead standard ECG for arrhythmia risk prediction in dilated cardiomyopathy. Pacing Clin Electrophysiol. 1996;19(11 Pt 2):1886–9. doi: 10.1111/j.1540-8159.1996.tb03246.x. [DOI] [PubMed] [Google Scholar]
- 6.Brendorp B, Elming H, Jun L, et al. QT dispersion has no prognostic information for patients with advanced congestive heart failure and reduced left ventricular systolic function. Circulation. 2001;103:831–5. doi: 10.1161/01.cir.103.6.831. [DOI] [PubMed] [Google Scholar]
- 7.Fauchier L, Douglas J, Babuty D, Cosnay P, Fauchier JP. QT dispersion in nonischemic dilated cardiomyopathy. A long term evaluation. Eur J Heart Fail. 2005;7:277–82. doi: 10.1016/j.ejheart.2004.07.009. [DOI] [PubMed] [Google Scholar]
- 8.Faisandier Y, Courville J, Nomazy JDE, et al. Validation of a new algorithm for automatic QT analysis on Holter system. Herzschrittmacher. 1992;12:71–2. [Google Scholar]
- 9.Sarubbi B, Esposito V, Ducceschi V, et al. Effect of blood gas deragement on QTc dispersion in severe chronic obstuctive pulmonary disease: Evidence of an electropathy. Int J Cardiol. 1997;58:287–92. doi: 10.1016/s0167-5273(96)02876-8. [DOI] [PubMed] [Google Scholar]
- 10.Hohnloser S.H, Van de Loo A, Arendts W, et al. QT-dispersion im Oberflachen-EKG als Parameter einer gesteigerten elektrischen Vulnerabilitat bei akuter Myokardischamie. Z Kardiol. 1993;82:678–82. [PubMed] [Google Scholar]
- 11.Tetsuro E, Ohe T, Aihara N, et al. Dynamic relationship between the Q-aT interval and heart rate in patients with long QT syndrome during 24-hour Holter ECG monitoring. PACE. 1995;18:1909–18. doi: 10.1111/j.1540-8159.1995.tb03840.x. [DOI] [PubMed] [Google Scholar]
- 12.Sarubbi B, Ducceschi V, Esposito V, et al. QTc dispersion in severe chronic obstructive pulmonary disease: Early marker of a blood gas mediated electropathy? New Trends in Arrhythmias. 1995;XI:306–7. [Google Scholar]
- 13.Viitasalo M, Karjalainen J. QT intervals and heart rates from 50 to 120 beats per minute during 24-hour electrocardiographic recordings in 100 healthy men. Circulation. 1992;86:1439–42. doi: 10.1161/01.cir.86.5.1439. [DOI] [PubMed] [Google Scholar]
- 14.Michelucci A, Conti A, Frati M, et al. Circadian pattern of the QT dispersion using three orthogonal leads of a Holter ECG in patients with heart failure. ANE. 1998;3:32–7. [Google Scholar]
- 15.Zareba W, Moss AJ. Dispersion of repolarization evaluated in three orthogonal-type electrocardiographic leads: L1, avF, V2. PACE. 1995;18:895–895. [Google Scholar]
- 16.Glancy JM, Garratt CJ, Woods KL, et al. Three-lead measurement of QTc dispersion. J Cardiovasc Electrophysiol. 1995;6:987–92. doi: 10.1111/j.1540-8167.1995.tb00375.x. [DOI] [PubMed] [Google Scholar]
- 17.Statters DJ, Malik M, Ward DE, et al. QT dispersion: Problems of methodology and clinical significance. J Cardiovasc Electrophysiol. 1994;5:672–85. doi: 10.1111/j.1540-8167.1994.tb01190.x. [DOI] [PubMed] [Google Scholar]
- 18.Zabel M, Portnoy S, Franz MR. Electrocardiographic indexes of dispersion of ventricular repolarization: An isolated heart validation study. J Am Coll Cardiol. 1995;25:746–52. doi: 10.1016/0735-1097(94)00446-W. [DOI] [PubMed] [Google Scholar]
- 19.Higham PD, Hilton CJ, Aitcheson JD, et al. Does QT dispersion reflect dispersion of ventricular recovery? Circulation. 1992;86(suppl I):I–392. [Google Scholar]


