

Abstract
Isochores are large regions of relatively homogeneous nucleotide composition and are present in the genomes of all mammals and birds that have been sequenced to date. The newly sequenced genome of Anolis carolinensis provides the first opportunity to quantify isochore structure in a nonavian reptile. We find Anolis to have the most compositionally homogeneous genome of all amniotes sequenced thus far, a homogeneity exceeding that for the frog Xenopus. Based on a Bayesian algorithm, Anolis has smaller and less GC-rich isochores compared with human and chicken. Correlates generally associated with GC-rich isochores, including shorter introns and higher gene density, have all but disappeared from the Anolis genome. Using genic GC as a proxy for isochore structure so as to compare with other vertebrates, we found that GC content has substantially decreased in the lineage leading to Anolis since diverging from the common ancestor of Reptilia ∼275 Ma, perhaps reflecting weakened or reversed GC-biased gene conversion, a nonadaptive substitution process that is thought to be important in the maintenance and trajectory of isochore evolution. Our results demonstrate that GC composition in Anolis is not associated with important features of genome structure, including gene density and intron size, in contrast to patterns seen in mammal and bird genomes.
Keywords: GC content, intron, gene density, recombination, genome structure, effective population size
Introduction
Isochores are regions of the genome with a relatively homogeneous G or C (GC) content over lengths exceeding 300 kb (Cuny et al. 1981; Bernardi 2001; Lander et al. 2001; Li et al. 2003; Costantini et al. 2006). These chromosomal regions have been extensively studied owing to associations observed between GC content and many genomic properties including gene density (Mouchiroud et al. 1991), intron length (Duret et al. 1995), recombination rate (Fullerton et al. 2001), mutation rate (Hardison et al. 2003), DNA replication timing (Watanabe et al. 2002; Costantini and Bernardi 2008), and gene expression (D’Onofrio 2002). Nucleotide composition also covaries with the efficiency of natural selection (Fullerton et al. 2001; Montoya-Burgos et al. 2003; Meunier and Duret 2004), as mediated by local recombination rates. Genomic regions with low recombination rates, which are often GC-poor, by extension possess a reduced population size, decreasing the efficiency of selection relative to genetic drift, a phenomenon called Hill–Robertson interference (Hill and Robertson 1966; Comeron et al. 2008). Conversely, GC-rich isochores tend to have higher crossover rates that elevate the local genomic effective population size, thereby decreasing the effects of Hill–Robertson interference and increasing the efficiency of purifying selection relative to genetic drift (Comeron et al. 2008). Nevertheless, it is unclear whether and how nucleotide composition asserts a direct causal influence on these properties.
Isochores are prominent features of mammal and bird genomes (Lander et al. 2001; International Chicken Genome Sequencing Consortium (ICGSC) 2004; Costantini et al. 2009). Bernardi (2000) described four families of isochores in vertebrates as overlapping distributions of GC composition, one having a low-GC content (L; mean GC% = 39%) and three with high-GC content (H1, H2, and H3; mean GC% = 44%, 48%, and 53%, respectively). Mammals and chickens have isochores from all four families, ranging in size from 300 to over 1,000 kb; there are, however, underrepresentations of H isochores in opossum and of L isochores in platypus (Costantini et al. 2009). The presence and conservation of isochores in both mammalian and avian genomes, together with their absence in more phylogenetically basal vertebrate genomes, imply that they originated in an early amniote ancestor, which comparative studies suggest had a bird-like karyotype with strong GC-rich microchromosomes (Duret et al. 2006; Ellegren 2007; Janes et al. 2010). Subsequent chromosomal fission and fusion and isochore strengthening and erosion appear to have shaped the base compositional structures seen today. Isochore structure evolution appears ongoing among mammalian lineages, with some exhibiting eroding GC-rich isochores (e.g., primates), whereas others exhibiting strengthening of GC-rich isochore structure (Romiguier et al. 2010). Isochore erosion reflects a dominance of G/C-to-A/T substitutions, whereas isochore strengthening indicates a dominance of A/T-to-G/Csubstitutions, likely by recombination-associated GC-biased gene conversion (gBGC; Duret et al. 2002; Belle et al. 2004). Smaller bodied animals, which tend to have larger effective population sizes (Ne), are expected to have increased efficacy of gBGC and thus strengthened isochores (Romiguier et al. 2010).
Despite their prolific organismal diversity, the poikilothermic nonavian reptiles are genomically undersampled among amniotes (Janes et al. 2008). Most of the evidence for isochores in reptiles derives from centrifugation experiments (Olmo 1981, 1984) or from studies of small numbers of genes. For example, extensive variation in CsCl fractionation for snake, turtle, and crocodile genomes indicates genome-wide GC compositions lying between those found in mammals or birds and non-amniote vertebrates (Hughes et al. 2002). Measures of GC content at third codon positions (GC3) in a handful of genes implied some isochore structuring in the turtle and crocodile genomes (Hughes et al. 1999; Chojnowski et al. 2007; Fortes et al. 2007; Chojnowski and Braun 2008). The use of GC3 as a proxy for isochore structure has recently come under scrutiny (e.g., Elhaik et al. 2009), but see Clay and Bernardi (2011) and Romiguier et al. (2010)), but our own investigation found strong correlations of GC3 with 100 kb of flanking sequence (see Results). The recent availability of the lizard (Anolis carolinensis) genome sequence now permits the first direct measurement of isochore structure in a nonavian reptile (Alföldi et al. 2011). The Anolis genome is ∼2.15 GB (Peterson et al. 1994) and consists of 6 large macrochromosomes and 12 smaller microchromosomes. Our initial surveys of GC composition in the Anolis genome reveal the most homogeneous amniote genome yet known, with no “classical” (>300 kb) GC-rich isochores and the most narrow GC content distribution of any amniote sequenced thus far.
Materials and Methods
Data
We primarily relied on genomes available from Ensembl Release 61, which includes the second release of the Anolis genome, AnoCar 2.0, as well as assembly version Hg19 for human and version 2.1 for chicken. For gene-based analyses (such as, the calculation of gene-specific GC contents), we employed a set of 3,994 one-to-one orthologous genes that were identified using the OPTIC pipeline for the Anolis genome report (Alföldi et al. 2011; Heger and Ponting 2007a). This gene set allowed comparisons of genic characteristics and evolutionary rates across eight amniotes (human, mouse, dog, opossum, platypus, chicken, zebra finch, and lizard) using zebra fish as an outgroup.
Testing Nucleotide Compositional Heterogeneity in Anolis
We first constructed distributions of GC composition for the Anolis, human, chicken, and Xenopus frog genomes using GC contents of 3,000-bp nonoverlapping windows; this window size is adequate for examining both large and small scale variation in GC content (see below). Second, we compared the spread of GC content expected from absolute homogeneity around the genomic mean with the observed spread. Assuming a uniform distribution with a mean genomic GC content of x, the expected standard deviation is , where w is the size (in bp) of the window used to partition the genome. Third, we tested whether each chromosome in Anolis exhibited a homogeneous GC content using analysis of variance (Li et al. 2003). We first partitioned the genome into nonoverlapping windows of 300 kb and each window into smaller 20 kb subwindows. Any subwindow with >20% missing data was discarded, and we only considered those 300-kb windows with all 15 subwindows. Because GC content based on these windows is not normally distributed for each macrochromosome (Shapiro–Wilk test, P < 1.0 × 10⁻⁹ for each macrochromosome and for linkage group c), we conducted the rank-based Kruskal–Wallis analysis of variance (ANOVA) tests. Several of the microchromosomes (linkage groups a, b, d, and f) could not reject normality, and we therefore conducted standard ANOVA together with Kruskal–Wallis tests.
Identification of Isochores
Fearnhead and Vasileiou (2009) developed a method for detecting isochores that coestimates isochore structure and identity under a model-based Bayesian approach. This method (hereafter termed the FV2009 method) finds the joint posterior distribution of switchpoints between isochores (C) and isochore family assignments for each isochore (Z) given a genomic sequence as represented by a vector of GC compositions (y): P(C, Z|y). Full details of the FV2009 algorithm are provided in Fearnhead and Vasileiou (2009).
We divided each chromosome of the Anolis genome assembly into nonoverlapping 3-kb windows, ignoring windows with 20% or more missing data; FV2009 judged this window length to be adequate for the examination of both fine-scale and large-range GC composition variation in the human genome. We ran FV2009 from K = 1 to 4 isochore families, setting mean GC contents between 0.35 and 0.53 for each family [(0.35, 0.45) for K = 2; (0.37, 0.44, 0.50) for K = 3; and (0.39, 0.44, 0.48, 0.53) for K = 4, which corresponds to mean GC contents of isochore families in Bernardi (Bernardi 2000)]. FV2009 also estimates a hidden Markov model (HMM) for transitions between isochores along a chromosome; initial transition probabilities for the HMM were set to 0.1. We ran the algorithm for 100 iterations, drawing 100 samples from the posterior to perform the Monte Carlo integration. This strategy was sufficient for the Markov chain to converge, as assessed by a plateau of likelihood scores plotted over the course of the analysis. To determine the appropriate value of K, we conducted hierarchical likelihood ratio tests using the likelihood value from the last iteration of the Markov chain for each pairwise comparison between K = 2 and K = 4. The FV2009 Bayesian approach does not discriminate between the size of each “isochore,” and therefore, the resulting structure consists of many small homogeneous segments. To identify “classical” isochores, or those exceeding 300 kb in length, we followed Fearnhead and Vasileiou (2009) by identifying >300-kb stretches of 3-kb windows that belong to the same isochore family and testing whether these stretches are homogeneous compared with the chromosome on which it resides using a one-tailed F-test (Cohen et al. 2005), adjusting the P value to correct for multiple comparisons. For this F-test, we first arcsin-transformed the GC contents of 3-kb windows for both the putative classical isochore and the entire chromosome. The F-test then examined the homogeneity of the putative isochore with respect to the whole chromosome (Ho: isochore variance ≥ chromosomal variance; HA: isochore variance < chromosomal variance). For comparison, we also examined isochore structures in human and chicken genomes.
Erosion of Isochores in Anolis
Because we cannot directly analyze putatively orthologous isochores owing to the very limited amount of sequence outside of exons that aligns between avian, lizard, and mammalian genomes, we used protein-coding genes whose GC contents at the third positions of codons (GC3) may be calculated from accurate amino acid–based alignments. We examined models of GC sequence evolution using NHML (employing default parameters), a program suite that does not assume equilibrium nucleotide composition, an important feature for measuring compositional changes along branches in a phylogeny (Galtier and Gouy 1998). We used a set of 3,994 simple (1-to-1) orthologous genes across all of eight amniote species, with the rooted species tree (((((human, mouse), dog), opossum), platypus), ((chicken, zebra finch), lizard)), and zebra fish as an outgroup. These genes are those identified using the OPTIC pipeline to identify orthologous relationships of the genes across all nine genomes and to calculate lineage-specific substitutions rates (the ratio of numbers of nonsynonymous substitutions per nonsynonymous site and synonymous substitutions per synonymous site, dN/dS) via the codeml program in the PAML package (Heger and Ponting 2007a; Yang 2007). For this, we employed the OPTIC pipeline, which uses the Goldman and Yang (1994) approach and F3x4 equilibrium codon frequencies (Yang 2007; further details on the OPTIC pipeline and evolutionary rate analyses can be found in Heger and Ponting 2007a, 2007b). We used the ancestral GC3 values estimated from NHML to calculate Di,j, the GC3 divergences between two nodes i and j for n genes, using the formula:
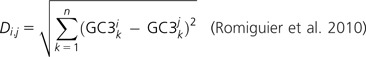 |
To visualize GC3 across the amniote phylogeny, we used branch lengths proportional to Di,j and the rooted topology specified above to generate a phylogram (Romiguier et al. 2010). To determine the direction of GC3 evolution in each lineage (increasing or decreasing), we calculated the change in GC3 along terminal branches as well as between current GC3 and GC3*, or the GC3 toward which a lineage is evolving (the equilibrium GC3). We did not correct for hypermutability in calculating GC3* as studies have found insignificant influence of CpG doublets on GC3 evolution, particularly over deep timescales (Belle et al. 2004; Romiguier et al. 2010).
The utility of GC3 as a proxy for isochore structure has recently attracted controversy (Elhaik et al. 2009; Romiguier et al. 2010; Clay and Bernardi 2011). To justify our use of GC3, we examined the relationship of GC3 and the surrounding genomic GC environment. We used the 3,994 gene set of 1:1 orthologs and first removed any genes that were near to being mutationally saturated (lineage-specific dS > 1) and/or had experienced positive selection (lineage-specific dN/dS > 1). We further filtered the data to include only genes with long open-reading frames (>1,000 bp) to prevent bias in genic GC calculations that can arise from small sample sizes of nucleotides in short sequences. To investigate whether genic GC values reflect those of the local genomic environment, we examined the relationship between GC3 and the GC content of 100 kb of flanking sequence (50 kb upstream + 50 kb downstream of the gene; hereafter “flanking GC”; sample sizes were 3,153 genes for human, 2,758 genes for chicken, and 2,009 genes for Anolis). We also examined correlations of flanking GC among Anolis, human, and chicken orthologous genes, the strength of which should reflect the degree of shared isochore structure.
Correlations with GC Content—Noncoding Genomic Sequence, Chromosome Length, Selection, and Crossover Rate
We tested whether two key features that correlate with isochore structure in mammals and birds, intron length and gene density, also existed in the Anolis genome despite its greater compositional homogeneity. For the following, we considered “intron length” as the total sum of intron sequence per gene, and we measured gene density with “intergenic length” or the span of sequence between the annotated start and stop position of adjacent genes (which may or may not be start and stop codons), using data from Ensembl Release 61. We arbitrarily chose one transcript to represent a gene with multiple annotated transcripts. Intron and intergenic data were analyzed separately. We binned the introns and intergenic regions into ten equally sized bins based on their length and tested for differences of GC content among the bins using the Kruskal–Wallis test and post hoc Wilcoxon rank-sum tests.
We next tested whether crossover rates are more homogeneous in Anolis than in human and chicken, using the suppression of lineage-specific dN/dS as an indicator of increased crossover rate. This is appropriate because the efficiency of purifying selection, and hence, the efficiency of suppression of nonsynonymous mutations is greater in regions with higher recombination and hence crossover rates. After filtering for small genes (<1 kb), genes undergoing lineage-specific positive selection (dN/dS > 1) and saturated genes (dS > 1), we divided the simple orthologous genes described above into two equally populated sets: a set with high flanking GC values (exceeding the median value) and a set with low flanking GC values (less than the median value). We then used lineage-specific dN/dS for each of the two sets for human, chicken, and Anolis and tested whether their distributions were equivalent using the Kolmogorov–Smirnov two-sided test. We expect to see similar dN/dS distributions values between the two gene sets if crossover rates are homogeneous in Anolis. This result would arise because we expect the contribution of the higher efficacy of purifying selection in regions of high recombination in human and/or chicken to the suppression of dN/dS values would be greatly reduced in the more homogeneous recombination landscape in Anolis.
Results
Anolis Genome Composition Is SurprisinglyHomogeneous
Using nonoverlapping windows of 3 kb, we found that the Anolis genome shows an unusually homogeneous base composition centered around a genome average of 39.9% (fig. 1). Despite similar genome-wide averages between amniotes, the SD of GC composition in Anolis (mean = 0.399, SD = 0.035) is about half the value in human (mean = 0.409, SD = 0.064) and about 62% of the value in chicken (mean = 0.411, SD = 0.056) (table 1). This pattern indicates that Anolis has a compositionally more homogeneous genome than do human, chicken, and frog, which was already known to possess a greatly reduced GC-rich isochore structure compared with mammals and birds (Costantini et al. 2009).
FIG. 1.

Distributions of GC content in vertebrate genomes. Distributions are based on GC contents of 3-kb windows for genomes of human, chicken, Xenopus frog, and Anolis.
Table 1.
Summary of Genomic GC Content
| Species | Chromosome | Length | Mean GC | SD | KW Test Pa |
| Anolis | 1 | 263920459 | 0.399 | 0.036 | <2.2 × 10⁻¹⁶ |
| 2 | 199619896 | 0.403 | 0.035 | <2.2 × 10⁻¹⁶ | |
| 3 | 204416411 | 0.397 | 0.037 | <2.2 × 10⁻¹⁶ | |
| 4 | 156502445 | 0.397 | 0.034 | <2.2 × 10⁻¹⁶ | |
| 5 | 150641574 | 0.395 | 0.034 | <2.2 × 10⁻¹⁶ | |
| 6 | 80741956 | 0.399 | 0.034 | <2.2 × 10⁻¹⁶ | |
| Linkage group a | 7025929 | 0.407 | 0.031 | 0.301 | |
| Linkage group b | 3271538 | 0.418 | 0.032 | 0.007095 | |
| Linkage group c | 9478906 | 0.402 | 0.033 | 5.162 × 10−06 | |
| Linkage group d | 1094479 | 0.389 | 0.027 | 0.13 | |
| Linkage group f | 4257875 | 0.429 | 0.034 | 0.003366 | |
| Linkage group g | 424766 | 0.429 | 0.032 | — | |
| Linkage group h | 248370 | 0.406 | 0.026 | — | |
| Genome | 1081644604 | 0.399 | 0.035 | — | |
| Chicken | Genome | 1031882473 | 0.411 | 0.056 | — |
| Human | Genome | 3095677436 | 0.409 | 0.064 | — |
| Xenopus | Genome | 1510906283 | 0.398 | 0.040 | — |
Kruskal-Wallis test of GC content homogeneity per chromosome/linkage group.
For GC content measured using nonoverlapping windows in a compositionally homogeneous genome, the spread (SD) should decrease by half as window size quadruples (see Materials and Methods). The magnitude of the spread exceeds expected values in all of the genomes that we examined (fig. 2), an indication that they all exhibit, to different degrees, GC content heterogeneity. In addition, all genomes do not exhibit the expected 2-fold decrease in the GC spread as window size quadruples; for human and chicken, the GC spread reduces by only 6–11% (fig. 2). Anolis has, by far, the most homogeneous genome in our comparisons, in terms of both the magnitude of GC spread and the degree to which it decreases as window size increases (25–34% decrease in SD; fig. 2). Kruskal–Wallis tests indicate that most Anolis chromosome compositions are significantly heterogeneous (as seen in fig. 2, even though Anolis has the most homogeneous genome), though these tests could not reject homogeneity for two Anolis microchromosomes, a and d (supplementary table 1, Supplementary Material online).
FIG. 2.

Observed and expected reduction of genomic GC spread for increasing window size. SDs were calculated for increasing window lengths (x axis) in human (+), chicken (□), Xenopus frog (Δ), and Anolis (×). The expected curve (O) is based on calculations from human mean GC content (see Materials and Methods), but it is nearly identical for those of the other genomes.
The Anolis Genome Contains Mostly One Classical Isochore Type
We used a model-based Bayesian approach employing a Markov chain Monte Carlo method to simultaneously estimate isochore structure and identity (Fearnhead and Vasileiou 2009). On the basis of hierarchical likelihood ratio tests (supplementary table 2, Supplementary Material online), we found that three isochore families best explained the data for each macrochromosome in Anolis, one of which is 39–40% GC, whereas the two others have 49–52% GC. We identified 820 putative classical isochores of which 499 show a more homogeneous GC content than their respective parent chromosome based on one-tailed F-tests (P value adjusted for multiple tests; Cohen et al. 2005). All the homogeneous classical isochores belonged to the low-GC isochore family. The average length of a homogeneous classical isochore is 512 kb, and together, these isochores cover only 15% of the genome. Figure 3 shows the locations of these isochores on the six macrochromosomes.
FIG. 3.

GC composition along Anolis macrochromosomes. Graphs are based on GC contents of 3-kb windows, ignoring windows with >20% missing data. The bars above the plots represent classical isochores (>300 kb in length).
For comparison, we also examined isochore structures in human and chicken. We used FV2009 for K = 3 and 4, finding K = 3 best explained the chicken data (23 of 30 chromosomes could not reject K = 3 isochore families; supplementary table 2, Supplementary Material online), whereas K = 4 best explained the human data (6 of 24 chromosomes could not reject K = 3 chromosomes; supplementary table 2, Supplementary Material online). Classical isochores constitute 54% of the chicken genome with an average size of 1.33 Mb, whereas they constitute 71% of the human genome and have an average size of 1.81 Mb (supplementary table 3, Supplementary Material online). The distributions of homogeneous classical isochore sizes are much narrower in Anolis than in chicken and human (supplementary fig. 1, Supplementary Material online). The genomic isochore densities are 462 isochores/Gb in Anolis, 628 isochores/Gb in chicken, and 441 isochores/Gb in human.
Finally, we compared isochore structures among one of the largest syntenic regions between chicken chromosome 5 (7.8 Mb), human chromosome 14 (20.3 Mb), and Anolis chromosome 1 (13 Mb). Despite differences in scale, the GC profiles of human and of chicken are highly similar but are very different from the homogeneous GC landscape of orthologous Anolis sequence (supplementary fig. 2, Supplementary Material online; Alföldi et al. 2011).
Erosion of Isochores in Anolis
Figure 4 shows a phylogenetic tree whose branch lengths are proportional to GC3 divergence, Di,j, between two nodes i and j (see Materials and Methods). The amniote ancestor is estimated to have had a high GC3 composition (62.7%), indicative of strong isochore structure. Long branch lengths leading to both the mammal and reptile clade are a strong indication of diverging isochore structure since the amniote ancestor. Consistent with previous results (Romiguier et al. 2010), we found evidence for dynamic isochore evolution at more recent timescales. Opossum and Anolis lineages are estimated to have each experienced the largest decreases in GC3 (−7.6% over ∼176 My and −7.8% over ∼275 My, respectively; Madsen 2009; Shedlock and Edwards 2009), with further decreases expected based on equilibrium GC content (GC3*). On the other hand, several mammals (mouse, dog, and platypus) and zebra finch exhibited lineage-specific increases of their GC3 values, with further increases estimated in all but dog, whose GC3 composition has changed little since the placental ancestor.
FIG. 4.

Amniote phylogeny with branch lengths proportional to Di,j. Di,j is the divergence of GC3 between two nodes of a branch. Black branches represent decreases of GC3, whereas gray branches represent increases of GC3. The current GC3 and the equilibrium GC3* are also shown and demonstrate the expected continued trajectory of GC content evolution.
Correlations between GC Content and Noncoding Genomic Sequence and dN/dS
In the human and chicken genomes, flanking GC is strongly correlated with a gene’s GC3 value (fig. 5A). This relationship has been shown repeatedly on scales over tens of kilobases, which is the scale at which classical isochores are observed (Romiguier et al. 2010). A significant correlation remains between flanking GC and GC3 in Anolis, but this is considerably weaker than observed in human or chicken (r2 = 0.21 vs. 0.40 and 0.44 in human and chicken, respectively; P < 2.2 × 10⁻¹⁶). This implies that even in a genome with significant erosion of GC-rich isochores, genic GC3 still reflects, at least in part, the local nucleotide composition environment. Flanking GC contents of orthologous genes are similar between human and chicken, implying similar GC architectures between mammals and birds (fig. 5B). Although still significant, this relationship diminishes substantially in comparisons of flanking GC values between lizard and human or chicken (fig. 5B), which again reflects an unexpected departure from the amniote pattern of the compositional landscape in Anolis.
FIG. 5.

Correlations with flanking GC content. (A) Flanking GC content exhibits greater correlation with GC3 (genic GC at third codon positions) in human and chicken (higher r2) than in Anolis. (B) Flanking GC content correlate between human and chicken, implying conserved isochore structure in mammals and birds, but less so between Anolis and human or chicken. Sample sizes (N) include genes with long open-reading frame (length > 1,000 bp) that were not saturated (dS < 1) or undergoing positive selection (dN/dS < 1).
To investigate whether crossovers in Anolis occur more uniformly across the genome than in human and chicken, we divided the set of simple orthologous genes into two groups: a low-GC flanking set and a high-GC flanking set based on the median flanking GC value for each species. We then examined lineage-specific dN/dS for both groups: if recombination rate is heterogeneous, then the distributions of dN/dS for low-GC and high-GC genes will be different, whereas homogeneous recombination should result in similar dN/dS distributions between the groups. We reasoned that because recombination increases the efficacy of selection, purifying selection (as indicated by lower dN/dS values) will tend to be more effective in regions with high crossover rates (Comeron et al. 2008). As our analysis assumes that most genes have not experienced positive selection and that the Hill–Robertson effectmodulates the rate at which deleterious alleles are purged (Hill and Robertson 1966), we filtered the genes for those exhibiting positive selection (dN/dS > 1; see Materials and Methods). As expected, lineage-specific dN/dS values were significantly lower in the high flanking GC gene set in all three species (Kolmogorov–Smirnov two-sided tests; table 2). This is consistent with Hill–Robertson interference: genes in low-GC regions tend to experience reduced recombination rates relative to high-GC environments and therefore exhibit reduced selection efficiency and hence increased dN/dS. The median dN/dS values for genes flanked by higher GC values in human or chicken were 19.8% and 18.0% lower, respectively, compared with median dN/dS values for genes flanked by lower GC values. Though still significant, this disparity for Anolis was much reduced (10.7%), which would be consistent with recombination being more homogeneous in Anolis than in human and chicken.
Table 2.
dN/dS Characteristics between High- and Low-GC Flanking Sequence
| Median dN/dS (Genes > 1,000 bp; dN/dS < 1; dS < 1) |
|||
| Low-GC Flank | High-GC Flank | Kolmogorov–Smirnov P Value | |
| Human | 0.091 | 0.073 | 6.1 × 10−05 |
| Chicken | 0.089 | 0.073 | 2 × 10−05 |
| Anolis | 0.084 | 0.075 | 0.0028 |
As GC content shows inverse correlations with both intron and intergenic length in mammals and birds, we sought to investigate these relationships in Anolis. Figure 6 shows clear trends between GC contents of binned intergenic (fig. 6A) and intron (fig. 6B) lengths in human and chicken. Kruskal–Wallis tests rejected the null hypothesis of equal population medians among these bins for either intron or intergenic sequence in all three genomes (supplementary table 4, Supplementary Material online). For intergenic sizes, all bins for human and all but two bins (G4 and G5) in chicken were significantly different from one another based on Mann–Whitney U tests and after applying a Bonferroni correction for multiple tests (P < 0.001; supplementary table 5, Supplementary Material online). In contrast, 19 of 45 bin comparisons could not reject the null expectation of equal values in Anolis (P > 0.001; supplementary table 5, Supplementary Material online). For intron sizes, all human bins were again significantly different from each other, and all but one pair (bins G9 and G10) were significantly different in chicken (supplementary table 5, Supplementary Material online). The only significant comparisons for Anolis introns were those involved the first bin, A1 (supplementary table 5, Supplementary Material online). These results, along with figure 6, illustrate reduced associations between GC content and lengths of noncoding sequence in Anolis when compared with human or chicken.
FIG. 6.

GC content decreases as noncoding sequence length increases. Noncoding sequences were divided into ten bins based on length. The line connects median GC values from each bin. In human and chicken, GC content decreases as (A) intergenic and (B) intron sequence length increases but exhibits a flat relationship with noncoding sequence length in Anolis.
Discussion
Anolis Has a Very Homogeneous Genomic Nucleotide Composition Compared with Mammals and Birds
Previous studies using GC3 and CsCl fractionation provided evidence that the GC compositions of nonavian reptiles are diverse, spanning values between mammals and amphibians, and thus implying the presence of at least some GC-rich isochores (Hughes et al. 1999, 2002; Chojnowski et al. 2007; Fortes et al. 2007; Chojnowski and Braun 2008). Our findings demonstrate the A. carolinensis genome to be compositionally homogeneous, a finding that corroborates the patterns and processes of GC homogenization first observed by Costantini et al. (2009) using an earlier prerelease build of the Anolis genome. Although most Anolis chromosomes depart from compositional homogeneity, they do so to a much lesser extent than chromosomes in human, chicken, and even scaffolds of Xenopus, an amphibian that is generally thought to lack the strong GC-rich isochore structure seen in mammals and birds. Homogeneity of the Anolis genome is also evident in its isochore characteristics. After identifying base compositionally homogeneous tracts belonging to the same isochore family using a Bayesian approach, we discovered that the Anolis genome contains fewer isochores than either human or chicken relative to genome size. In addition, isochores are at least 50% smaller in Anolis than in chicken or human genomes (mean sizes: 0.512 Mb in Anolis, 1.33 Mb in chicken, and 1.81 Mb in human). The reduced isochore size in Anolis reflects the difficulty of identifying isochores within relatively compositionally homogeneous sequence.
Erosion of GC-Rich Isochores in the Anolis Lineage
Using the nonhomogeneous model of DNA evolution of Galtier and Gouy (1998), we found that the Anolis genome has experienced a reduction in GC3 and that contemporary GC content is not yet at equilibrium and continues to erode (fig. 4). Similar, but smaller, erosions have previously been observed for several lineages of mammals, including primates (Duret et al. 2002; Meunier and Duret 2004), and our results are consistent with those of Romiguier et al. (2010), who observed dynamic isochore evolution throughout placental mammals. Divergent trajectories are even seen between two birds, with chicken appearing to be evolving toward lower GC3* values, whereas the zebra finch is evolving toward higher GC3* values (fig. 4). The zebra finch likely possesses a larger effective population size than chicken (Ne of ∼1.3–7 million; Balakrishnan and Edwards 2009), perhaps enabling more efficient gBGC and hence increasing GC3* values. We also predict that early amniote, mammal, and sauropsid ancestors possessed much higher GC3 (and presumably overall GC) values than most extant amniote species. Because of the presumed lack of strong isochores in amphibians and many fish, it is often assumed that isochores in amniotes originated in an early amniote ancestor rather than in a more remote vertebrate ancestor (Duret et al. 2006). Furthermore, given the similar structures between human and chicken (supplementary fig. 2, Supplementary Material online), the ancestral amniote is likely to have possessed isochore structures similar to those currently seen for mammals and birds. If this is the case, then there will have been a substantial erosion of GC-rich isochores in Anolis at some period since the sauropsid ancestor, involving a greater decline in these isochores than seen for any other amniote whose genome has been sequenced to date. Although ancestral state reconstructions of GC are subject to error and would be improved with greater taxon sampling, our results clearly demonstrate divergence of isochore structure in Anolis.
Intron and intergenic lengths negatively correlate with GC content in mammals and birds (Lander et al. 2001; ICGSC 2004), though this pattern is weak for Anolis (fig. 6). One hypothesis to explain the negative correlation between GC content and intron length proposes that longer introns increase the probability of recombination between nonneutral mutations in genomic regions where the recombination rate is low (and therefore GC content is low), ultimately decreasing Hill–Robertson interference (Comeron and Kreitman 2000). If recombination influences noncoding DNA length, perhaps by reducing Hill–Robertson interference, then a uniform recombination rate (using GC content as a proxy) can be expected to produce more uniform noncoding DNA lengths. Although we failed to find statistical evidence of a relatively homogeneous recombination rate in Anolis using distributions of dN/dS between low-GC and high-GC genes, we predict that recombination rate in Anolis has been more homogeneous than in human and chicken (table 2). Regardless of the mechanisms that maintain the negative correlation between GC content and noncoding DNA length in mammals and birds, they are likely absent from Anolis, implying that the erosion of GC heterogeneity has important consequences on genomic processes and structural features.
The Reduction of GC-Rich Isochores in Anolis May Involve Complex Interactions of Multiple Processes
The tempo and mode of the isochore landscape are dynamic yet influenced by several evolutionary, genetic, and population processes, including mutation rate, recombination, and population size (Eyre-Walker and Hurst 2001; Duret et al. 2006). One hypothesis for isochore evolution, the thermal stability hypothesis, posits that endothermic vertebrates have GC-rich isochores because high-GC content thermally stabilizes expressed regions of the genome found in open chromatin as opposed to the AT-rich regions found in closed chromatin (Bernardi and Bernardi 1986; Bernardi 2007). Criticisms of the thermostability hypothesis rest on its treatment of point mutations as independent events; it is unlikely that a single point mutation, in a tract on the order of hundreds of kilobases, can confer significant selective advantage between two individuals (Duret and Galtier 2009). In addition, it is important to note that there appears to be no correlation between genic GC content and body temperature among vertebrates (Belle et al. 2002; Ream et al. 2003). Still, it is intriguing that the first ectothermic amniote genome to be sequenced exhibits a diminution of isochores, as the thermal stability hypothesis might predict.
There is increasing evidence for nonadaptive forces, notably gBGC, driving isochore evolution (Duret and Galtier 2009). gBGC occurs during recombination when repair mechanisms preferentially convert AT alleles to GC alleles at heteroduplex sites formed during crossing over (Birdsell 2002; Mancera et al. 2008; Duret and Galtier 2009). Theoretical, empirical, and experimental evidence have accumulated to support a GC-retention bias during gene conversion (Brown and Jiricny 1987; Eyre-Walker and Hurst 2001; Duret et al. 2006; Duret and Galtier 2009). The bias in this repair mechanism mimics selection, and as such, the influence of gBGC on genome evolution is more efficient when effective population sizes are large. For example, our finding of divergent isochore evolution in birds probably reflects such a process.
The machinery for biased gene conversion likely exists in lizards, as indicated by gene-level biased gene conversion of ribosomal tandem arrays in the gecko Heteronotia binoei (Hillis et al. 1991). One explanation for the compositional homogeneity of the Anolis genome is that the GC bias in gBGC has been reduced in its lineage or even reversed. Eyre-Walker (1999) argued gBGC will have little effect on base composition if New << 1, where w is the strength of the bias. Alternatively, Ne of Anolis may be small. Moderate levels of genetic diversity exist within A. carolinensis (mitochondrial protein-coding pairwise divergence = 0.048) (Glor et al. 2005), implying that Ne is not small, and that either the strength of w is the critical influence of GC composition evolution in Anolis or the erosion of GC composition occurred at deeper timescales and the maintenance of homogeneity has continued. Further genomic sampling of nonavian reptiles and other amniotes should help clarify the causes of GC homogeneity in Anolis.
Supplementary Material
Supplementary tables 1–5 and figures 1 and 2 are available at Genome Biology and Evolution online (http://www.gbe.oxfordjournals.org/).
Acknowledgments
We thank members of the Ponting and Edwards labs for valuable discussion and input. Paul Fearnhead kindly provided R scripts to implement the FV2009 method as well as guidance on using the code and interpreting the results. Lesheng Kong provided access to the orthologous gene set and evolutionary rates. We also thank Jessica Alföldi, Federica Di Palma, Kerstin Lindblad-Toh, and other members of the Anolis genome sequencing consortium for valuable discussions. Two anonymous reviewers provided valuable feedback that greatly enhanced our manuscript. This work was supported by a National Science Foundation Biological Informatics Postdoctoral Fellowship to M.K.F. (DBI-0905714) and by the UK Medical Research Council (C.P.P.).
References
- Alföldi et al. 2011. The genome of the green anole lizard and a comparative analysis with birds and mammals. Nature doi:10.1038/nature10390. [DOI] [PMC free article] [PubMed]
- Balakrishnan CN, Edwards SV. Nucleotide variation, linkage disequilibrium and founder-facilitated speciation in wild populations of the zebra finch (Taeniopygia guttata) Genetics. 2009;181:645–660. doi: 10.1534/genetics.108.094250. [DOI] [PMC free article] [PubMed] [Google Scholar]
- Belle EM, Duret L, Galtier N, Eyre-Walker A. The decline of isochores in mammals: an assessment of the GC content variation along the mammalian phylogeny. J Mol Evol. 2004;58:653–660. doi: 10.1007/s00239-004-2587-x. [DOI] [PubMed] [Google Scholar]
- Belle EM, Smith N, Eyre-Walker A. Analysis of the phylogenetic distribution of isochores in vertebrates and a test of the thermal stability hypothesis. J Mol Evol. 2002;55:356–363. doi: 10.1007/s00239-002-2333-1. [DOI] [PubMed] [Google Scholar]
- Bernardi G. Isochores and the evolutionary genomics of vertebrates. Gene. 2000;241:3–17. doi: 10.1016/s0378-1119(99)00485-0. [DOI] [PubMed] [Google Scholar]
- Bernardi G. Misunderstandings about isochores. Part 1. Gene. 2001;276:3–13. doi: 10.1016/s0378-1119(01)00644-8. [DOI] [PubMed] [Google Scholar]
- Bernardi G. The neoselectionist theory of genome evolution. Proc Natl Acad Sci U S A. 2007;104:8385–8390. doi: 10.1073/pnas.0701652104. [DOI] [PMC free article] [PubMed] [Google Scholar]
- Bernardi G, Bernardi G. Compositional constraints and genome evolution. J Mol Evol. 1986;24:1–11. doi: 10.1007/BF02099946. [DOI] [PubMed] [Google Scholar]
- Birdsell JA. Integrating genomics, bioinformatics, and classical genetics to study the effects of recombination on genome evolution. Mol Biol Evol. 2002;19:1181–1197. doi: 10.1093/oxfordjournals.molbev.a004176. [DOI] [PubMed] [Google Scholar]
- Brown TC, Jiricny J. A specific mismatch repair event protects mammalian cells from loss of 5-methylcytosine. Cell. 1987;50:945–950. doi: 10.1016/0092-8674(87)90521-6. [DOI] [PubMed] [Google Scholar]
- Chojnowski J, Braun E. Turtle isochore structure is intermediate between amphibians and other amniotes. Integr Comp Biol. 2008;48:454–462. doi: 10.1093/icb/icn062. [DOI] [PubMed] [Google Scholar]
- Chojnowski JL, et al. Patterns of vertebrate isochore evolution revealed by comparison of expressed mammalian, avian, and crocodilian genes. J Mol Evol. 2007;65:259–266. doi: 10.1007/s00239-007-9003-2. [DOI] [PubMed] [Google Scholar]
- Clay OK, Bernardi G. GC3 of genes can be used as a proxy for isochore base composition: a reply to Elhaik et al. Mol Biol Evol. 2011;28:21–23. doi: 10.1093/molbev/msq222. [DOI] [PubMed] [Google Scholar]
- Cohen N, Dagan T, Stone L, Graur D. GC composition of the human genome: in search of isochores. Mol Biol Evol. 2005;22:1260–1272. doi: 10.1093/molbev/msi115. [DOI] [PubMed] [Google Scholar]
- Comeron J, Kreitman M. The correlation between intron length and recombination in Drosophila. Dynamic equilibrium between mutational and selective forces. Genetics. 2000;156:1175–1190. doi: 10.1093/genetics/156.3.1175. [DOI] [PMC free article] [PubMed] [Google Scholar]
- Comeron J, Williford A, Kliman R. The Hill-Robertson effect: evolutionary consequences of weak selection and linkage in finite populations. Heredity. 2008;100:19–31. doi: 10.1038/sj.hdy.6801059. [DOI] [PubMed] [Google Scholar]
- Costantini M, Bernardi G. Replication timing, chromosomal bands, and isochores. Proc Natl Acad Sci U S A. 2008;105:3433–3437. doi: 10.1073/pnas.0710587105. [DOI] [PMC free article] [PubMed] [Google Scholar]
- Costantini M, Cammarano R, Bernardi G. The evolution of isochore patterns in vertebrate genomes. BMC Genomics. 2009;10:146. doi: 10.1186/1471-2164-10-146. [DOI] [PMC free article] [PubMed] [Google Scholar]
- Costantini M, Clay O, Auletta F, Bernardi G. An isochore map of human chromosomes. Genome Res. 2006;16:536–541. doi: 10.1101/gr.4910606. [DOI] [PMC free article] [PubMed] [Google Scholar]
- Cuny G, Soriano P, Macaya G, Bernardi G. The major components of the mouse and human genomes. 1. Preparation, basic properties and compositional heterogeneity. Eur J Biochem. 1981;115:227–233. doi: 10.1111/j.1432-1033.1981.tb05227.x. [DOI] [PubMed] [Google Scholar]
- D’Onofrio G. Expression patterns and gene distribution in the human genome. Gene. 2002;300:155–160. doi: 10.1016/s0378-1119(02)01048-x. [DOI] [PubMed] [Google Scholar]
- Duret L, Eyre-Walker A, Galtier N. A new perspective on isochore evolution. Gene. 2006;385:71–74. doi: 10.1016/j.gene.2006.04.030. [DOI] [PubMed] [Google Scholar]
- Duret L, Galtier N. Biased gene conversion and the evolution of mammalian genomic landscapes. Annu Rev Genomics Hum Genet. 2009;10:285–311. doi: 10.1146/annurev-genom-082908-150001. [DOI] [PubMed] [Google Scholar]
- Duret L, Mouchiroud D, Gautier C. Statistical analysis of vertebrate sequences reveals that long genes are scarce in GC-rich isochores. J Mol Evol. 1995;40:308–317. doi: 10.1007/BF00163235. [DOI] [PubMed] [Google Scholar]
- Duret L, Semon M, Piganeau G, Mouchiroud D, Galtier N. Vanishing GC-rich isochores in mammalian genomes. Genetics. 2002;162:1837–1847. doi: 10.1093/genetics/162.4.1837. [DOI] [PMC free article] [PubMed] [Google Scholar]
- Elhaik E, Landan G, Graur D. Can GC content at third-codon positions be used as a proxy for isochore composition? Mol Biol Evol. 2009;26:1829–1833. doi: 10.1093/molbev/msp100. [DOI] [PubMed] [Google Scholar]
- Ellegren H. Molecular evolutionary genomics of birds. Cytogenet Genome Res. 2007;117:120–130. doi: 10.1159/000103172. [DOI] [PubMed] [Google Scholar]
- Eyre-Walker A. Evidence of selection on silent site base composition in mammals: potential implications for the evolution of isochores and junk DNA. Genetics. 1999;152:675–683. doi: 10.1093/genetics/152.2.675. [DOI] [PMC free article] [PubMed] [Google Scholar]
- Eyre-Walker A, Hurst LD. The evolution of isochores. Nat Rev Genet. 2001;2:549–555. doi: 10.1038/35080577. [DOI] [PubMed] [Google Scholar]
- Fearnhead P, Vasileiou D. Bayesian analysis of isochores. J Am Stat Assoc. 2009;104:132–141. [Google Scholar]
- Fortes G, Bouza C, Martínez P, Sánchez L. Diversity in isochore structure among cold-blooded vertebrates based on GC content of coding and non-coding sequences. Genetica. 2007;129:281–289. doi: 10.1007/s10709-006-0009-2. [DOI] [PubMed] [Google Scholar]
- Fullerton SM, Bernardo Carvalho A, Clark AG. Local rates of recombination are positively correlated with GC content in the human genome. Mol Biol Evol. 2001;18:1139–1142. doi: 10.1093/oxfordjournals.molbev.a003886. [DOI] [PubMed] [Google Scholar]
- Galtier N, Gouy M. Inferring pattern and process: maximum-likelihood implementation of a nonhomogeneous model of DNA sequence evolution for phylogenetic analysis. Mol Biol Evol. 1998;15:871–879. doi: 10.1093/oxfordjournals.molbev.a025991. [DOI] [PubMed] [Google Scholar]
- Glor RE, Losos JB, Larson A. Out of cuba: overwater dispersal and speciation among lizards in the Anolis carolinensis subgroup. Mol Ecol. 2005;14:2419–2432. doi: 10.1111/j.1365-294X.2005.02550.x. [DOI] [PubMed] [Google Scholar]
- Goldman N, Yang Z. A codon-based model of nucleotide substitution for protein-coding DNA sequences. Mol Biol Evol. 1994;11:725–736. doi: 10.1093/oxfordjournals.molbev.a040153. [DOI] [PubMed] [Google Scholar]
- Hardison RC, et al. Covariation in frequencies of substitution, deletion, transposition, and recombination during eutherian evolution. Genome Res. 2003;13:13–26. doi: 10.1101/gr.844103. [DOI] [PMC free article] [PubMed] [Google Scholar]
- Heger A, Ponting C. OPTIC: orthologous and paralogous transcripts in clades. Nucleic Acids Res. 2007a;36:D267–D270. doi: 10.1093/nar/gkm852. [DOI] [PMC free article] [PubMed] [Google Scholar]
- Heger A, Ponting CP. Evolutionary rate analyses of orthologs and paralogs from 12 Drosophila genomes. Genome Res. 2007b;17:1837–1849. doi: 10.1101/gr.6249707. [DOI] [PMC free article] [PubMed] [Google Scholar]
- Hill WG, Robertson A. The effect of linkage on limits to artificial selection. Genet Res. 1966;89:311–336. doi: 10.1017/S001667230800949X. [DOI] [PubMed] [Google Scholar]
- Hillis DM, Moritz C, Porter CA, Baker RJ. Evidence for biased gene conversion in concerted evolution of ribosomal DNA. Science. 1991;251:308–310. doi: 10.1126/science.1987647. [DOI] [PubMed] [Google Scholar]
- Hughes S, Clay O, Bernardi G. Compositional patterns in reptilian genomes. Gene. 2002;295:323–329. doi: 10.1016/s0378-1119(02)00732-1. [DOI] [PubMed] [Google Scholar]
- Hughes S, Zelus D, Mouchiroud D. Warm-blooded isochore structure in Nile crocodile and turtle. Mol Biol Evol. 1999;16:1521–1527. doi: 10.1093/oxfordjournals.molbev.a026064. [DOI] [PubMed] [Google Scholar]
- International Chicken Genome Sequencing Consortium (ICGSC) Sequence and comparative analysis of the chicken genome provide unique perspectives on vertebrate evolution. Nature. 2004;432:695–716. doi: 10.1038/nature03154. [DOI] [PubMed] [Google Scholar]
- Janes DE, Organ CL, Fujita MK, Shedlock AM, Edwards SV. Genome evolution in Reptilia, the sister group of mammals. Annu Rev Genomics Hum Genet. 2010;11:239–264. doi: 10.1146/annurev-genom-082509-141646. [DOI] [PubMed] [Google Scholar]
- Janes DE, Organ CL, Valenzuela N. New resources inform study of genome size, content, and organization in nonavian reptiles. Integr Comp Biol. 2008;48:447–453. doi: 10.1093/icb/icn010. [DOI] [PMC free article] [PubMed] [Google Scholar]
- Lander ES, et al. Initial sequencing and analysis of the human genome. Nature. 2001;409:860–921. doi: 10.1038/35057062. [DOI] [PubMed] [Google Scholar]
- Li W, Bernaola-Galván P, Carpena P, Oliver JL. Isochores merit the prefix ‘iso’. Comput Biol Chem. 2003;27:5–10. doi: 10.1016/s1476-9271(02)00090-7. [DOI] [PubMed] [Google Scholar]
- Madsen O. Mammals (Mammalia) In: Hedges SB, Kumar S, editors. The timetree of life. Oxford: Oxford University Press; 2009. pp. 459–461. [Google Scholar]
- Mancera E, Bourgon R, Brozzi A, Huber W, Steinmetz L. High-resolution mapping of meiotic crossovers and non-crossovers in yeast. Nature. 2008;454:479–485. doi: 10.1038/nature07135. [DOI] [PMC free article] [PubMed] [Google Scholar]
- Meunier J, Duret L. Recombination drives the evolution of GC-content in the human genome. Mol Biol Evol. 2004;21:984–990. doi: 10.1093/molbev/msh070. [DOI] [PubMed] [Google Scholar]
- Montoya-Burgos JI, Boursot P, Galtier N. Recombination explains isochores in mammalian genomes. Trends Genet. 2003;19:128–130. doi: 10.1016/S0168-9525(03)00021-0. [DOI] [PubMed] [Google Scholar]
- Mouchiroud D, et al. The distribution of genes in the human genome. Gene. 1991;100:181–187. doi: 10.1016/0378-1119(91)90364-h. [DOI] [PubMed] [Google Scholar]
- Olmo E. Evolution of genome size and DNA base composition in reptiles. Genetica. 1981;57:39–50. [Google Scholar]
- Olmo E. Reptilia. In: John B, Bauer H, Kayano H, Levan A, editors. Animal cytogenetics. Berlin (Germany): Gebrüder Borntrager; 1984. pp. 1–100. [Google Scholar]
- Peterson DG, Stack SM, Healy JL, Donohoe BS, Anderson LK. The relationship between synaptonemal complex length and genome size in four vertebrate classes (Osteicthyes, Reptilia, Aves, Mammalia) Chromosome Res. 1994;2:153–162. doi: 10.1007/BF01553494. [DOI] [PubMed] [Google Scholar]
- Ream RA, Johns GC, Somero GN. Base compositions of genes encoding alpha-actin and lactate dehydrogenase-a from differently adapted vertebrates show no temperature-adaptive variation in G + C content. Mol Biol Evol. 2003;20:105–110. doi: 10.1093/molbev/msg008. [DOI] [PubMed] [Google Scholar]
- Romiguier J, Ranwez V, Douzery EJ, Galtier N. Contrasting GC-content dynamics across 33 mammalian genomes: relationship with life-history traits and chromosome sizes. Genome Res. 2010;20:1001–1009. doi: 10.1101/gr.104372.109. [DOI] [PMC free article] [PubMed] [Google Scholar]
- Shedlock A, Edwards SV. Amniotes (Amniota) In: Hedges SB, Kumar S, editors. The timetree of life. Oxford: Oxford University Press; 2009. pp. 375–379. [Google Scholar]
- Watanabe Y, et al. Chromosome-wide assessment of replication timing for human chromosomes 11q and 21q: disease-related genes in timing-switch regions. Hum Mol Genet. 2002;11:13–21. doi: 10.1093/hmg/11.1.13. [DOI] [PubMed] [Google Scholar]
- Yang Z. PAML 4: phylogenetic analysis by maximum likelihood. Mol Biol Evol. 2007;24:1586–1591. doi: 10.1093/molbev/msm088. [DOI] [PubMed] [Google Scholar]