Abstract
A number of point mutations in γD-crystallin are associated with human cataract. The Pro23Thr (P23T) mutation is perhaps the most common, geographically-widespread, and presents itself in a variety of phenotypes. It is therefore important to understand the molecular basis of lens opacity due to this mutation. In our earlier studies we noted that P23T shows retrograde and sharply lowered solubility, possibly due to the emergence of hydrophobic patches involved in protein aggregation. Binding of Bis-ANS dye, a commonly used probe of surfacehydrophobicity, competed with aggregation, suggesting that the residues involved in Bis-ANS binding are also involved in protein aggregation. Here, using NMR spectroscopy in conjunction with Bis-ANS binding, we identify three residues, Y16, D21 and Y50 in P23T, involved in binding the dye. Furthermore, using 15N NMR-relaxation experiments, we show that in the mutant protein, backbone fluctuations are restricted in picosecond to nanosecond and microsecond time-scales, relative to the wild type. Our present studies identify the residues involved in these two pivotal characteristics of the mutant protein, namely increased surface hydrophobicity and restricted mobility of the protein backbone, which can explain the nucleation and further propagation of protein aggregates. Thus we have now identified the residues in the P23T mutant that give rise to novel hydrophobic surfaces, as well as those regions of the protein backbone where fluctuations in different time-scales are restricted, providing a comprehensive understanding of how lens opacity could result from this mutation.
Keywords: Bis-ANS, NMR, order parameter, aggregation, solubility
Introduction
Cataract is still a leading cause of blindness worldwide, and treatment of age-onset cataract is major health-care expenditure. Surgical treatment of congenital and childhood cataract is not desirable, as it often leads to other ocular complications1. Thus, it is important to understand the molecular basis of cataract formation that would enable the development of nonsurgical intervention methods.
Primary genetic cataracts that are associated with a known mutation in a lens protein provide a convenient experimental system to derive plausible molecular mechanisms for cataract formation. Since age-onset cataracts appear to have a genetic component as well2, such mechanisms could have wider applicability. With this aim, we have investigated several distinct mutant proteins of γD-crystallin, all associated with human cataracts3,4,5. Some crystallin mutations appear to be geographically widespread, and consequently have received much more attention: an example of that is the P23T mutation in HGD.
Using thermodynamic and spectroscopic studies of the P23T mutant, we have shown earlier5 that a dramatic lowering in the solubility of the protein is observed even as the secondary and tertiary structures remain largely intact relative to the wild type. Our key observation however, was that the mutant showed retrograde solubility unlike the normal protein. Recently, we extended those studies and showed6 that the retrograde solubility could be explained on the basis of changes on the protein-surface in the form of hydrophobic surface patches indicated by enhanced binding of the hydrophobicity probe Bis-ANS (4,4'-dianilino-1,1'-binaphthyl-5,5'-disulfonate). Furthermore, the data suggest that the Bis-ANS binding site may also be the site involved in the aggregation of P23T6.
Jung et al.7 have determined the 3D structures of the P23T mutant using NMR spectroscopy. Based on NMR dynamics data, they concluded that it is the altered conformation and restricted mobility of the residues neighboring the mutation site, which may be responsible for initiating aggregation. However, these data raise two concerns: 1. The data were obtained primarily with the mutant protein containing an N-terminal His-tag, which makes the protein highly soluble. While the increased solubility is of great advantage for NMR measurements, it appears an incongruous choice when the aim is to determine the structural basis for the compromised solubility of the mutant protein. 2. Even as their observations of the local change in R2 (transverse relaxation rate) between the normal and mutant protein are intriguing, the observed change is limited to 2–3 contiguous residues on the entire protein surface, which would be insufficient to account for the difference in solubility. Since R2 data only provide a limited window into the diverse dynamics of proteins8, we wanted to examine the dynamics in more detail using untagged proteins.
Here we present NMR dynamics data at two frequencies (500 and 700 MHz) for the amide backbone in HGD and P23T, containing no extraneous molecular tags. We also map the Bis-ANS binding site on P23T. The data are in agreement with our previous work showing the emergence of hydrophobic surface patches in the P23T mutant, and also reveal lowered fluctuations of the protein backbone in picosecond to nanosecond and microsecond time-scales. Together, these two attributes would not only lead to the formation of ideal nucleation sites for the formation of protein aggregates, but also to creating interfaces for the growth of aggregates. The data also identify amino acid residues on the P23T monomer that are likely to be involved in aggregation, and hence responsible for the dramatically altered solubility of P23T.
Results
Longitudinal (R1) and Transverse (R2) relaxation rates of HGD and P23T
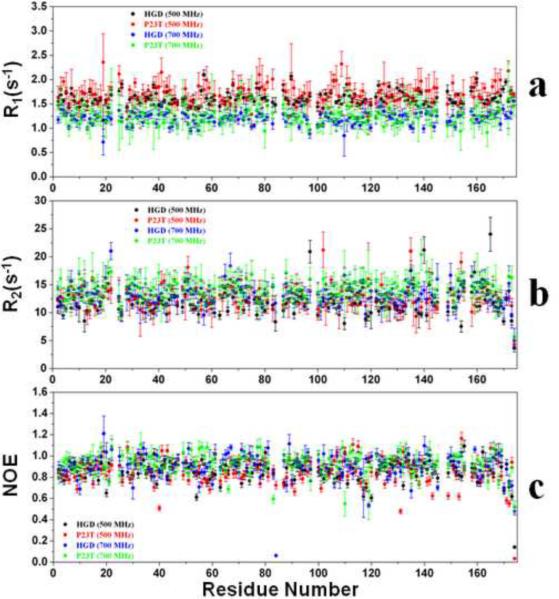
To determine the effect of Pro23 to Thr (P23T) mutation on the backbone dynamics of HGD on the picosecond to nanosecond timescale, we have used heteronuclear NMR spectroscopy to measure longitudinal (R1) and transverse (R2) relaxation rates for uniformly labeled [U- 15N]-HGD and [U- 15N]-P23T mutant. The data are plotted as a function of residue number and are shown in Fig. 1. The average R1 values for HGD are 1.20±0.10 s−1 and 1.61±0.09 s−1 (700 and 500 MHz respectively) and for P23T are 1.25±0.22 s−1 and 1.70±0.22 s−1 (700 and 500 MHz respectively). We note that there are several residues in P23T showing higher values of R1 than HGD (namely, H22, G60, G70, L71, V75, L133, E135, and D172), while only 3 residues in P23T have lower values compared to HGD (namely, L80, Y154 and V164). We also note that S19 and S110 in HGD, for which P23T data are not available, have lower R1 values than the average in HGD. However, the errors associated with most of these residues are higher than the average error in R1 for HGD. Besides these residues, there are other residues for which only minor differences are observed in per-residue R1 values for HGD and P23T (Fig. 1a). Thus, we conclude that the average R1 values of HGD and P23T as well as the per-residue values are comparable within the error limit. We also note that our R1 data compares well with that for His-tagged P23T published by Jung et al.7.
Fig. 1.
15N Relaxation parameters. (a) Backbone 15N longitudinal relaxation rates (R1) for HGD (black), P23T (red) at 500 MHz at pH 7.0, HGD (blue) and P23T (green) at 700 MHz at pH 7.0. (b) Backbone 15N transverse relaxation rates (R2) for HGD (black), P23T (red) at 500 MHz at pH 7.0, HGD (blue) and P23T (green) at 700 MHz at pH 7.0. (c) 1H-15N heteronuclear nOe values for HGD (black), P23T (red) at 500 MHz at pH 7.0, HGD (blue) and P23T (green) at 700 MHz at pH 7.0. Data were collected 25°C.
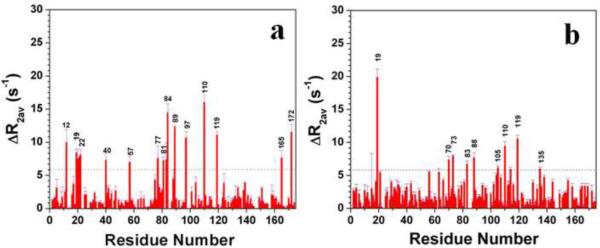
The average value of the transverse relaxation rates (R2, Fig. 1b), for HGD are 13.70±1.9 s−1 and 12.05±0.99 s−1 (700 and 500 MHz respectively), and for P23T are 14.19±2.1 s−1 and 12.77±2.2 s−1 (700 and 500 MHz respectively). The data, plotted as a function of residue number and shown in Fig. 1b, show that some residues in P23T have elevated values of R2 than HGD, namely, G40, L57, D97, F118, Y139 and F173, while S20, H22 and Q67 show lower R2 values than HGD. However, among these residues, we note that D97 has lower R2 value for P23T compared to HGD in 500 MHz while G40, L57 and Y139 do not have significant differences in R2 values between HGD and P23T at 500 MHz. Since G40, L57, D97 residues are in the flexible loop regions of the protein, they possibly show conformational exchange motions (μs to ms time-scale) in HGD as observed experimentally in our CPMG data (see Fig. 4a). Hence, the contribution from the slow conformational exchange motion may result in the apparent discrepancy observed for G40, L57 and D97. However, we are unable to account for the observed discrepancy for Y139 since it does not show slow exchange motion in the CPMG data, despite being a part of a flexible loop. We also observe that there are differences between our data and that of Jung et al.7 for P23T. The only difference in R2 between HGD and P23T they observed was significantly elevated values for several residues, such as D21, H22 and N24, around residue 23 in HGD. We observed S20 and H22 in HGD with significantly elevated values which agree with their data. However, the differences in R2 values between P23T and HGD reported here, for the residues which are far from the mutation site, were not observed by Jung et al.7.
Fig. 4.
CPMG data showing the residues which exhibit motion in the μs to ms time scale in HGD (a), and P23T (b). Data were collected at 700 MHz and at 25°C.
15N nOe of HGD and P23T
Steady-state heteronuclear 15N nOe measurements were carried out for both HGD and P23T and the data are shown in Fig. 1c. There are some differences in per-residue nOe values between HGD and P23T (at 700 MHz). To assign these differences accurately, an absolute difference of 0.2 or more was considered statistically significant. S30, Y55, F56, R58, G60, C78, H88, C109, Q113, and W131 show a significant increase in NOE values in P23T, while S19, S51, Q66, H83, S110, N138, A159 and R168 show significant decrease compared to HGD. We note that Jung et al.7, observed that for their His-tagged P23T, the per-residue nOe values were uniformly comparable with that of HGD.
Overall Rotational Diffusion of HGD and P23T
The overall rotational diffusion of HGD and P23T were determined using ROTDIF software program9. ROTDIF uses 15N relaxation data, R1, R2 and NOE, to determine the rotational diffusion tensor of a macromolecule: We used 152 residues for HGD and 148 residues for P23T. The results are given in Table-1 in the supplementary material for three different diffusion tensor models: axially symmetric, isotropic and fully-anisotropic. Generally, a characterization of the overall rotational diffusion tensor requires six parameters: three principal components of the diffusion tensor (Dxx, Dyy, Dzz) and the Euler angles α, β, and γ which describe the orientation of the principal axis frame of the diffusion tensor with respect to the actual molecular frame given by the NH coordinates in the PDB file9. The values corresponding to these six parameters are tabulated in the first six columns in Table-1 (supplementary material). Rotational diffusion is best described based on the F- and P-tests by the axially symmetric model for both HGD (F = 19, P ~ 10−10) and P23T (F = 15, P ~ 10−8 )9. We note that the diffusion tensor components for this model appear to be slightly different for P23T as compared to HGD. The overall rotational correlation time (τc) for HGD was 8.71±0.33 ns (at 700 MHz) and 9.66±0.48 ns (at 500 MHz), for P23T, 8.48±0.36 ns (at 700 MHz) and 9.78±0.52 ns (at 500 MHz), respectively, which implies that the NMR active species are the monomers of P23T. Our data for HGD and P23T compare very well with the rotational correlation time of other proteins: e.g. 4.1 ns for human ubiquitin which is a 76 residue protein10 and 8.57 ns for MUP-I which contains 157 amino acids11; and conforms to the general rule of 0.5 ns overall correlation time per 1 kD of molecular weight.12
Model-free order parameters (S2) for HGD and P23T
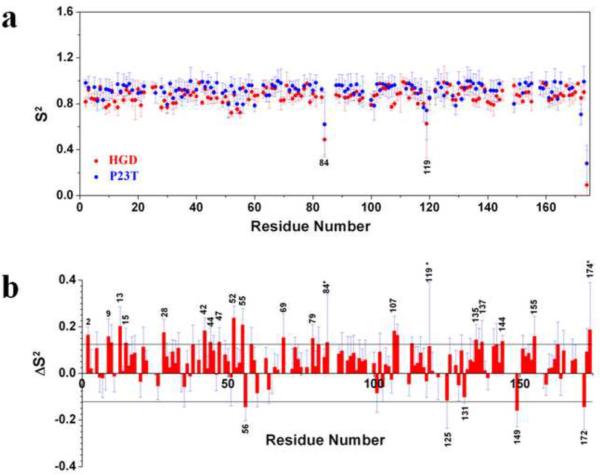
The overall motions of HGD and P23T were assumed to be axially symmetric as indicated by our rotational diffusion tensor analysis. During the order parameter determination, model selection for each residue was done automatically (by the DYNAMICS program13), and independently for HGD and P23T. The order parameter, S2, is plotted in Fig. 2a as a function of residue number. Several residues were excluded, based on the availability of an appropriate model in the DYNAMICS program, in both HGD and P23T during the run. The average value of S2 for 151 residues of HGD was 0.86±0.06 and for 134 residues of P23T was 0.91±0.08. Twenty two and thirty nine residues were excluded for HGD and P23T respectively from the order-parameter determination due to (i) unavailability of complete backbone assignments for both HGD and P23T14 and (ii) a suitable model could not be found for these residues by the program due to either the slow microsecond-millisecond motions or spectral overlap. The differences in the S2 values for 129 residues between HGD and P23T were plotted as a function of residue number and are shown in Fig. 2b. A difference of more than twice the average error in S2 was considered statistically significant. For this reason, the data corresponding to residues 84, 119 and 174 were not considered significant due to large error bars. It is evident from the ΔS2 plot (Fig. 2b), that the overall backbone flexibility is reduced in P23T as observed by the significantly elevated values of the order parameters for several residues, both in the N-terminal and C-terminal domains of the protein, compared to HGD. The residues, which show reduced flexibility in P23T are K2, R9, G10, G13, H15, Y28, W42, L44, Q47, G52, Y55, M69, and R79 in the N-terminal domain and E107, D108, E135, S137, Y144, and Q155 in C-terminal domain. We also note that three residues, F56, G149, and D172, showed greater flexibility in P23T as indicated by a decrease in the order parameter values. Clearly, the residues showing reduced flexibility far outnumber the residues showing higher flexibility in P23T. In conclusion, our order parameter data clearly suggest that the overall backbone flexibility is decreased in human γD-crystallin as a result of the P23T mutation.
Fig. 2.
Model-free order parameter (S2) for P23T and HGD, and the difference in the order parameter between the two proteins (ΔS2). (a) S2 for HGD (red) and P23T (blue), as a function of residue number, at 25°C. (b) Per residue ΔS2 differences between P23T and HGD. ΔS2 are calculated as [data (mutant) - data (wild-type)]. Residues that show a ΔS2 value greater than the cutoff value of 0.125 were considered to be significant. Residues marked with an asterisk (*) are those for which the calculated errors are significantly higher than the average.
Mapping the difference in order parameters (ΔS2) on the structure of HGD
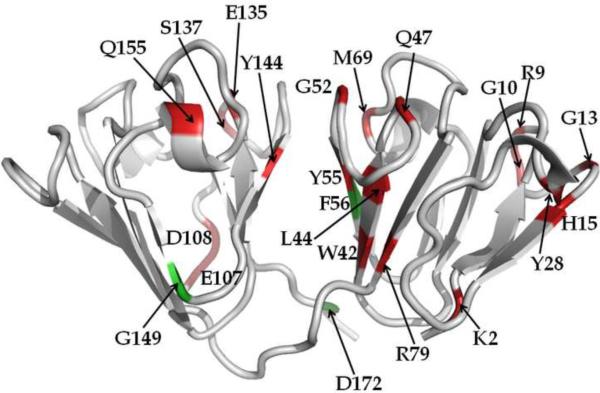
Fig. 3 is a map of ΔS2 on the crystal structure of HGD. The residues for which backbone flexibility has been significantly reduced in P23T are shown in red, while those three residues (F56, G149, and D172) for which the opposite is true are colored green. Several features are noteworthy from Fig. 2b and Fig. 3. (i) The backbone of P23T is more rigid than that of HGD. (ii) Most of the residues that show changes in the order parameter are on the surface of the proteins and are thus solvent exposed. The accessible surface area of each amino acid residue was calculated using the NACCESS program15. 13 residues (namely, K2, R9, G10, G13, H15, Y28, Q47, G52, M69, E107, D108, G149 and Q155) have 39% or more accessible surface area while 4 other residues (namely, R79, E135, S137 and D172) have 22% or more and the accessible surface area of the remaining 5 residues (namely, W42, L44, Y55, F56 and Y144) is 10% or less. (iii) Changes in ΔS2 are not localized in one domain but distributed over the N- and C-terminal domain in the protein structure, though more than 60% changes are in the N-terminal domain. When viewed carefully, one can easily identify that the changes in the N-terminal domain constitute two distinct patches on the surface of the protein. One patch includes K2, R9, G10, G13, H15 and Y28. The other patch includes W42, L44, Q47, G52, Y55, M69 and R79. Interestingly these two patches overlap with the hydrophobic patches already found on the surface of P23T6;14. The changes in ΔS2 when mapped on the C-terminal domain of the protein are found mainly in the loops connecting the β-strands, except for Y144, which is part of a β-strand. We also note that F56 is the only residue in the N-terminal domain which shows an increase in the backbone flexibility along with two other residues in the C-terminal domain, namely, G149 and D172 in P23T.
Fig. 3.
Differences in Model-free order parameters (ΔS2 from Fig. 2b) between HGD and P23T mapped on the crystal structure of HGD. Red represents residues for which backbone flexibility has been significantly reduced and green represents residues for which backbone flexibility has increased in P23T, relative to HGD.
Slow backbone dynamics of HGD and P23T
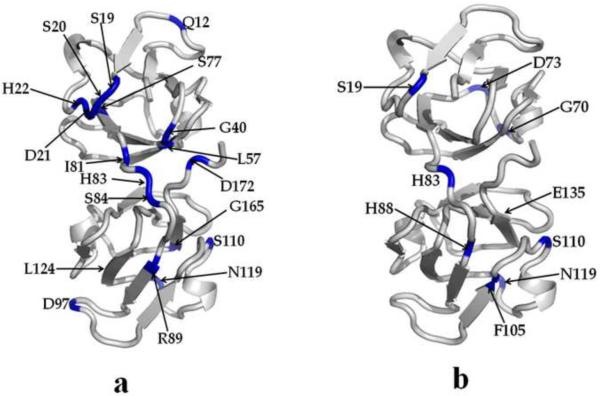
We have also determined the effect of the mutation on the μs to ms time-scale protein backbone dynamics by using relaxation-compensated Carr-Purcell-Meiboom-Gill (CPMG) experiments16. The CPMG data for HGD and P23T are shown in Fig. 4 and the residues are mapped on the structures of HGD and P23T in Fig. 5. In HGD, residues Q12, S19, S20, D21, H22, G40, L57, S77, I81, H83, S84, R89, D97, S110, N119, G165 and D172 show motional behavior on this time scale. In P23T these large-amplitude fluctuations are restricted, except in S19, H83, S110 and N119. However, five other residues in P23T exhibited enhanced mobility, namely G70, D73, H88, F105 and E135. We could not properly determine ΔR2 for D21 in P23T due to spectral overlap, as described in the next section. Altogether then, the overall backbone motional behavior is suppressed in the μs to ms time-scale in P23T. It should be pointed out that the fluctuations we observe in this time-scale for S20, D21 and H22 in HGD – but not in P23T – are in agreement with Jung et al.7, based on their R2 data.
Fig. 5.
Cartoon representations of HGD and P23T highlighting the residues involved in slow dynamics (from Fig. 4). Residues showing slow motion (in μs to ms time scale) are marked with blue in HGD (a) and P23T (b), and are clearly reduced in P23T.
Bis-ANS binding in HGD and P23T
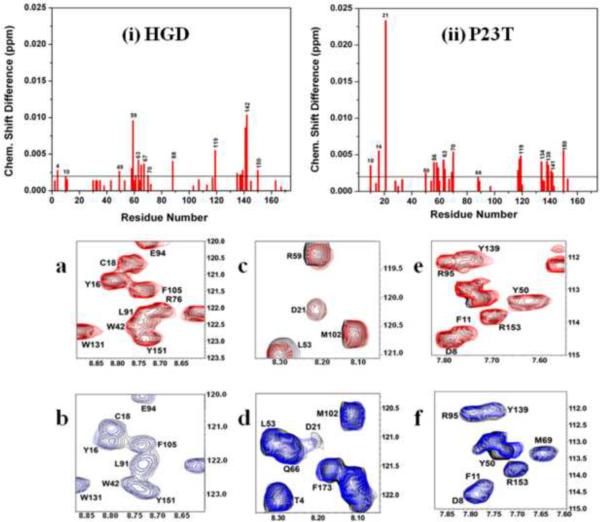
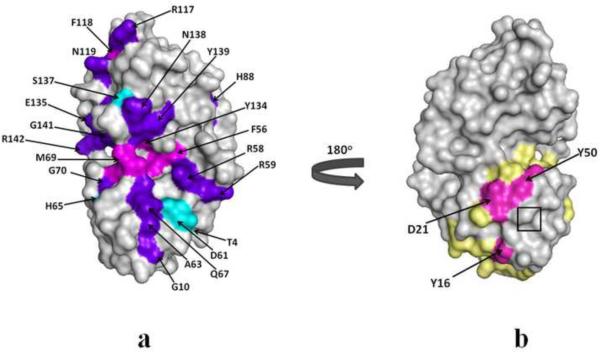
We showed previously, using two probes (Bis-ANS and Nile-red) that the P23T mutation is associated with increased surface hydrophocity in the protein6. To gain further insight into the Bis-ANS binding sites in HGD and P23T, we determined the 1H{15N}-HSQC spectra of the free and Bis-ANS-bound proteins. The HSQC spectrum provides a fingerprint of a protein and protein-ligand and protein-protein interactions-sites can be identified by determining the chemical shift perturbations due to such interactions17. Fig. 6 shows the chemical shift perturbation data for HGD and P23T due to Bis-ANS binding. We found two large clusters of residues, one in the N-terminal and the other in the C-terminal, present in both HGD and P23T, which show appreciable amount of chemical shift perturbations in the presence of Bis-ANS in solution. The N-terminal cluster in P23T includes G10, F56, R58, R59, A63, Q67, M69, and G70 while the C-terminal cluster includes H88, R117, F118, N119, Y134, E135, G141, R142 and D150. These two clusters are essentially identical to those observed in HGD with minor differences. These differences are (see Figs. 6 and 7a) (i) inclusion of the residues T4, D61 and H65 in the N-terminal cluster, and S137 in the C-terminal cluster in HGD and (ii) the exclusion of F56, and M69 from the N-terminal, and F118 and Y134 from the C-terminal cluster in HGD. We do not think that these differences are significant because they do not alter the two large clusters of residues in the N- and C-terminal domains of the protein appreciably.
Fig. 6.
Upper panel: Amide chemical shift perturbations in the HSQC spectrum of HGD and P23T due to Bis-ANS binding. Shown here are average shifts in all the assigned residues in (1) HGD and (ii) P23T as a result of interaction with Bis-ANS. The weighted averages of the 1H and 15N chemical shifts perturbations are calculated as [(Δδ2NH + Δδ2N/25)/2]1/2. For the sake of clarity, all consecutive residues are unlabeled. Lower bottom panel: Overlay of HSQC spectra of free P23T (black contours) and Bis-ANS bound P23T (blue contours) showing interaction of (b) Y16, (d) D21 and (f) Y50 of P23T with Bis-ANS. The corresponding overlay of HSQC spectra of free HGD (lower top panel, black contours) and Bis-ANS bound HGD (red contours) are shown in (a), (c) and (e).
Fig. 7.
Molecular surface representation of HGD and P23T showing chemical shift perturbations as a result of interactions with Bis-ANS. (a) purple-blue indicates common residues showing interactions with Bis-ANS in both the proteins; cyan and magenta represent residues only in HGD and only in P23T, respectively, which interact with Bis-ANS. (b) A distinct surface patch (magenta) containing Y16, D21 and Y50 in P23T. The predicted hydrophobic patches14 (light yellow) are shown for comparison. The mutation site is shown in the boxed region in (b).
In addition however, there are three residues in the N-terminal domain that are quite distinct in P23T, namely Y16, D21 and Y50. The HSQC spectra showing a significant chemical shift perturbation in these three residues due to Bis-ANS–protein interaction in P23T but not in HGD are shown in Fig. 6. We note that the D21 signal has significantly broadened out in P23T in presence and absence of Bis-ANS. However, in Fig. 4b we observe that D21 does not show significant slow conformational exchange motion in P23T. This apparent discrepancy might be a manifestation of spectral overlap which renders the estimation of ΔR2 erroneous for D21 in P23T. When these residues are mapped on the crystal structure of HGD (PDB ID: 1HK0), they lie in close proximity to the mutation site, as shown in the surface maps in Fig. 7. Fig. 7a shows the Bis-ANS interaction sites common for both HGD and P23T. Fig. 7b shows an 180°
anticlockwise rotation of Fig. 7a, revealing the three distinct residues in P23T. Fig. 7b also compares two putative hydrophobic patches on the surface of P23T suggested by our earlier studies6, shown together here in yellow, and the experimentally observed distinct Bis-ANS binding patch in magenta.
A computational model for P23T–Bis-ANS interaction
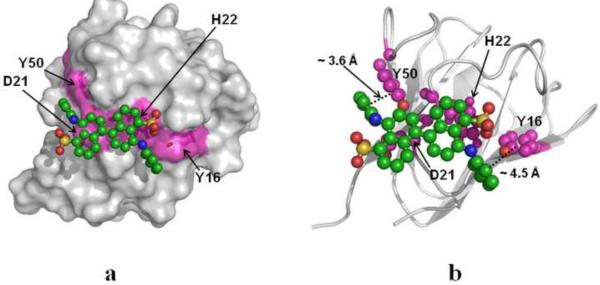
We have modeled the binding interactions of Bis-ANS on the distinct surface hydrophobic patch, consisting of Y16, D21 and Y50, on P23T by using AUTODOCK 4.018. Fig. 8 shows such a model of the P23T–Bis-ANS binding interaction with Fig. 8a and 8b in identical orientation. The aromatic rings of Bis-ANS are found to be preferentially oriented to have pi-stacking interactions with Y50 and Y16. The inter-ring distances are ~ 3.6 Å for the sandwich configuration (this involves Y50) and ~ 4.5 Å for the T-shaped configuration (this involves Y16) as shown in Fig. 8b. These distance values are consistent with two different types of pi-pi interactions19. The best fit configuration yields an estimated binding energy of −5.00 kcal/mol. We also note that there are two other residues in P23T, namely H22 and R79, which are located within 5 Å of the hydrophobic patch of interest. These two residues are also engaged in interactions with the bound Bis-ANS by use of the aliphatic side chain of R79 and side chain imidazole ring of H22. It is interesting to note that the presence of H22 along with Y16, D21 and Y50 makes a contiguous patch for Bis-ANS binding (Fig. 8). Theses interactions may further stabilize the P23T – Bis-ANS complex. It is notable that our earlier HSQC data14, where we had compared the chemical shift differences between the amide backbone of P23T and HGD, showed the maximum difference in E17, H22, and N49. Clearly, the hydrophobic patch made up of these neighboring residues emerges as a major distinction between HGD and P23T.
Fig. 8.
Bis-ANS docking on P23T. (a) Surface representation of P23T, showing Bis-ANS bound to the 4-residue (Y16, D21, H22 and Y50) hydrophobic patch. (b) Backbone cartoon representation of P23T-Bis-ANS complex describing the binding locus. Y16, D21, H22 and Y50 are shown in magenta.
Discussion
In our first report5 on the P23T mutation in human γD-crystallin, we showed that the mutation dramatically lowers the solubility of the protein. A key finding was that the solubility is not only significantly lower relative to the wild type, but that it is retrograde — i.e. the solubility shows an inverse dependence on temperature5. These facts led us to suggest that the protein aggregation that was responsible for the dramatic lowering of protein solubility was mediated by net hydrophobic protein-protein interactions5. Another striking finding was the close similarity in secondary and tertiary structure and stability between the wild type and mutant proteins despite the remarkable change in solubility.
Subsequent high-resolution solution NMR studies revealed specific, but minor conformational differences between the wild-type and mutant protein7; 14 even as both proteins remained fully folded. On the basis of these results, we hypothesized that although certain surface residues on HGD formed potentially hydrophobic patches, it is the minor local conformational changes accompanying the Pro23 to Thr mutation that rendered these patches sufficiently hydrophobic to engage in aggregation. We provided experimental support for this hypothesis by using two distinct small molecule probes of surface hydrophobicity, and showed a significant increase in hydrophobicity in the P23T mutant relative to HGD6. Moreover, in comparing HGD with P23T, and the related P23S and P23V mutants, we showed that the increase in hydrophobicity correlated with the decrease in solubility of these proteins5; 6. Upon careful analysis of Bis-ANS binding to the P23T mutant, it also became apparent that as protein-aggregation increased, binding of Bis-ANS decreased, suggesting that the Bis-ANS binding sites may be masked in the aggregates. In other words, the Bis-ANS binding sites may in fact reside in the interfaces of the protein aggregates6. This led to our current study of the measurement of the NMR spectra of HGD and P23T in the presence of Bis-ANS to determine its binding sites on the protein surface. We have now shown that residues 16, 21 and 50 in the N-terminal domain constitute the specific Bis-ANS binding locus on the P23T mutant, but not in HGD.
We note that Bis-ANS does bind to other sites on both HGD and P23T. But these sites are either common to both proteins, or very close to each other, as shown in Fig. 7a. Thus essentially, it is the emergence of a new hydrophobic patch on the surface of the mutant protein that allows P23T to engage in net hydrophobic protein-protein interactions.
Two observations stand out from our studies reported here: 1. The ΔS2 values (Figs. 2b, 3, and 7c) which show the suppression of the fast backbone motion in the N-terminal domain of P23T are mapped to almost exactly the same site where hydrophobic patches were predicted by our earlier modeling studies6, and supported here further by the Bis-ANS binding data, and 2. Both the microsecond-millisecond motions, and the fast motions of the protein backbone in P23T, are suppressed compared to those in HGD. From these observations a plausible mechanism for the aggregation of P23T emerges in which both (a) the damped fast motion (i.e. ps-ns time scale) of hydrophobic patches on P23T, as well as (b) the overall restrained dynamics of the backbone in all timescales, facilitate nucleation and support the formation and growth of these aggregates.
We now attempt to put our main observations in the larger context of protein condensation20. The increase in the order parameter, i.e. a decrease in the conformational entropy21 – specifically for those residues in the N-terminal domain which clearly appear to form a hydrophobic patch in P23T – is quite significant in the context of protein condensation. Topology and dynamics of the protein surface are important consideration in protein crystallization, which is perhaps the best understood form of protein condensation. Reducing the entropy of the “floppy” side-chains to promote the crystallization of proteins, as in the Surface Entropy Reduction (or SRE) method, is now the most popular method for crystal-engineering22. While we can only discuss backbone mobility from our data, and not side chain mobility, it is reasonable to infer that a restriction in backbone mobility would have similar consequences, while recognizing that engineering backbone mobility in a protein is more complicated. It is therefore conceivable that, when the backbone mobility of hydrophobic patches on the protein surface is lowered, they are likely to become good nucleation sites and interfaces during condensation to form aggregates, as has been suggested in the case of the condensation of insulin23 and hemoglobin24. Just as in those cases, the release of water from such hydrophobic patches in P23T is likely to provide the necessary gain in entropy and result in ready aggregation. We also observe reduced mobility in the slower timescale (μs-ms) in P23T, mainly in the residues that form loops connecting the β strands, namely Q12, S20-H22, D97, and I81 and S84 in the domain-linker and in the flexible C-terminal tail (D172, Fig. 5). This restrained dynamics in the loops is also likely to promote aggregation.
We should mention here that Jung et al.7, have published a detailed NMR structural investigation of HGD and P23T, as well as the NMR relaxation measurements consisting of R1, R2 and heteronuclear nOe measurements. The major difference they found between HGD and P23T is an increase in the local motion of the protein backbone in HGD corresponding to residues 20 through 25, as observed in their R2 data. This led to their suggestion that the reduced local motion in the P23T mutant could be a significant factor in its aggregation and reduced solubility7. In fact, this intriguing observation prompted us to study the NMR dynamics of HGD and P23T in some detail. As discussed above, our conclusions are distinct from theirs, and our differences with their approach are summarized below.
A major part of the NMR studies reported by Jung et al.7, were carried out using His-tag labeled proteins: a 9-residue N-terminal peptide MKHHHHHHQ was attached to all their protein preparations, namely mutants P23S, P23T and P23V, and wild-type HGD. They report that the His-tag enhanced the solubility of the P23T mutant at least 40-fold, and increased its pI by 1 pH unit7. The increase in solubility enabled Jung et al.7 to use high concentration of proteins for the NMR relaxation measurements — which is clearly an advantage — but in our opinion, it defeats the primary purpose of the work, i.e. to determine whether there are any structural or dynamics changes arising due to the mutation that would explain the lowered solubility. More importantly, the change in pI of the protein by 1 unit raises further concerns about the possibility of altered electrostatic interactions. In contrast, we used lower concentrations of the protein samples to minimize sample aggregation. Data were collected at two different field strengths (500 and 700 MHz), and we have placed less emphasis on individual R1 and R2 data and relied mainly on the generalized order parameter (S2) based on rigorous statistical analysis using R1, R2 and heteronuclear nOes.
Jung et al.7 also report that the mutation of Pro23 in the N-terminal domain does not affect the C-terminal domain at all either in structure (observed as a change in chemical shifts) or dynamics (R2). This is contrary to (i) their own expectations, (ii) our current knowledge that the N- and C-terminal domains interact14; 25, and (iii) our dynamics data reported here. It is interesting that Jung et al.7 could not reconcile their NMR-structure data for HGD with its high-resolution (1.25 Å) crystal structure data20, but find that it instead agrees with the crystal structure of the R58H mutant of HGD (PDB ID: 1H4A, 1.15 Å resolution). A look at the crystal structure of HGD26 reveals that the domain-linker region and the R58 residue are within 10–12 Å of residue G1. Thus, a 9-residue peptide connected to the G1 residue (as in Jung et al.7) could easily extend up to 10–12 Å to create local structural perturbations near the linker peptide region and/or the R58 residue. It is therefore conceivable that the discrepancy noted above in Jung et al.7, may simply be due to the additional N-terminal nona-peptide attached to their proteins.
Conclusions
Based on the data presented here and a series of reports published earlier5; 6; 14; 27 we have provided a self-consistent and plausible mechanism for the condensation of the P23T mutant of human γD-crystallin. In this report, we present additional evidence for the emergence of new hydrophobic surface patches on the mutant protein and identified the residues involved. These patches, along with an overall reduction in peptide backbone flexibility in P23T as shown here, are likely to give rise to nucleation sites and promote protein aggregation. These characteristics of the P23T mutant are clearly important in understanding the mechanism of lens opacity due to this mutation.
Materials and Methods
Sample Preparation
Cloning, expression, and purification of HGD and P23T5 and preparation of [U- 15N] labeled HGD and P23T14 have already been described as noted. Protein samples of concentration ~ 40–100 μM were prepared in NMR buffer (10 mM KPO4, 100 mM NaCl, 0.02% NaN3, 90% H2O and 10% D2O, pH 7). Low concentrations of P23T were used to avoid protein precipitation of P23T during NMR experiments Amino acid residues are numbered according to the crystal structure (PDB ID: 1HK0) of HGD26.
Relaxation Measurements
NMR data were acquired on Bruker Avance II 700 MHz and Avance III 500 MHz spectrometers equipped with an ultra-sensitive TCI triple resonance cryoprobe capable of applying pulsed field gradients along the Z-axis. All experiments were conducted at 25° C.
Measurements of the spin-lattice (R1) and spin-spin (R2) relaxation rates, as well as the steady state nOe (nuclear Overhauser effect) measurements were performed at both 500 and 700 MHz for HGD and P23T. The pulse sequence used for recording 15N T1, T2 and steady state {15N-1H}- nOe spectra were used as described28 with a modification to include Watergate techniques29 for suppressing the water resonance. Non-saturated and saturated spectra for {15N-1H}- nOe measurements were collected in an interleaved fashion. Heat-compensated pulse sequences were used to acquire spectra for recording T2. Decoupling of 15N spins during acquisition was performed by using a GARP composite pulse sequence with field strength of 1.35 kHz. The observed 1H chemical shifts were determined relative to the internal reference, sodium 2,2-dimethyl-2-silapentane-5-sulfonate (DSS). A recycle delay of 3.0 s was used in the nOe, R1 and R2 relaxation measurements for both HGD and P23T samples. For HGD, the following delays were applied to measure the R2 values at 500 MHz: 20, 30, 50, 60, 80, 100, and 140 ms; at 700 MHz for HGD: 20, 30, 40, 50, 60, 80, and 100 ms. For P23T, at 500 MHz, the following delays were used: 20, 30, 50, 70, 100 and 150 ms; and at 700 MHz for P23T: 20, 30, 50, 70, 100 and 150 ms. For R1 measurements, the following variable relaxation delays were used at 500 MHz, for HGD: 20, 60, 100, 200, 400, 500, 700, 1000, and 2000 ms; at 700 MHz for HGD: 50, 210, 370, 570, 770, 970, 1500 and 2000 ms; at 500 MHz for P23T: 20, 370, 570, 770, 1000, and 1500 ms; and at 700 MHz for P23T: 50, 210, 370, 570, 770, 970 and 1500 ms. R2 measurements utilized a 900 μs delay between sequential 15N pulses in the CPMG pulse train30 for attenuating the 15N signal loss during a R2 relaxation period30. The field strength of the refocusing pulses in the CPMG pulse sequence was 1 kHz.
Heteronuclear steady-state {15N-1H}-nOe were determined from spectra recorded with (nOe) and without saturation of protons, where saturation was achieved by a train of 120° pulses separated by 5 ms for 1 s. The recycle time between the experiments was 5 s. nOe measurements were performed using a total of 256 transients per increment in the indirect 15N dimension. The 15N dimension was zero filled to 256 real data points. Heteronuclear nOes were calculated according to the equation:
| (1) |
in which Isat and Iunsat are the experimental peak intensities measured from spectra recorded with and without proton saturation. The error evaluation in nOe values was done using published procedure31. The influence of dynamics in the ms timescale on the relaxation properties was determined by using the relaxation-compensated CPMG experiment16. Delays between CPMG pulses (τCP) of 1 and 5 ms, the relaxation delay, T, of 40 ms, and recycle delays of 3.0 s were used. The relaxation rates R2av (average between the in-phase and anti-phase relaxation rates) were determined by using the relation,
in which I(τCP) is the intensity of a peak at delay τCP, and I0 is the intensity of the same peak in the reference spectrum. No attempt was made to extract the exact rates from the limited data. Instead, residues that showed a statistically significant difference, ΔR2av > 6 s−1 between the relaxation rates measured using τCP = 1 ms and τCP = 5 ms, were identified as displaying dynamics on the ms timescale. The estimation of the error was done from the standard deviation of the baseline noise and in the individual peak volume as for the nOe data.
Relaxation data analysis
All data were analyzed by using the NMR software program CARA32. The R1 and R2 relaxation rates were determined by fitting the peak intensity I(t) to a single-exponential function given by I(t)=Ioe−Rt, where t is the NMR time delay, using the MATLAB program RELAXFIT13. Hydrodynamic parameters of HGD and P23T were calculated using RotDif9. The overall correlation times, τc, for HGD and P23T were 8.71 ns and 8.48 ns, respectively. Analysis of the micro-dynamic motional parameters by using the Lipari-Szabo formalism was performed using the program DYNAMICS13; 33 and R1, R2 and {15N-1H}-nOe data at 500 and 700 MHz. Errors in the micro-dynamic parameters were obtained from the analytic inverse covariance matrixes of the fits34. This method of error estimation is crucial because it takes into account both the random errors as well as the model selection errors. A surface map was generated using Pymol graphics software35. Accessible surface area was calculated using NACCESS software15.
Bis-ANS Binding Studies
Protein samples of 60 μM – 140 μM were used for Bis-ANS binding studies. A 100X concentrated Bis-ANS stock solution was prepared in NMR buffer. Bis-ANS concentration was determined using extinction coefficients of 16.8 mM–1cm−1 at 385 nm6. NMR spectra of free and Bis-ANS bound HGD and P23T were recorded at 25 °C in a 700 MHz Bruker Avance spectrometer. The data processing and the calculation of weighted average of chemical shift perturbations were carried out using the published procedure14. A surface map was generated using the Pymol graphics software35.
Computational model for the P23T–Bis-ANS interaction
We used the crystal structure of Bis-ANS36, to model its binding with P23T. The AUTODOCK 4.0 program18, which is widely used to model protein-ligand or protein-protein binding, was used for this purpose. We treated P23T as “protein” and Bis-ANS as “ligand”, and set the grid box dimension such that the grid box included the 3-residue patch on the P23T surface, containing Y16, D21 and Y50. The NMR derived P23T structure7 (model # 3) was used for this particular study. All the residues but Y16, D21 and Y50 in P23T were considered as rigid. The “ligand”, Bis-ANS, was considered as fully flexible.
Supplementary Material
Abbreviations
- HGD
wild-type human γD-crystallin protein
- P23T
Pro to Thr mutant of HGD
- Bis-ANS
4,4'-dianilino-1,1'-binaphthyl-5,5'-disulfonate
- CPMG
Carr-Purcell-Meiboom-Gill
- HSQC
Heteronuclear Single Quantum Coherence
- ps-ns
picosecond-nanosecond
- μs-ms
microsecond-millisecond
Footnotes
Publisher's Disclaimer: This is a PDF file of an unedited manuscript that has been accepted for publication. As a service to our customers we are providing this early version of the manuscript. The manuscript will undergo copyediting, typesetting, and review of the resulting proof before it is published in its final citable form. Please note that during the production process errors may be discovered which could affect the content, and all legal disclaimers that apply to the journal pertain.
References
- 1.Zetterstrom C, Lundvall A, Kugelberg M. Cataracts in children. J Cataract Refract Surg. 2005;31:824–40. doi: 10.1016/j.jcrs.2005.01.012. [DOI] [PubMed] [Google Scholar]
- 2.Hammond CJ, Snieder H, Spector TD, Gilbert CE. Genetic and environmental factors in age-related nuclear cataracts in monozygotic and dizygotic twins. N Engl J Med. 2000;342:1786–90. doi: 10.1056/NEJM200006153422404. [DOI] [PubMed] [Google Scholar]
- 3.Pande A, Pande J, Asherie N, Lomakin A, Ogun O, King JA, Lubsen NH, Walton D, Benedek GB. Molecular basis of a progressive juvenile-onset hereditary cataract. Proc Natl Acad Sci U S A. 2000;97:1993–8. doi: 10.1073/pnas.040554397. [DOI] [PMC free article] [PubMed] [Google Scholar]
- 4.Pande A, Pande J, Asherie N, Lomakin A, Ogun O, King J, Benedek GB. Crystal cataracts: human genetic cataract caused by protein crystallization. Proc Natl Acad Sci U S A. 2001;98:6116–20. doi: 10.1073/pnas.101124798. [DOI] [PMC free article] [PubMed] [Google Scholar]
- 5.Pande A, Annunziata O, Asherie N, Ogun O, Benedek GB, Pande J. Decrease in protein solubility and cataract formation caused by the Pro23 to Thr mutation in human gamma D-crystallin. Biochemistry. 2005;44:2491–500. doi: 10.1021/bi0479611. [DOI] [PubMed] [Google Scholar]
- 6.Pande A, Ghosh KS, Banerjee PR, Pande J. Increase in surface hydrophobicity of the cataract-associated P23T mutant of human gammaD-crystallin is responsible for its dramatically lower, retrograde solubility. Biochemistry. 2010;49:6122–9. doi: 10.1021/bi100664s. [DOI] [PMC free article] [PubMed] [Google Scholar]
- 7.Jung J, Byeon IJ, Wang Y, King J, Gronenborn AM. The structure of the cataract-causing P23T mutant of human gammaD-crystallin exhibits distinctive local conformational and dynamic changes. Biochemistry. 2009;48:2597–609. doi: 10.1021/bi802292q. [DOI] [PMC free article] [PubMed] [Google Scholar]
- 8.Mittermaier AK, Kay LE. Observing biological dynamics at atomic resolution using NMR. Trends Biochem Sci. 2009;34:601–11. doi: 10.1016/j.tibs.2009.07.004. [DOI] [PubMed] [Google Scholar]
- 9.Walker O, Varadan R, Fushman D. Efficient and accurate determination of the overall rotational diffusion tensor of a molecule from (15)N relaxation data using computer program ROTDIF. J Magn Reson. 2004;168:336–45. doi: 10.1016/j.jmr.2004.03.019. [DOI] [PubMed] [Google Scholar]
- 10.Schneider DM, Dellwo MJ, Wand AJ. Fast internal main-chain dynamics of human ubiquitin. Biochemistry. 1992;31:3645–52. doi: 10.1021/bi00129a013. [DOI] [PubMed] [Google Scholar]
- 11.Zidek L, Novotny MV, Stone MJ. Increased protein backbone conformational entropy upon hydrophobic ligand binding. Nat Struct Biol. 1999;6:1118–21. doi: 10.1038/70057. [DOI] [PubMed] [Google Scholar]
- 12.Reddy T, Rainey JK. Interpretation of biomolecular NMR spin relaxation parameters. Biochem Cell Biol. 2010;88:131–42. doi: 10.1139/o09-152. [DOI] [PubMed] [Google Scholar]
- 13.Fushman D, Cahill S, Cowburn D. The main-chain dynamics of the dynamin pleckstrin homology (PH) domain in solution: analysis of 15N relaxation with monomer/dimer equilibration. J Mol Biol. 1997;266:173–94. doi: 10.1006/jmbi.1996.0771. [DOI] [PubMed] [Google Scholar]
- 14.Pande A, Zhang J, Banerjee PR, Puttamadappa SS, Shekhtman A, Pande J. NMR study of the cataract-linked P23T mutant of human gammaD-crystallin shows minor changes in hydrophobic patches that reflect its retrograde solubility. Biochem Biophys Res Commun. 2009;382:196–9. doi: 10.1016/j.bbrc.2009.03.007. [DOI] [PMC free article] [PubMed] [Google Scholar]
- 15.Hubbard SJ, Thornton JM. 'NACCESS', Computer Program. Department of Biochemistry and Molecular Biology, University College London; 1993. [Google Scholar]
- 16.Loria JP, Rance M, Palmer AG., 3rd. A TROSY CPMG sequence for characterizing chemical exchange in large proteins. J Biomol NMR. 1999;15:151–5. doi: 10.1023/a:1008355631073. [DOI] [PubMed] [Google Scholar]
- 17.Shuker SB, Hajduk PJ, Meadows RP, Fesik SW. Discovering high-affinity ligands for proteins: SAR by NMR. Science. 1996;274:1531–4. doi: 10.1126/science.274.5292.1531. [DOI] [PubMed] [Google Scholar]
- 18.Morris GM, Goodsell DS, Halliday RS, Huey R, Hart WE, Belew RK, Olson AJ. Automated docking using a Lamarckian genetic algorithm and an empirical binding free energy function. Journal of Computational Chemistry. 1998;19:1639–1662. [Google Scholar]
- 19.Sinnokrot MO, Valeev EF, Sherrill CD. Estimates of the ab initio limit for pi-pi interactions: the benzene dimer. J Am Chem Soc. 2002;124:10887–93. doi: 10.1021/ja025896h. [DOI] [PubMed] [Google Scholar]
- 20.Gunton JD, Shiryayev A, Pagan DL. Protein condensation : kinetic pathways to crystallization and disease. Cambridge University Press; Cambridge; New York: 2007. [Google Scholar]
- 21.Jarymowycz VA, Stone MJ. Fast time scale dynamics of protein backbones: NMR relaxation methods, applications, and functional consequences. Chem Rev. 2006;106:1624–71. doi: 10.1021/cr040421p. [DOI] [PubMed] [Google Scholar]
- 22.Derewenda ZS. Application of protein engineering to enhance crystallizability and improve crystal properties. Acta Crystallogr D Biol Crystallogr. 2010;66:604–15. doi: 10.1107/S090744491000644X. [DOI] [PMC free article] [PubMed] [Google Scholar]
- 23.Bergeron L, Filobelo LF, Galkin O, Vekilov PG. Thermodynamics of the hydrophobicity in crystallization of insulin. Biophys J. 2003;85:3935–42. doi: 10.1016/S0006-3495(03)74807-3. [DOI] [PMC free article] [PubMed] [Google Scholar]
- 24.Vekilov PG, Feeling-Taylor AR, Petsev DN, Galkin O, Nagel RL, Hirsch RE. Intermolecular interactions, nucleation, and thermodynamics of crystallization of hemoglobin C. Biophys J. 2002;83:1147–56. doi: 10.1016/S0006-3495(02)75238-7. [DOI] [PMC free article] [PubMed] [Google Scholar]
- 25.Das P, King JA, Zhou R. beta-Strand interactions at the domain interface critical for the stability of human lens gammaD-crystallin. Protein Sci. 19:131–40. doi: 10.1002/pro.296. [DOI] [PMC free article] [PubMed] [Google Scholar]
- 26.Basak A, Bateman O, Slingsby C, Pande A, Asherie N, Ogun O, Benedek GB, Pande J. High-resolution X-ray crystal structures of human gammaD crystallin (1.25 A) and the R58H mutant (1.15 A) associated with aculeiform cataract. J Mol Biol. 2003;328:1137–47. doi: 10.1016/s0022-2836(03)00375-9. [DOI] [PubMed] [Google Scholar]
- 27.McManus JJ, Lomakin A, Ogun O, Pande A, Basan M, Pande J, Benedek GB. Altered phase diagram due to a single point mutation in human gamma D-crystallin. Proceedings of the National Academy of Sciences of the United States of America. 2007;104:16856–16861. doi: 10.1073/pnas.0707412104. [DOI] [PMC free article] [PubMed] [Google Scholar]
- 28.Farrow NA, Muhandiram R, Singer AU, Pascal SM, Kay CM, Gish G, Shoelson SE, Pawson T, Forman-Kay JD, Kay LE. Backbone dynamics of a free and phosphopeptide-complexed Src homology 2 domain studied by 15N NMR relaxation. Biochemistry. 1994;33:5984–6003. doi: 10.1021/bi00185a040. [DOI] [PubMed] [Google Scholar]
- 29.Piotto M, Saudek V, Sklenar V. Gradient-tailored excitation for single-quantum NMR spectroscopy of aqueous solutions. J Biomol NMR. 1992;2:661–5. doi: 10.1007/BF02192855. [DOI] [PubMed] [Google Scholar]
- 30.Puttamadappa SS, Jagadish K, Shekhtman A, Camarero JA. Backbone dynamics of cyclotide MCoTI-I free and complexed with trypsin. Angew Chem Int Ed Engl. 2010;49:7030–4. doi: 10.1002/anie.201002906. [DOI] [PMC free article] [PubMed] [Google Scholar]
- 31.Nicholson LK, Kay LE, Baldisseri DM, Arango J, Young PE, Bax A, Torchia DA. Dynamics of methyl groups in proteins as studied by proton-detected 13C NMR spectroscopy. Application to the leucine residues of staphylococcal nuclease. Biochemistry. 1992;31:5253–63. doi: 10.1021/bi00138a003. [DOI] [PubMed] [Google Scholar]
- 32.Masse JE, Keller R, Pervushin K. SideLink: automated side-chain assignment of biopolymers from NMR data by relative-hypothesis-prioritization-based simulated logic. J Magn Reson. 2006;181:45–67. doi: 10.1016/j.jmr.2006.03.012. [DOI] [PubMed] [Google Scholar]
- 33.Lipari G, Szabo A. Nuclear magnetic resonance relaxation in nucleic acid fragments: models for internal motion. Biochemistry. 1981;20:6250–6. doi: 10.1021/bi00524a053. [DOI] [PubMed] [Google Scholar]
- 34.Blake-Hall J, Walker O, Fushman D. Characterization of the overall rotational diffusion of a protein from 15N relaxation measurements and hydrodynamic calculations. Methods Mol Biol. 2004;278:139–60. doi: 10.1385/1-59259-809-9:139. [DOI] [PubMed] [Google Scholar]
- 35.DeLano WL. The Pymol Molecular Graphics System. 2008. [Google Scholar]
- 36.Farris FJ, Weber G, Chiang CC, Paul IC. Preparation, crystalline-structure, and spectral properties of fluorescent-probe 4,4'-bis-1-phenylamino-8-naphthalenesulfonate. Journal of the American Chemical Society. 1978;100:4469–4474. [Google Scholar]
Associated Data
This section collects any data citations, data availability statements, or supplementary materials included in this article.


