

Abstract
Normal human aging is accompanied by progressive brain tissue loss and cognitive decline; however, several factors are thought to influence brain aging. We applied tensor‐based morphometry to high‐resolution brain MRI scans to determine whether educational level or physical activity was associated with brain tissue volumes in the elderly, particularly in regions susceptible to age‐related atrophy. We mapped the 3D profile of brain volume differences in 226 healthy elderly subjects (130F/96M; 77.9 ± 3.6 SD years) from the Cardiovascular Health Study‐Cognition Study. Statistical maps revealed the 3D profile of brain regions whose volumes were associated with educational level and physical activity (based on leisure‐time energy expenditure). After controlling for age, sex, and physical activity, higher educational levels were associated with ∼2–3% greater tissue volumes, on average, in the temporal lobe gray matter. After controlling for age, sex, and education, greater physical activity was associated with ∼2–2.5% greater average tissue volumes in the white matter of the corona radiata extending into the parietal‐occipital junction. Body mass index (BMI) was highly correlated with both education and physical activity, so we examined BMI as a contributing factor by including physical activity, education, and BMI in the same model; only BMI effects remained significant. This is one of the largest MRI studies of factors influencing structural brain aging, and BMI may be a key factor explaining the observed relationship between education, physical activity, and brain structure. Independent contributions to brain structure could not be teased apart as all these factors were highly correlated with one another. Hum Brain Mapp, 2010. © 2010 Wiley‐Liss, Inc.
Keywords: physical activity, education, body mass index, brain structure, aging
INTRODUCTION
By 2030, 14% of the world's population will be over age 65, and advancing age is the most important risk factor for late‐onset Alzheimer's disease [Kinsella and He,2009]. Given the personal toll and increasing economic cost of dementia to society, there is a need to identify factors that may protect against neurodegeneration. Here we aimed to determine whether age‐associated brain atrophy is related to education and physical activity in the elderly. Structural and functional magnetic resonance imaging (MRI) reveal subtle brain changes in aging populations, sometimes years before cognitive deficits are detectable [Scahill et al.,2003; Thompson and Apostolova,2007]. We used tensor‐based morphometry (TBM) to provide detailed information on brain structure from volumetric MRI [Hua et al.,2008a] and to examine factors that may statistically diminish the risk for brain atrophy.
Several prior studies examined the impact of educational background on cognitive functioning, often to assess the brain reserve hypothesis [Stern,2002]. The brain reserve hypothesis states that positive lifestyle factors, including educational attainment, may increase brain resilience against neurodegeneration, or its functional consequences. Some studies found that the level of brain atrophy in the elderly was related to educational level [Coffey et al.,1999; Gordon et al.,2008; Staff et al.,2004], but others did not [Christensen et al.,2007; Kidron et al.,1997]. Only one other MRI study has investigated the effects of education on brain structure, after controlling for physical activity [Gordon et al.,2008], and found that higher educational level predicted preserved white matter in inferior frontal areas, in healthy adults.
Physical activity and exercise are inversely related to the level of age‐related brain atrophy [Colcombe et al.,2003; Colcombe et al.,2006; Gordon et al.,2008; Marks et al.,2007] and to cognitive decline [Carro et al.,2001; Lopez et al.,2003a; Neeper et al.,1995; Yaffe et al.,2001]. Physical activity can induce changes in hippocampal structure [Cotman et al.,2007], increases in brain‐derived neurotrophic factor [Neeper et al.,1995], and insulin‐like growth factor [Carro et al.,2001], and increased neurogenesis in the dentate gyrus [van Praag et al.,1999]. Further, higher levels of aerobic fitness have been associated with greater hippocampal volume and better performance on spatial memory tasks [Erickson et al.,2009].
A number of recent neuroimaging studies, including cross‐sectional and interventional approaches, have further supported the positive effects of physical activity on brain structure and function. A cross‐sectional voxel‐based morphometry study found a positive correlation between physical activity levels and larger gray matter volumes, in the prefrontal and cingulate cortex [Floel et al.,2009]. A recent interventional study found that total physical activity was positively associated with memory scores and gray matter volumes in prefrontal and cingulate cortex [Ruscheweyh et al.,2009] in an elderly cohort. In a group of university students, another longitudinal study found a relationship between aerobic exercise training and preservation of insula gray matter and improved mental health [Gondoh et al.,2009].
Prior reports found that education [Gordon et al.,2008] and physical activity [Bugg and Head,2009; Burns et al.,2008; Colcombe et al.,2003; Colcombe et al.,2006; Gordon et al.,2008] were associated with reduced age‐related atrophy. Even so, the effects of BMI were not evaluated in these prior studies of education and physical activity, even though we have shown it to be strongly linked to the level of atrophy in the brain [Raji et al.,2010]. This raises an important question about how much the positive effects of education and physical activity may be equally explainable by obesity, or whether they have an independent effect. In this study, we set out to determine if education and physical activity had detectable effects on the brain, and if so, whether BMI might equally account for them. Our first hypothesis was that higher levels of education and physical activity might be associated with higher brain volumes in regions implicated in past studies of exercise, such as the temporal lobes. Our second hypothesis was that these effects would be attenuated if BMI was also included in the statistical model. We also hypothesized that higher BMI would still be associated with lower regional brain volumes, after controlling for physical activity, education, age, and sex. To explore how all these factors relate to brain structure, we analyzed brain MRI scans from 226 healthy elderly subjects using TBM. We examined how education, physical activity, and BMI were related to regional brain volumes using 3D statistical maps and region‐of‐interest analyses.
METHODS
Subjects
Pittsburgh Cardiovascular Health Study‐Cognition Study
The Cardiovascular Health Study‐Cognition Study (CHS‐CS) was designed to determine the incidence of dementia and mild cognitive impairment (MCI) in a population of subjects identified as normal or MCI in 1998–99 [Lopez et al.,2003b]. In 1998–1999, 456 subjects had complete neurological and neuropsychological examinations and were scanned with 3D volumetric brain MRI [Raji et al.,2009]. Of the 456 available subjects, 226 subjects (77.9 ± 3.6SD years of age; 130F/96M), met the following criteria: (i) MRI scan in 1998–1999, (ii) physical activity and education data available, (iii) body mass index (BMI) measurements, (iv) cognitively normal (95.1 ± 4.3 points on the Modified Mini‐Mental State exam (3MS)), and not classified as MCI or AD in 1998–1999 at the time of the MRI scan [Teng and Chui,1987].
Body Mass Index
All subjects (N = 226) examined in this study had weight (pounds or kilograms) and height (inches or centimeters) measurements taken during a physical exam. All values were converted to weight (pounds) and height (inches) and BMI was computed using the following standard formula: weight (lb) × 703/[height (in)]2, using a constant to account for the unit conversion.
Educational Level
For analysis, subjects were categorized into groups based on the number of years of education they had completed: some high school (<12 years), completed high school (12 years), some college/vocational school (13–17 years), completed college (18 years), and professional school (>18 years) (Table I).
Table I.
Demographic information for the 226 subjects, split by educational level
| <High school | High school | Some college | College | ≥College | Statistic | |
|---|---|---|---|---|---|---|
| Subjects (n) | 20 | 58 | 46 | 49 | 53 | |
| Age (years) | 77.9 ± 3.7 | 77.5 ± 3.39 | 78.0 ± 3.6 | 78.0 ± 3.6 | 78.2 ± 3.8 | F 4,221 = 0.289 |
| P = 0.885 | ||||||
| Sex | 8M; 12F | 15M; 43F | 15M; 41F | 29M; 20F | 29M; 24F | χ2 4 = 21.041 |
| P < 0.001 | ||||||
| ApoE4 carriers | (5/20) 25.0% | (12/54) 22.2% | (9/43) 20.9% | (13/43) 30.2% | (12/51) 23.5% | χ2 4 = 0.737 |
| P = 0.947 | ||||||
| Race: Caucasian/Black | (16/4) 20.0% | (48/10) 17.2% | (41/5) 10.9% | (47/2) 4.1% | (48/5) 9.4% | χ2 4 = 6.186 |
| P = 0.186 | ||||||
| Hypertension | (9/20) 45.0% | (18/59) 30.5% | (15/46) 32.6% | (15/49) 30.6% | (10/53) 18.9% | χ2 4 = 2.976 |
| P = 0.562 | ||||||
| BMI | 28.9 ± 4.5 | 26.9 ± 4.3 | 27.4 ± 3.8 | 25.6 ± 3.6 | 25.5 ± 3.7 | F 4,221 = 4.142 P = 0.0030 |
| 3MS | 91.6 ± 5.7 | 93.4 ± 5.1 | 95.6 ± 3.6 | 96.1 ± 2.9 | 96.8 ± 2.7 | F 4,221 = 36.831 |
| P = <0.001 | ||||||
| WMH burden | 2.25 ± 1.5 | 2.1 ± 1.2 | 2.4 ± 1.5 | 2.6 ± 1.5 | 2.3 ± 1.4 | F 4,221 = 3.146 |
| P = 0.534 | ||||||
| Kcal expended/week | 1091.9 ± 820.9 | 1252.3 ± 1332.6 | 1291.9 ± 1150.9 | 1003.8 ± 1225.3 | 1253.6 ± 1275.3 | F 4,221 = 2.984 |
| P = 0.561 | ||||||
The mean ± s.d. is shown for each measure. ANOVAs, performed on each variable, show whether the mean clinical measure differed significantly across groups. Chi‐squared tests were performed for categorical variables. 3MS scores, white matter hyperintensity values, and kilocalories/week were not normally distributed, so a nonparametric Kruskal‐Wallis one‐way ANOVA was used. ApoE4 carriers refers to the number of subjects carrying at least one epsilon 4 allele of the apolipoprotein E gene, which confers increased risk for late‐onset Alzheimer's disease [Roses et al., 1993]. Levels of white matter hyperintensities (WMH) were based on expert visual grading on a scale of 0 to 9, with no white matter findings classified as grade 0 and the most severe WMH classified as grades 8 and 9 [Longstreth et al., 1996].
Assessment of Physical Activity
Leisure‐time activities over the two weeks prior to the scan were assessed, and estimated in kcal/week, based on the modified Minnesota Leisure‐Time Activities questionnaire [Geffken et al.,2001; Taylor et al.,1978]. Subjects were asked about the frequency and duration of time spent in 15 different leisure‐time activities over the previous two weeks, to estimate the number of kilocalories of energy expended per week. For analysis, energy expenditure measured in kilocalories per week was divided into quintiles (Table II). The binning into quintiles is performed because physical activity tends to be non‐normally distributed, and somewhat skewed, with many subjects at the low end of the range. Binning was also used since transforming the data (e.g., taking the log) did not resolve this distributional issue. We also analyzed the data, categorized into quartiles instead of quintiles. Basal metabolic rate was not included.
Table II.
Demographic information for 226 subjects, split by physical activity level
| Quintile 1 | Quintile 2 | Quintile 3 | Quintile 4 | Quintile 5 | Statistic | |
|---|---|---|---|---|---|---|
| 11.3‐245 kcal/week | 250‐585 kcal/week | 606.5‐1035 kcal/week | 1042.5‐1905 kcal/week | 1920‐6845 kcal/week | ||
| Subjects (n) | 45 | 45 | 46 | 45 | 45 | |
| Age (years) | 78.0 ± 3.5 | 77.4 ± 4.0 | 78.4 ± 3.8 | 78.2 ± 3.8 | 77.5 ± 2.6 | F 4,221 = 0.677; |
| P = 0.608 | ||||||
| Sex | 17M; 28F | 19M; 26F | 17M; 29F | 18M; 28F | 25M; 20F | χ2 4 = 4.345; |
| P = 0.361 | ||||||
| ApoE4 | (11/41) 26.8% | (6/43) 14.0% | (15/42) 35.7% | (8/45) 17.7% | (11/41) 26.8% | χ2 4 = 4.182; |
| P = 0.382 | ||||||
| Race: Caucasian/ Black | (39/6) 13.3% | (36/9) 20.0% | (41/5) 10.9% | (41/5) 11.1% | (44/1) 2.2% | χ2 4 = 7.210; |
| P = 0.125 | ||||||
| Hypertension | (12/45) 26.7% | (17/45) 37.8% | (10/46) 21.7% | (18/45) 40.0% | (11/45) 24.4% | χ2 4 = 5.823; |
| P = 0.213 | ||||||
| BMI | 27.3 ± 4.5 | 27.9 ± 4.2 | 25.3 ± 3.7 | 26.5 ± 4.5 | 25.9 ± 2.8 | F4,221 = 3.137; |
| P = 0.015 | ||||||
| 3MS | 95.1 ± 3.8 | 94.4 ± 5.5 | 95.3 ± 4.5 | 95.2 ± 3.2 | 95.4 ± 4.1 | F 4,221 = 1.630; |
| P = 0.803 | ||||||
| WMH burden | 2.4 ± 1.6 | 2.2 ± 1.2 | 2.2 ± 1.2 | 2.4 ± 1.6 | 2.3 ± 1.4 | F 4,221 = 0.292; |
| P = 0.990 | ||||||
| Kcal expended/ week | 132.9 ± 69.8 | 397.1 ± 100.0 | 782.2 ± 130.4 | 1472.8 ± 284.0 | 3187.6 ± 1155.1 | F4,221 = 216.012; |
| P < 0.0001 |
The mean ± s.d. is shown for each measure. ANOVAs, performed on each variable, show whether the mean clinical measure differenced significantly across groups. Chi‐squared tests were performed for categorical variables. 3MS scores, white matter hyperintensity values, and kilocalories/week were not normally distributed, so a non‐parametric Kruskal‐Wallis one‐way ANOVA was used. ApoE4 carriers refers to the number of subjects carrying at least one epsilon 4 allele of the apolipoprotein E gene, which confers increased risk for late‐onset Alzheimer's disease (Roses et al., 1993). Levels of white matter hyperintensities (WMH) were based on expert visual grading on a scale of 0 to 9, with no white matter findings classified as grade 0 and the most severe WMH classified as grades 8 and 9 [Longstreth et al., 1996].
MRI Acquisition and Image Correction
All MRI data were acquired at the University of Pittsburgh Medical Center MR Research Center using a 1.5 T GE Signa scanner (GE Medical Systems, Milwaukee, WI, LX Version). A 3D volumetric spoiled gradient recalled acquisition (SPGR) sequence was obtained covering the whole brain (TE/TR = 5/25 msec, flip angle = 40°, NEX = 1, slice thickness = 1.5 mm/0 mm interslice gap). Images were acquired with an in‐plane acquisition matrix of 256 × 256 × 124 image elements, 250 × 250 mm2 field of view and an in‐plane voxel size of 0.98 mm.
Image Preprocessing
Scans were corrected for intensity nonuniformities and linearly registered to the International Consortium for Brain Mapping standard brain image template (ICBM‐53) [Mazziotta et al.,2001] using a nine‐parameter registration to account for global position and scale differences across individuals, including head size [Hua et al.,2008a]. Globally aligned images were re‐sampled in an isotropic space of 220 voxels along each axis (x, y, and z) with a final voxel size of 1 mm3.
Minimal Deformation Template
The minimal deformation template (MDT), or “average” brain image, was created from the MRI scans of 40 cognitively normal CHS subjects to enable automated image registration, reduce statistical bias, and to optimize detection of statistically significant effects [Hua et al.,2008a]. The template was designed to be an unbiased representation of the sample. Equal numbers of men (N = 20) and women (N = 20) were included in the MDT group. There was no statistical difference (P = 0.18) in the age of the subjects used in the MDT (77.3 ± 2.7 SD years of age) relative to the other subjects in the sample (77.9 ± 3.6 SD years of age).
TBM and 3D Jacobian Maps
All scans were nonlinearly aligned to the study‐specific template so that they would all share a common coordinate system. The local expansion factor of the 3D elastic warping transform, known as the Jacobian determinant, was plotted for each subject. These 3D Jacobian maps show relative volume differences between each individual and the common template, and reveal areas of structural volume deficits, or expansions (e.g., in the ventricles), relative to the healthy population average. Associations between education, physical activity, BMI, and regional brain volumes were evaluated at each voxel using the general linear model, across the whole brain and in specific lobar regions (temporal lobe masks).
Region of Interest Mask
The CHS‐MDT template was manually parcellated by a trained neuroanatomist using the Brainsuite software program (http://brainsuite.usc.edu/) to generate binary masks for temporal lobes. The manual delineation protocol was the same as that used in previously published studies [Hua et al.,2008b; Stein et al.,2010]. A trained neuroanatomist performed manual parcellation of the temporal lobe masks, blind to subject information. The temporal lobe region of interest (ROI) mask is based on the International Consortium for Brain Mapping standard brain image template (ICBM‐53) [Mazziotta et al.,2001], the same template used to align the MDT.
The following protocol was used to delineate the temporal lobe beginning laterally in the sagittal view, but consulting three planes of section in a triaxial display. From the most anterior point, the Sylvian fissure was traced to the peak of its middle segment (before its ascending segment), continuing horizontally to the most posterior point. Once the temporo‐occipital incisure appeared, the Sylvian fissure was traced to its middle segment peak, followed horizontally across to the lateral occipital sulcus, and then angled downward to the temporo‐occipital incisure. When the insular cortex appeared, the Sylvian fissure was traced to its middle segment peak, excluding the insular cortex, and following a line to the lateral occipital sulcus and angled downward to the temporo‐occipital incisure. Once the temporo‐occipital incisure was no longer visible, the posterior collateral sulcus was used to delineate the mask border. When the lateral occipital sulcus was no longer visible, the middle segment of the Sylvian fissure was followed directly to the collateral sulcus. When the Sylvian fissure and insular cortex were no longer visible, the superior temporal gyrus was traced to the top body of the hippocampus and angled downward to the posterior transverse collateral sulcus. Once the calcarine sulcus appeared, the superior temporal gyrus was followed from the head to the body of the hippocampus and then across to the calcarine sulcus to the most inferior point. Once the head of the hippocampus was detached from the parahippocampal gyrus, the head of the hippocampus was traced. From the most interior point of the lateral ventricle, a horizontal line was traced to the parieto‐occipital sulcus, including all regions inferior to this boundary, anterior and superior to the parieto‐occipital sulcus, and posterior to the posterior border of the pulvinar. When the corpus callosum appeared, a line was traced from the corpus callosum to the parieto‐occipital sulcus, including all regions inferior to this border and anterior to the parieto‐occipital sulcus, posterior to the corpus callosum, until reaching the interhemispheric fissure shown clearly in the sagittal view.
Correlating Structural Brain Differences With Education and Physical Activity
At each voxel, partial correlations were computed between the Jacobian values (which represent brain tissue deficit or excess relative to the standard template) and educational level, after controlling for age, sex, and physical activity. Similarly, correlations were computed between physical activity and Jacobian values controlling for age, sex, and educational level. All correlation maps were corrected for multiple comparisons using the widely used false discovery rate (FDR) method [Benjamini,1995]. The FDR method assigns overall significance values to each statistical map (of correlations), based on the expected proportions of voxels with statistics exceeding any given threshold under the null hypothesis [Benjamini,1995]. Age, sex, and years of education were separately regressed against brain volume; all covariates were significant, with sex being the most highly correlated with individual differences in brain volume, as we have reported previously in independent samples of younger adults [Brun et al.,2009].
Correlating Structural Brain Differences With BMI
Partial correlations were computed at every voxel between Jacobian values and BMI controlling for age, sex, and educational level, since BMI differed across educational groups (Table III).
Table III.
Correlation matrix shown for variables (BMI, education, and physical activity)
| BMI | Education | Physical activity | |
|---|---|---|---|
| BMI | 1 | −0.233 | −0.145 |
| Education | −0.233 | 1 | −0.041a |
| Physical activity | −0.145 | −0.041a | 1 |
Pearson correlation values are shown for each pair.
Indicates pairs of variables that were not significantly correlated. All other pairs were significantly correlated (P < 0.05).
RESULTS
Our study had three main findings: (1) higher educational level and greater physical activity were associated with greater brain volumes (Figs. 1 and 2), (2) BMI differed significantly across educational levels (Table III: r(226) = −0.145, P = 0.029) and across the quintiles of physical activity (Table III: r(226) = −0.233, P < 0.001) and (3) BMI accounted for variance in brain structure (Fig. 3) even after accounting for the effects of physical activity and education (Fig. 3, bottom panel).
Figure 1.
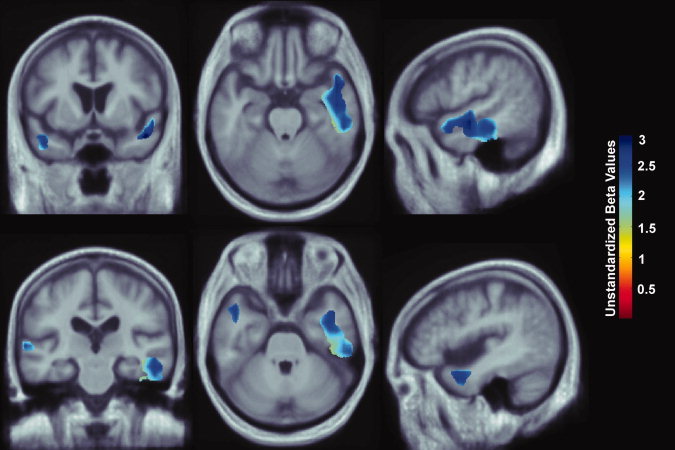
3D maps show areas where regional brain volumes correlated significantly with educational level, based on completion of some high school, all high school, some college, all college, and professional school. All maps were significant after standard correction for multiple comparisons (FDR q = 0.05, critical uncorrected P = 0.0046). In the significant areas, the regression coefficients (unstandardized beta values) are shown at each voxel. No negative correlations were significant. Images are in radiological convention (left side of the brain shown on the right) and are displayed on a study‐specific template. [Color figure can be viewed in the online issue, which is available at wileyonlinelibrary.com.]
Figure 2.
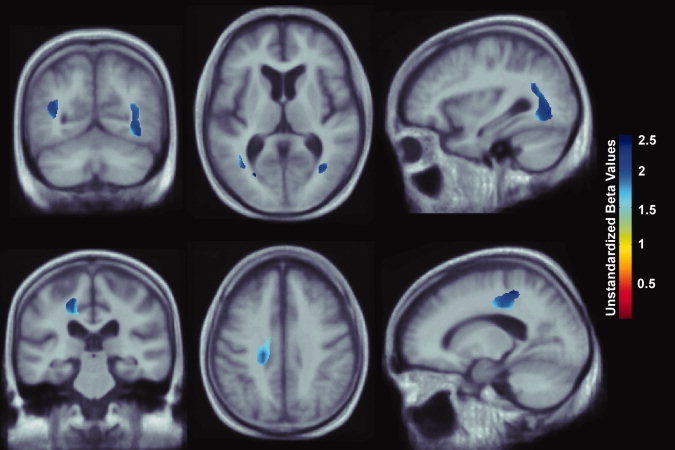
Whole brain 3D maps show areas where regional brain volumes correlated significantly with physical activity, measured in quintiles of kilocalories expended per week. All maps were significant after standard correction for multiple comparisons (FDR q = 0.05, critical uncorrected P = 0.0002). In the significant areas, the regression coefficients (unstandardized beta values) are shown at each voxel. No negative correlations were significant. Images are in radiological convention (left side of the brain shown on the right) and are displayed on a study‐specific template. [Color figure can be viewed in the online issue, which is available at wileyonlinelibrary.com.]
Figure 3.
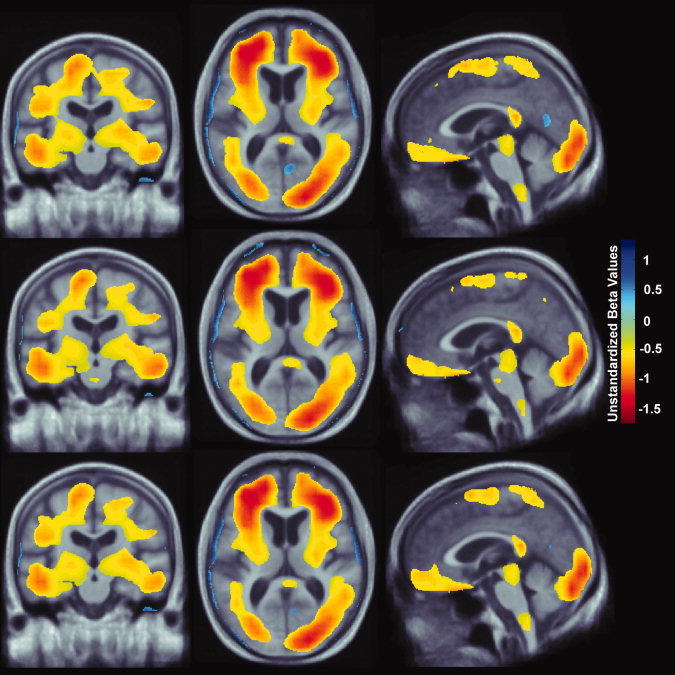
Whole brain 3D maps show areas where regional brain volumes correlated significantly with BMI after controlling for age, sex, and educational level (top panel: N = 226; FDR q = 0.05, critical uncorrected P = 0.0201). Maps also show brain regions significantly associated with BMI, after correcting for the effects of age, sex, and physical activity (middle panel: N = 226; FDR q = 0.05, critical uncorrected P = 0.0194). Lastly, maps showing brain regions significantly correlated with BMI after controlling for age, sex, educational level, and physical activity are shown (bottom panel: N = 226, FDR q = 0.05, critical uncorrected P = 0.0189). All maps were significant after standard correction for multiple comparisons. These represent the estimated degree of tissue excess or deficit at each voxel, as a percentage, for each unit gain in BMI. Images are displayed in radiological convention (left side of the brain shown on the right) and are displayed over a study‐specific brain image template. [Color figure can be viewed in the online issue, which is available at wileyonlinelibrary.com.]
Educational Level and Brain Structure
In a region‐of‐interest analysis, each increment in educational level (completion of some high school, high school, some college, college, and professional school) was associated with 2–3% greater average tissue volumes in the temporal lobe gray matter after controlling for age, sex, and physical activity (Fig. 1; FDR q = 0.05, critical uncorrected P = 0.0046). We used a standard FDR correction for multiple statistical comparisons across voxels in the brain, at the conventionally accepted level of q = 0.05, which means that only 5% of the voxels shown in the thresholded statistical maps are expected to be false positives. Regression coefficient (unstandardized beta value) maps are shown only for statistically significant regions, estimating the average percent brain tissue increase for each increment in educational level completed. Dark blue colors represent an average 3% greater brain tissue volume for each level of education completed, and lighter blue and cyan colors represent a 2.5% and 2% greater regional brain volume, respectively. There were no regions where greater educational level was significantly associated with lower brain volumes. Our results do show, however, that greater educational level was statistically associated with higher volumes in some brain regions.
Physical Activity and Brain Structure
Each increment in physical activity (categorized in quintiles) was associated with a ∼2–2.5% greater average tissue volume, after controlling for age, sex, and education. The statistical effects of physical activity were detected in the white matter of the corona radiata extending into the parietal‐occipital junction (Fig. 2; FDR q = 0.05, critical uncorrected P = 0.0002). Significant regression coefficients (unstandardized beta values) are represented as the % increment in average brain tissue for each quintile of physical activity. Increased physical activity is positively associated with greater average brain tissue volumes (about 2–2.5% more brain tissue per quintile of physical activity). Dark blue colors represent an average 2.5% brain tissue increase for each quintile of physical activity, and cyan colors represent a 2% brain volume increase, respectively. There were no regions where greater educational level was significantly associated with decreased brain volume.
BMI and Brain Structure
BMI statistically differed across educational groups (Table III: r(226) = −0.145, P = 0.029) and across quintiles of physical activity (Table III: r(226) = −0.233, P < 0.001). Since BMI and exercise were highly correlated, we examined whether BMI might be a contributing factor and created maps correlating BMI and brain structure. 3D maps relating BMI and brain structure in 226 subjects from the CHS cohort showed significantly lower brain volumes (Fig. 3: top panel, FDR q = 0.05, critical uncorrected P = 0.0201) after controlling for age, sex, and educational level. We also examined the effects of BMI after correcting for the effects of age, sex, and physical activity and found brain a similar pattern of brain atrophy (Fig. 3: middle panel, FDR q = 0.05, critical uncorrected P = 0.0194). Every one unit increase in BMI was associated with a ∼1‐1.5% lower brain volume in many of the same brain regions, controlling for age and sex. These included the frontal, temporal, parietal, and occipital lobe regions. Atrophy was also detected in the brain stem and cerebellar regions in both cohorts.
We included BMI in the model to determine whether the effects of education and physical activity on brain structure could also be attributable to differences in BMI, which was not adjusted for in prior studies. When physical activity, educational level, and BMI were included in the same model, BMI was the only variable that was statistically associated with brain structure (Fig. 3: bottom panel, FDR q = 0.05, critical uncorrected P = 0.0189). There were no brain regions whose volumes were statistically correlated with educational level after controlling for age, sex, physical activity, and BMI (results not shown). Similarly, physical activity was no longer statistically correlated with brain structure once BMI was included in the model, and after also controlling for age, sex, and educational level (results not shown). The brain regions significantly correlated with BMI (Fig. 3) are consistent when accounting for the variance due to physical activity, education, or both.
DISCUSSION
This is one of the first neuroimaging studies to map the effects of education and physical activity on brain structure. Higher educational levels and greater physical activity were associated with greater regional brain volumes on MRI in healthy elderly subjects. However, we had previously shown an inverse association between BMI and regional brain volumes [Raji et al.,2010]. When accounting for BMI in this study, the effects of exercise and education were equally explainable as a statistical effect of BMI. There are several possible explanations. First, because BMI is highly correlated with both education and exercise, it is to be expected that covarying for BMI will attenuate, or completely remove, the effects of education and exercise in predicting brain atrophy. A hypothetical diagram (Fig. 4) may be used as a possible explanation for how BMI, physical activity, and education may account for differences in brain structure.
Figure 4.
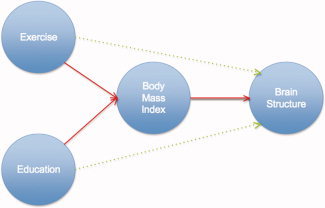
Interconnected factors influencing brain structure. In this hypothetical model, similar to physical activity, and education, BMI also accounts for some of the variance in brain structure. Under this interpretation, BMI is influenced by all factors (e.g., physical activity, education, metabolic, and vascular abnormalities) leading to the pathophysiological effects on the brain and altered brain structure (see Discussion). Exercise and education may exert an additional direct effect on brain structure independent of BMI (green arrows). [Color figure can be viewed in the online issue, which is available at wileyonlinelibrary.com.]
Education and physical activity may have beneficial effects on brain structure, and these may work, in part, by reducing obesity. That is, educated individuals who engage in regular physical activity may have higher brain volumes precisely because they are less likely to be overweight or obese. A combination of high‐fat diet and low exercise (along with other genetic and environmental factors) contribute to both obesity and increased vascular burden to the brain, which are thought to accelerate age‐related atrophy [Raji et al.,2010]. Our data provide further evidence that factors (e.g., education, physical activity, diet, and BMI) may predict brain structure; however, determining the independent effects of each factor on brain structure is difficult because they are all highly correlated with one another in cross‐sectional studies (Fig. 4); this could be overcome, to some extent, with an interventional design where one factor is deliberately manipulated.
We also tested whether educational attainment was associated with brain atrophy in old age [Christensen et al.,2007]. In nondemented subjects, some studies support an effect of education on brain atrophy [Coffey et al.,1999; Dufouil et al.,2003; Staff et al.,2004], but others do not [Christensen et al.,2007; Kidron et al.,1997].
Prior epidemiological studies suggest that low educational attainment is correlated with increased risk for developing dementia, including AD [Katzman,1993]. Since AD pathology follows a characteristic atrophic pattern, with its earliest effects in the temporal lobe region [Braak and Braak,1991; Thompson et al.,2003], we were interested in the effects of education on brain structure within the temporal lobes. To apply our analysis to this ROI, the temporal lobe ROI mask was identified (see Methods for details on mask boundaries).
In one study of healthy individuals, education was positively correlated with frontal white matter volume, after controlling for physical activity [Gordon et al.,2008], and higher levels of formal education related to a lesser occurrence of WMH. In our sample, educational level was correlated with greater temporal lobe volume, after controlling for physical activity (Fig. 1). Even so, WMH burden was not different among groups with different educational level (Table I; P = 0.534). Differences between these studies may be due to the greater sample size in our study (N = 226) versus Gordon et al. (N = 40), our measures of physical activity (kcal/week) versus fitness level (VO2max), and our quantification of educational level (i.e., some high school, completed high school, some college, completed college, completed professional school) versus years of education completed. Other causal factors may be associated with educational level, such as socioeconomic status and occupation.
Here, energy expenditure data was divided into quintiles since physical activity data in elderly populations tends to be heavily skewed and follow a non‐normal distribution. Prior studies have resolved this distributional issue by binning physical activity data into quartiles [Yaffe et al.,2001] or quintiles [Weuve et al.,2004]. Here, physical activity levels were based on quintiles since educational level was also divided into five groups. However, we also analyzed the physical activity data based on quartiles, and found that physical activity remained significantly associated with brain structure (FDR q = 0.05, critical uncorrected P = 0.0007).
Currently, it is unknown whether physical activity is responsible for differences in brain structure; however, animal studies suggest that physical activity is a positive factor in maintaining brain structure. In animals, physical activity increases neurogenesis, cell survival, hippocampus‐dependent spatial learning [van Praag et al.,1999], expression of other neurotrophic factors such as BDNF and IGF‐1 [Carro et al.,2001; Neeper et al.,1995], and brain plasticity [Cotman and Berchtold,2002]. The observed correlation in this study does not necessarily imply a causal effect of exercise on brain structure; people who engage in greater physical activity may also tend to avoid activities that harm brain structure, or they may simply be in better health than those who exercise less, or not at all. Even so, all subjects in this study were cognitively normal and in good health.
In addition to prior animal studies, a number of human studies using both interventional [Colcombe et al.,2006; Pereira et al.,2007] and cross‐sectional approaches [Peters et al.,2009] have also suggested that physical activity, or cardiovascular fitness, accounts for differences in brain structure; however, these studies did not control for effects of BMI. Our results relating physical activity and brain structure (Fig. 2) are consistent with prior studies that did not account for the potential effects of BMI. Prior reports [Bugg and Head,2009; Colcombe et al.,2003; Colcombe et al.,2006; Erickson et al.,2007] suggest that exercise has a role in reducing age‐related atrophy, but BMI was not reported in these studies, making it difficult to assess whether it might explain the relationship between exercise, or physical activity, and brain structure.
Physical activity is also associated with a lower incidence of cardiovascular risk factors such as diabetes [Mozaffarian et al.,2009], coronary heart disease [Siscovick et al.,1997], incidence of atrial fibrillation [Mozaffarian et al.,2008], and inflammatory markers [Geffken et al.,2001]. In an elderly sample also from the CHS, Siscovick et al. [1997] found that exercise intensity was associated with a favorable coronary disease risk factor profile [Siscovick et al.,1997].
The effects of BMI on brain structure are consistent with past studies linking higher BMI to smaller regional brain volumes [Gustafson et al.,2004; Pannacciulli et al.,2006; Raji et al.,2010; Taki et al.,2008]. BMI is correlated with lower brain volume in the temporal and parietal lobes—brain regions where volumes are significantly correlated with education (Fig. 1) and physical activity (Fig. 2). While it is difficult to assess the independent effects of these factors, our data suggests that similar to education and physical activity, BMI also accounts for variance in brain volume (Fig. 3).
One plausible interpretation is that higher physical activity and educational level lead to better vascular health and consequently a relatively preserved brain volume. In this cohort, BMI was highly correlated with education and physical, suggesting that BMI is likely a consequence of greater energy expenditure through physical activity, higher educational attainment, and better overall vascular health (Fig. 4). Under this interpretation, greater physical activity leads to better vascular health, to relatively preserved brain volumes and to lower BMI, and consequently, brain structure and BMI variables track each other and are highly correlated. This interpretation offers a possible reason why physical activity is linked to greater brain volume, but because physical activity tends to be correlated with BMI, the statistical effects of physical activity on the brain are no longer observed when statistical adjustments are made for BMI. Similarly, higher education itself does not cause lower BMI, but may be an indicator variable for other socio‐demographic factors that may be linked to greater educational achievement (e.g., higher income, better health care, and improved diet). Exercise and education may exert an additional direct effect on brain structure independent of BMI (green arrows). Our current study does not provide evidence for this, but evidence for this might be obtained in a randomized clinical trial that deliberately holds one factor constant and varies the other.
Alternatively, and perhaps controversially, it may be that physical activity has no detectable effect on brain structure, in subjects with the same BMI. Instead, dietary factors may affect BMI, and BMI may in turn affect a person's physical activity level. Under this interpretation, dietary factors (e.g., fat content and overall calorie intake) may be the most relevant causal factors influencing BMI and brain structure; higher BMI may deter individuals from engaging in physical activity, either through reduced motivation, or physical difficulty in exercising. Under this more extreme interpretation, diet and BMI may be the most relevant causal factors influencing brain volume, and physical activity may be merely an epiphenomenon.
This study has several limitations. Causal effects of physical activity on brain structure are only detectable using a longitudinal neuroimaging approach, ideally in a randomized clinical trial [Heyn et al.,2004]. A preselected subpopulation with a very narrow range of BMI could also be studied, to avoid the confounding effects of the naturally occurring correlation between BMI and physical activity.
Our study is also limited as we relied on self‐reported measures of physical activity. The reliability of the Minnesota Leisure Time Activity Questionnaire has been comprehensively validated, but the reliability of determining low‐to‐moderate levels of activity has been identified as an area that needs improvement [Richardson et al.,1994]. Peak oxygen uptake (VO2peak) or lactate threshold are cardiovascular fitness measures that have been used in prior studies [Colcombe et al.,2003,2006; Ruscheweyh et al.,2009], and may be more objective assessments of physical activity level. Further, many studies have used both self‐reported measures of physical activity, using a validated questionnaire or by computing a physical activity score corresponding to metabolic equivalent (MET), as well as objective assessments including the ergometer test, lactate step test, or measures of peak oxygen uptake. Another limitation is the cross‐sectional nature of this study. This could be improved in future studies with serial MRI, using corresponding measures of physical activity to better relate deliberate alterations in physical activity to rates of brain atrophy over time.
In 2000, only 3% of Americans reported a healthy lifestyle (i.e., regular physical activity, nonsmoking, daily diet including five or more serving of fruit/vegetables, and a healthy BMI (18.5–25) [Reeves and Rafferty,2005]. Understanding how physical activity, diet, education, and obesity affect brain health may help to identify lifestyle interventions to slow or delay age‐related brain deterioration.
Acknowledgements
A full list of participating CHS investigators and institutions is available at http://www.chs-nhlbi.org.
REFERENCES
- Baron RM, Kenny DA ( 1986): The moderator‐mediator variable distinction in social psychological research: Conceptual, strategic, and statistical considerations. J Pers Soc Psychol 51: 1173–1182. [DOI] [PubMed] [Google Scholar]
- Benjamini Y, Hochberg, Y ( 1995): Controlling the false discovery rate: A practical and powerful approach to multiple testing. J.R. Statist Soc B 57: 289–300. [Google Scholar]
- Braak H, Braak E ( 1991): Neuropathological stageing of Alzheimer‐related changes. Acta Neuropathol 82: 239–259. [DOI] [PubMed] [Google Scholar]
- Brun CC, Lepore N, Luders E, Chou YY, Madsen SK, Toga AW, Thompson PM ( 2009): Sex differences in brain structure in auditory and cingulate regions. Neuroreport 20: 930–935. [DOI] [PMC free article] [PubMed] [Google Scholar]
- Bugg JM, Head D ( 2009): Exercise moderates age‐related atrophy of the medial temporal lobe. Neurobiol Aging [Epub ahead of print]. [DOI] [PMC free article] [PubMed] [Google Scholar]
- Burns JM, Cronk BB, Anderson HS, Donnelly JE, Thomas GP, Harsha A, Brooks WM, Swerdlow RH ( 2008): Cardiorespiratory fitness and brain atrophy in early Alzheimer disease. Neurology 71: 210–216. [DOI] [PMC free article] [PubMed] [Google Scholar]
- Carro E, Trejo JL, Busiguina S, Torres‐Aleman I ( 2001): Circulating insulin‐like growth factor I mediates the protective effects of physical exercise against brain insults of different etiology and anatomy. J Neurosci 21: 5678–5684. [DOI] [PMC free article] [PubMed] [Google Scholar]
- Christensen H, Anstey KJ, Parslow RA, Maller J, Mackinnon A, Sachdev P ( 2007): The brain reserve hypothesis, brain atrophy and aging. Gerontology 53: 82–95. [DOI] [PubMed] [Google Scholar]
- Coffey CE, Saxton JA, Ratcliff G, Bryan RN, Lucke JF ( 1999): Relation of education to brain size in normal aging: Implications for the reserve hypothesis. Neurology 53: 189–196. [DOI] [PubMed] [Google Scholar]
- Colcombe SJ, Erickson KI, Raz N, Webb AG, Cohen NJ, McAuley E, Kramer AF ( 2003): Aerobic fitness reduces brain tissue loss in aging humans. J Gerontol A Biol Sci Med Sci 58: 176–180. [DOI] [PubMed] [Google Scholar]
- Colcombe SJ, Erickson KI, Scalf PE, Kim JS, Prakash R, McAuley E, Elavsky S, Marquez DX, Hu L, Kramer AF ( 2006): Aerobic exercise training increases brain volume in aging humans. J Gerontol A Biol Sci Med Sci 61: 1166–1170. [DOI] [PubMed] [Google Scholar]
- Cotman CW, Berchtold NC ( 2002): Exercise: A behavioral intervention to enhance brain health and plasticity. Trends Neurosci 25: 295–301. [DOI] [PubMed] [Google Scholar]
- Cotman CW, Berchtold NC, Christie LA ( 2007): Exercise builds brain health: Key roles of growth factor cascades and inflammation. Trends Neurosci 30: 464–472. [DOI] [PubMed] [Google Scholar]
- Dufouil C, Alperovitch A, Tzourio C ( 2003): Influence of education on the relationship between white matter lesions and cognition. Neurology 60: 831–836. [DOI] [PubMed] [Google Scholar]
- Erickson KI, Colcombe SJ, Elavsky S, McAuley E, Korol DL, Scalf PE, Kramer AF ( 2007): Interactive effects of fitness and hormone treatment on brain health in postmenopausal women. Neurobiol Aging 28: 179–185. [DOI] [PubMed] [Google Scholar]
- Erickson KI, Prakash RS, Voss MW, Chaddock L, Hu L, Morris KS, White SM, Wojcicki TR, McAuley E, Kramer AF ( 2009): Aerobic fitness is associated with hippocampal volume in elderly humans. Hippocampus 19: 1030–1039. [DOI] [PMC free article] [PubMed] [Google Scholar]
- Floel A, Ruscheweyh R, Kruger K, Willemer C, Winter B, Volker K, Lohmann H, Zitzmann M, Mooren F, Breitenstein C, et al. ( 2009): Physical activity and memory functions: Are neurotrophins and cerebral gray matter volume the missing link? Neuroimage 49: 2756–2763. [DOI] [PubMed] [Google Scholar]
- Geffken DF, Cushman M, Burke GL, Polak JF, Sakkinen PA, Tracy RP ( 2001): Association between physical activity and markers of inflammation in a healthy elderly population. Am J Epidemiol 153: 242–250. [DOI] [PubMed] [Google Scholar]
- Gondoh Y, Sensui H, Kinomura S, Fukuda H, Fujimoto T, Masud M, Nagamatsu T, Tamaki H, Takekura H ( 2009): Effects of aerobic exercise training on brain structure and psychological well‐being in young adults. J Sports Med Phys Fitness 49: 129–135. [PubMed] [Google Scholar]
- Gordon BA, Rykhlevskaia EI, Brumback CR, Lee Y, Elavsky S, Konopack JF, McAuley E, Kramer AF, Colcombe S, Gratton G, et al. ( 2008): Neuroanatomical correlates of aging, cardiopulmonary fitness level, and education. Psychophysiology 45: 825–838. [DOI] [PMC free article] [PubMed] [Google Scholar]
- Gustafson D, Lissner L, Bengtsson C, Bjorkelund C, Skoog I ( 2004): A 24‐year follow‐up of body mass index and cerebral atrophy. Neurology 63: 1876–1881. [DOI] [PubMed] [Google Scholar]
- Heyn P, Abreu BC, Ottenbacher KJ ( 2004): The effects of exercise training on elderly persons with cognitive impairment and dementia: A meta‐analysis. Arch Phys Med Rehabil 85: 1694–1704. [DOI] [PubMed] [Google Scholar]
- Hua X, Leow AD, Lee S, Klunder AD, Toga AW, Lepore N, Chou YY, Brun C, Chiang MC, Barysheva M, et al. ( 2008a): 3D characterization of brain atrophy in Alzheimer's disease and mild cognitive impairment using tensor‐based morphometry. Neuroimage 41: 19–34. [DOI] [PMC free article] [PubMed] [Google Scholar]
- Hua X, Leow AD, Parikshak N, Lee S, Chiang MC, Toga AW, Jack CR Jr, Weiner MW, Thompson PM ( 2008b): Tensor‐based morphometry as a neuroimaging biomarker for Alzheimer's disease: An MRI study of 676 AD, MCI, and normal subjects Neuroimage 43: 458–469. [DOI] [PMC free article] [PubMed] [Google Scholar]
- Katzman R ( 1993): Education and the prevalence of dementia and Alzheimer's disease. Neurology 43: 13–20. [DOI] [PubMed] [Google Scholar]
- Kidron D, Black SE, Stanchev P, Buck B, Szalai JP, Parker J, Szekely C, Bronskill MJ ( 1997): Quantitative MR volumetry in Alzheimer's disease. Topographic markers and the effects of sex and education. Neurology 49: 1504–1512. [DOI] [PubMed] [Google Scholar]
- Kinsella K, He W ( 2009): An Aging World: 2008. International Population Reports.
- Kraemer HC, Stice E, Kazdin A, Offord D, Kupfer D ( 2001): How do risk factors work together? Mediators, moderators, and independent, overlapping, and proxy risk factors. Am J Psychiatry 158: 848–856. [DOI] [PubMed] [Google Scholar]
- Lopez OL, Jagust WJ, DeKosky ST, Becker JT, Fitzpatrick A, Dulberg C, Breitner J, Lyketsos C, Jones B, Kawas C, et al. ( 2003a): Prevalence and classification of mild cognitive impairment in the Cardiovascular Health Study Cognition Study, Part 1. Arch Neurol 60: 1385–1389. [DOI] [PubMed] [Google Scholar]
- Lopez OL, Kuller LH, Fitzpatrick A, Ives D, Becker JT, Beauchamp N. ( 2003b): Evaluations of dementia in the cardiovascular health cognition study. Neuroepidemiology 22: 1–12. [DOI] [PubMed] [Google Scholar]
- Marks BL, Madden DJ, Bucur B, Provenzale JM, White LE, Cabeza R, Huettel SA ( 2007): Role of aerobic fitness and aging on cerebral white matter integrity. Ann NY Acad Sci 1097: 171–174. [DOI] [PubMed] [Google Scholar]
- Mazziotta J, Toga A, Evans A, Fox P, Lancaster J, Zilles K, Woods R, Paus T, Simpson G, Pike B, et al. ( 2001): A probabilistic atlas and reference system for the human brain: International Consortium for Brain Mapping (ICBM). Philos Trans R Soc Lond B Biol Sci 356: 1293–1322. [DOI] [PMC free article] [PubMed] [Google Scholar]
- Mozaffarian D, Furberg CD, Psaty BM, Siscovick D ( 2008): Physical activity and incidence of atrial fibrillation in older adults: The cardiovascular health study. Circulation 118: 800–807. [DOI] [PMC free article] [PubMed] [Google Scholar]
- Mozaffarian D, Kamineni A, Carnethon M, Djousse L, Mukamal KJ, Siscovick D ( 2009): Lifestyle risk factors and new‐onset diabetes mellitus in older adults: The cardiovascular health study. Arch Intern Med 169: 798–807. [DOI] [PMC free article] [PubMed] [Google Scholar]
- Neeper SA, Gomez‐Pinilla F, Choi J, Cotman C ( 1995): Exercise and brain neurotrophins. Nature 373: 109. [DOI] [PubMed] [Google Scholar]
- Pannacciulli N, Del Parigi A, Chen K, Le DS, Reiman EM, Tataranni PA ( 2006): Brain abnormalities in human obesity: A voxel‐based morphometric study. Neuroimage 31: 1419–1425. [DOI] [PubMed] [Google Scholar]
- Pereira AC, Huddleston DE, Brickman AM, Sosunov AA, Hen R, McKhann GM, Sloan R, Gage FH, Brown TR, Small SA ( 2007): An in vivo correlate of exercise‐induced neurogenesis in the adult dentate gyrus. Proc Natl Acad Sci USA 104: 5638–5643. [DOI] [PMC free article] [PubMed] [Google Scholar]
- Peters J, Dauvermann M, Mette C, Platen P, Franke J, Hinrichs T, Daum I ( 2009): Voxel‐based morphometry reveals an association between aerobic capacity and grey matter density in the right anterior insula. Neuroscience 163: 1102–1108. [DOI] [PubMed] [Google Scholar]
- Raji CA, Lopez OL, Kuller LH, Carmichael OT, Becker JT ( 2009): Age, Alzheimer's disease, and brain structure. Neurology 73: 1899–1905. [DOI] [PMC free article] [PubMed] [Google Scholar]
- Raji CA, Ho AJ, Parikshak NN, Becker JT, Lopez OL, Kuller LH, Hua X, Leow AD, Toga AW, Thompson PM ( 2010): Brain structure and obesity. Hum Brain Mapp 31: 353–364. [DOI] [PMC free article] [PubMed] [Google Scholar]
- Reeves MJ, Rafferty AP ( 2005): Healthy lifestyle characteristics among adults in the United States, 2000. Arch Intern Med 165: 854–857. [DOI] [PubMed] [Google Scholar]
- Richardson MT, Leon AS, Jacobs DR Jr, Ainsworth BE, Serfass R ( 1994): Comprehensive evaluation of the Minnesota Leisure Time Physical Activity Questionnaire. J Clin Epidemiol 47: 271–281. [DOI] [PubMed] [Google Scholar]
- Ruscheweyh R, Willemer C, Kruger K, Duning T, Warnecke T, Sommer J, Volker K, Ho HV, Mooren F, Knecht S, et al. ( 2009): Physical activity and memory functions: An interventional study. Neurobiol Aging [Epub ahead of print]. [DOI] [PubMed] [Google Scholar]
- Scahill RI, Frost C, Jenkins R, Whitwell JL, Rossor MN, Fox NC ( 2003): A longitudinal study of brain volume changes in normal aging using serial registered magnetic resonance imaging. Arch Neurol 60: 989–994. [DOI] [PubMed] [Google Scholar]
- Siscovick DS, Fried L, Mittelmark M, Rutan G, Bild D, O'Leary DH ( 1997): Exercise intensity and subclinical cardiovascular disease in the elderly. The Cardiovascular Health Study. Am J Epidemiol 145: 977–986. [DOI] [PubMed] [Google Scholar]
- Staff RT, Murray AD, Deary IJ, Whalley LJ ( 2004): What provides cerebral reserve? Brain 127( Part 5): 1191–1199. [DOI] [PubMed] [Google Scholar]
- Stein JL, Hua X, Morra JH, Lee S, Hibar DP, Ho AJ, Leow AD, Toga AW, Sul JH, Kang HM, et al. ( 2010): Genome‐wide analysis reveals novel genes influencing temporal lobe structure with relevance to neurodegeneration in Alzheimer's disease. Neuroimage 51: 542–554. [DOI] [PMC free article] [PubMed] [Google Scholar]
- Stern Y ( 2002): What is cognitive reserve? Theory and research application of the reserve concept. J Int Neuropsychol Soc 8: 448–460. [PubMed] [Google Scholar]
- Taki Y, Kinomura S, Sato K, Inoue K, Goto R, Okada K, Uchida S, Kawashima R, Fukuda H ( 2008): Relationship between body mass index and gray matter volume in 1,428 healthy individuals. Obesity (Silver Spring) 16: 119–124. [DOI] [PubMed] [Google Scholar]
- Taylor HL, Jacobs DR, Jr. , Schucker B, Knudsen J, Leon AS, Debacker G ( 1978): A questionnaire for the assessment of leisure time physical activities. J Chronic Dis 31: 741–755. [DOI] [PubMed] [Google Scholar]
- Teng EL, Chui HC ( 1987): The Modified Mini‐Mental State (3MS) examination. J Clin Psychiatry 48: 314–318. [PubMed] [Google Scholar]
- Thompson PM, Apostolova LG ( 2007): Computational anatomical methods as applied to ageing and dementia. Br J Radiol 80: S78–S91. [DOI] [PubMed] [Google Scholar]
- Thompson PM, Hayashi KM, de Zubicaray G, Janke AL, Rose SE, Semple J, Herman D, Hong MS, Dittmer SS, Doddrell DM, et al. ( 2003): Dynamics of gray matter loss in Alzheimer's disease. J Neurosci 23: 994–1005. [DOI] [PMC free article] [PubMed] [Google Scholar]
- van Praag H, Kempermann G, Gage FH ( 1999): Running increases cell proliferation and neurogenesis in the adult mouse dentate gyrus. Nat Neurosci 2: 266–270. [DOI] [PubMed] [Google Scholar]
- Weuve J, Kang JH, Manson JE, Breteler MM, Ware JH, Grodstein F ( 2004): Physical activity, including walking, and cognitive function in older women. JAMA 292: 1454–1461. [DOI] [PubMed] [Google Scholar]
- Yaffe K, Barnes D, Nevitt M, Lui LY, Covinsky K ( 2001): A prospective study of physical activity and cognitive decline in elderly women: Women who walk. Arch Intern Med 161: 1703–1708. [DOI] [PubMed] [Google Scholar]