

SYNOPSIS
Objectives
We examined geographic patterns of lung cancer incidence in Kentucky. Recent research has suggested that the coal-mining industry contributes to lung cancer risk in Appalachia. We focused on the southeastern portion of the state, which has some of the highest lung cancer rates in the nation.
Methods
We implemented a spatial scan statistic to identify areas with lung cancer incidence rates that were higher than expected, after adjusting for age, gender, and smoking. The Kentucky Cancer Registry supplied information on cases (1995–2007). The U.S. Census (2000) and several years of Behavioral Risk Factor Surveillance System data (1996–2006) provided county-level population and smoking data. We compared the results with coal-mining data from the Mining Safety and Health Administration and public water utility data from the Kentucky Division of Water.
Results
We identified three clusters of counties with higher-than-expected rates. Cluster 1 (relative risk [RR] = 1.21, p<0.01) included 12 counties in southeastern Kentucky. Cluster 2 (RR=1.17, p<0.01) included three nearby counties in the same region. Several of the 15 counties in Cluster 3 (RR=1.04, p=0.01) were part of the Louisville, Kentucky, or Cincinnati, Ohio, metropolitan areas. All of the counties in Clusters 1 and 2 produced significant amounts of coal.
Conclusion
Environmental exposures related to the coal-mining industry could contribute to the high incidence of lung cancer in southeastern Kentucky. Lack of evidence for this effect in western Kentucky could be due to regional differences in mining practices and access to public water utilities. Future research should collect biological specimens and environmental samples to test for the presence of trace elements and other lung carcinogens.
In 2009, Kentucky had the highest prevalence of cigarette smoking in the United States, at about 25.6% of the adult population.1 Age-adjusted rates of lung cancer incidence and mortality in Kentucky are also among the highest in the nation, at 97.7 and 74.6 per 100,000 residents, respectively, in 2007.2 These figures vary widely across the 120 counties in Kentucky; however, counties in the southeastern portion of the state generally have higher rates of smoking and lung cancer incidence. Many of these counties are part of Central Appalachia, a subregion of Appalachia noted for its high poverty and low educational attainment.3 The Appalachian region as a whole, which includes counties in 13 states from New York to Mississippi, has a higher rate of lung cancer than the general U.S. population, and Central Appalachia (including West Virginia, eastern Kentucky, and adjacent parts of Tennessee and Virginia) has the highest rates of lung cancer in the region and the nation.4–6 A recent multistate study suggests, however, that high rates of lung cancer mortality in coal-mining areas of Central Appalachia cannot be explained by tobacco use alone, even after adjusting for several potential confounders.7 Thus, we suggest that environmental exposures related to the coal-mining industry could be contributing to risk in the region. This study explored this issue among counties in Kentucky.
Smoking undoubtedly contributes more than any other factor to the high rates of lung cancer found throughout the state. This contribution is especially true in Appalachian Kentucky, where smoking prevalence is higher and a larger percentage of smokers smoke more than a pack a day, relative to the rest of the state.8 Besides tobacco use, however, several occupational and/or environmental exposures might influence lung cancer patterns. For example, a large proportion of residents in the Appalachian region rely on private wells for drinking water,9 which might put them at risk of exposure to trace elements from natural or man-made sources (e.g., arsenic, chromium, and nickel), which are known or suspected lung carcinogens.10 Workers in the extensive mining industry are likely exposed to coal and silica dusts, which have been linked to a variety of lung diseases.11 Radiation may also contribute to lung cancer incidence in Kentucky—much of the state lies within the Environmental Protection Agency's Radon Zone 1, where indoor radon levels are generally expected to exceed the remediation level (4 picocuries per liter);12 and workers at the Paducah Gaseous Diffusion Plant in McCracken County have produced enriched uranium for military or commercial use since 1952. Furthermore, although largely rural, Kentucky has several counties that belong to large metropolitan areas where exposure to air pollution might influence lung cancer incidence.13
The purpose of this study was to identify regions of the state where the contribution of these factors could produce measurable effects on lung cancer incidence. Our primary focus was Appalachia, due to its extremely high rates of incidence and mortality. Nevertheless, we also addressed patterns of incidence across the entire state to understand how much higher lung cancer incidence really is in Appalachian counties, and what the possible cause(s) might be.
To investigate the extent to which non-tobacco factors contribute to Kentucky's high rate of lung cancer incidence, especially in the Appalachian region, we explored county-level patterns of lung cancer incidence, while adjusting for three risk factors: age, gender, and a history of cigarette smoking (i.e., lifetime smoking). The distribution of these factors varies widely by county, and all are related to lung cancer risk, so adjusting for their distribution among counties provides relative risk (RR) estimates that reveal the influence of other factors. We compared these patterns of risk with county-level data on coal-mining intensity to determine whether this industry could play a significant role in the etiology of lung cancer in Kentucky.
METHODS
We employed a spatial scan statistic to determine whether lung cancer incidence in any region of Kentucky was elevated after adjusting for county-level gender and age distribution, as well as lifetime cigarette smoking prevalence.14 Several other researchers have used this cluster detection and evaluation method to identify geographic variations in the incidence and mortality of cancers, including brain cancer,15 colorectal cancer,16 lung cancer, and several others.17
Briefly, the spatial scan statistic compares the rate of a disease or other event within a scan window with the rate outside of it. In a county-level study such as this, circular scan windows with continuously varying radii are successively centered upon each county's centroid, or geographic center. Nearby counties with centroids that fall within the circle are included in a cluster. Increasingly larger circular scan windows will create larger clusters as more county centroids are included, up to a predetermined maximum population size. The rate of cases in the population of each resulting cluster of counties is compared with the rate in the remainder of the state. Monte Carlo simulation and hypothesis testing, which compares the observed spatial pattern of cases with many replicated patterns generated under the null hypothesis (i.e., spatial randomness after adjusting for covariates), identifies those clusters of counties with rates that are significantly higher than would be expected. In this study, we identified clusters of counties with significantly higher incidence rates of lung cancer than the rest of the state, after adjusting for variations in age and gender distributions, as well as lifetime smoking prevalence. A great advantage of this technique is that it allows one to identify patterns of incidence among geographic areas of varying size, rather than at the county level alone.
Implementing the spatial scan statistic required two data files: one describing cases and another describing the population. We obtained data for lung cancer cases from the Kentucky Cancer Registry (KCR), a population-based cancer registry that is based at the University of Kentucky and is part of the National Cancer Institute's Surveillance, Epidemiology, and End Results program.18 For the population file, we used data from the U.S. Census, which we combined with cigarette smoking data from the Behavioral Risk Factor Surveillance System (BRFSS). The BRFSS is an annual population-based health behavior survey funded by the Centers for Disease Control and Prevention and conducted by all 50 states and several territories.19 These data were obtained from the Kentucky Cabinet for Health and Family Services, Kentucky Department of Public Health, which conducts the BRFSS in Kentucky.
The KCR provided data on all lung cancer cases in Kentucky from 1995 to 2007 for the case file. The case file we produced from the KCR data contained the age group (<50, 50–59, 60–69, 70–79, and ≥80 years of age), gender, lifetime smoking status (yes/no), and county of residence for each lung cancer case. Cigarette smoking data indicated only whether or not the case had a history of tobacco use, regardless of current usage. These data showed that 74.0% of cases were known to be smokers at some point in their lives and that 5.7% were known to be never-smokers. Smoking data were missing in the remainder (20.3%) of cases, and for these we assumed the person was a lifetime smoker. Because about 90% of lung cancer cases have a history of cigarette smoking,20 misclassification bias would likely affect a larger percentage of cases if we instead assumed that those with missing smoking data were never-smokers. Regardless, we created an alternative case file to explore how our assumption with regard to missing smoking data affected our results. In this alternative case file, “unknown smokers” were assumed to be never-smokers and coded as such for an otherwise identical analysis.
We prepared the population data file by estimating, for each county, the number of lifetime smokers (and never-smokers) in the same age and gender groups as in the case file. Doing so required population data from the U.S. Census 2000 and multiple years of BRFSS data. Although the U.S. Census 2000 data we used for this research are now about 11 years old, they were collected toward the middle of the time period we addressed in this study. We used these data to determine county-level population figures by age and gender.
We combined 11 years of BRFSS data, 1996–2006, to estimate lifetime smoking by gender in each county. Aggregating many years was necessary to obtain stable prevalence rates, as several counties in Kentucky have very small populations and, therefore, few respondents to the BRFSS. For these data, we defined lifetime smoking as answering “yes” to the following question from the BRFSS survey: “Have you smoked at least 100 cigarettes in your entire life?” We multiplied county- and gender-specific lifetime smoking percentages from the BRFSS by the U.S. Census 2000 population in each county's age and gender groups to produce the population file. This file thus contained 2,400 records, one for each age, gender, and smoking combination in each of Kentucky's 120 counties. These data enabled calculation of the expected number of lung cancer cases in each county based on its age, gender, and smoking distributions. Lastly, we created an alternative population file using current smoking rates (assessed using a standard calculated variable from the BRFSS) so that we could assess how our choice of tobacco use variable might have affected our results.
We also created alternative case and population files containing data for women only. Because occupations in some mining, manufacturing, and other industries are known to confer an increased risk of lung disease, analyzing data for women only should considerably reduce the influence of such exposures, which are more often encountered by men.21,22
All case and population data files were imported into SaTScan™ version 9.0, free software developed specifically for implementing spatial scan statistics.14,23 We conducted all analyses using a discrete Poisson model using SaTScan's default settings: a circular scan window, a maximum cluster size of 50% of the total population, and 999 Monte Carlo replications.
After completing the spatial scan statistics, we compared the lung cancer clusters they identified with county-level data on coal mining and public water utility service. We obtained data collected by the Mining Safety and Health Administration (MSHA) to identify how much coal has been mined in each county in Kentucky in the past few decades. The file we produced from these data lists, by county, the amount of coal (in tons) mined per square mile from 1983 to 2007, in all types of mines. We used these data to compare the geographic variation in coal-mining intensity and, thus, the concentration of related environmental contamination in each county, with identified clusters of lung cancer. We also examined data procured previously from the Kentucky Division of Water regarding the proportion of each county's households with public water service in 2000.9
We created maps displaying our results using ArcGIS version 9.3,24 layering clusters identified using SaTScan over county-level maps displaying (1) crude lung cancer incidence using the KCR data and (2) tons of coal produced per square mile using the MSHA data.
RESULTS
The Table displays the age, gender, and lifetime smoking history of lung cancer cases from the KCR. We identified a total of 54,532 lung cancer cases from 1995 to 2007. Approximately 59% were men, and two-thirds of cases were 60–79 years of age. As mentioned previously, 20.3% of cases had no smoking data, but these were assumed to be lifetime smokers for our primary analysis. The Table also displays statewide population characteristics from the BRFSS and the U.S. Census 2000 for comparison.
Table.
Characteristics of lung cancer cases in Kentucky (1995–2007) compared with the general Kentucky population (2000)a
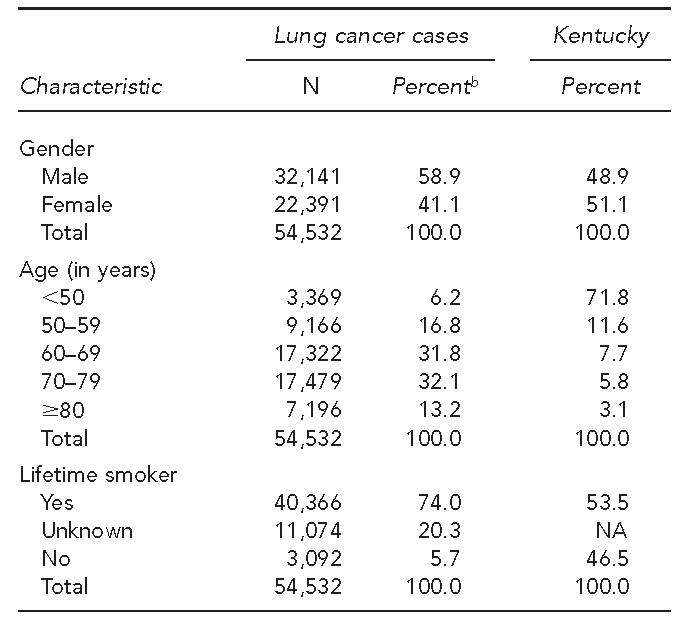
aGender and age group data for Kentucky came from the U.S. Census 2000; lifetime smoking data for Kentucky came from the 2000 Behavioral Risk Factor Surveillance System.
bPercentages may not add to 100 due to rounding.
NA = not applicable
Analysis in SaTScan indicated three high-rate lung cancer clusters with significant p-values (p<0.05), each comprising multiple counties. Figure 1 displays a map of all three high-rate clusters and their circular scan windows, as well as crude lung cancer incidence rates. Cluster 1 (p<0.01) is located in southeastern, or Appalachian, Kentucky. It includes Knott, Perry, Letcher, Floyd, Breathitt, Magoffin, Leslie, Pike, Johnson, Harlan, Martin, and Wolfe counties, with a total of 5,040 cases during the study period. The total population of the counties in this cluster was a little more than 300,000 in 2000. For residents of this area, the RR of developing lung cancer was 1.21 compared with the rest of the state.
Figure 1.
Unadjusted lung cancer incidence rates in Kentucky by county (1995–2007), with high-rate clustersa identified by spatial scan statistic
aCircles and bold outlines indicate counties in high-rate clusters.

Cluster 2 (p<0.01), comprising 1,428 cases, is also in southeastern Kentucky. Located near Cluster 1, it includes Whitley, Knox, and McCreary counties and had a combined population of 84,740 in 2000. Lung cancer incidence for this cluster (RR=1.17) was very similar to that of Cluster 1.
Cluster 3 (p=0.01), with a total of 16,444 cases during the 13-year study period, is located in north-central Kentucky. It includes 15 counties: Carroll, Trimble, Henry, Gallatin, Owen, Oldham, Grant, Boone, Shelby, Franklin, Kenton, Scott, Pendleton, Jefferson, and Campbell. This region, home to about 1.27 million residents in 2000, includes several counties in the Louisville, Kentucky, and Cincinnati, Ohio, metropolitan areas, as well as the capital of Kentucky (Frankfort). Within this region, the RR of developing lung cancer was 1.04 when compared with the rest of Kentucky.
All three alternative analyses produced results similar to those from the primary analysis, with significant or near-significant high-rate clusters in the same regions, though sometimes including fewer counties. In the Appalachian region, Breathitt, Floyd, Knott, Letcher, and Perry counties were part of a significant cluster in every analysis. These are five of the six counties wholly within the boundaries of the circular scan window for Cluster 1 (Figure 1).
We did not identify significant clusters of high lung cancer incidence centered in south-central or central Kentucky, the regions associated with high radon levels,12 or in McCracken County, where the Paducah Gaseous Diffusion Plant is located.
Figure 2 displays coal production (quintiles) per square mile by county, as well as the three lung cancer clusters we identified in the primary analysis. All of the counties in Clusters 1 and 2 produced coal, and most of them were in the two highest quintiles. Of the 15 counties in these clusters, only two were not in the top two quintiles of coal production. Similarly, 13 of 17 southeastern Kentucky counties with high coal production (top two quintiles) were included in Cluster 1 or Cluster 2. Eight of nine counties with very high coal production (top quintile) were in Cluster 1. None of the coal-mining counties in western Kentucky were part of a lung cancer cluster, and none of the counties in Cluster 3 mined any coal.
Figure 2.
Coal production among Kentucky counties (1983–2007), with high-rate clustersa identified by spatial scan statistic
aCircles and bold outlines indicate counties in high-rate clusters.

Relative to the rest of the state, access to public water service was low in the Appalachian region, and ranged from 10.4% to 61.9% among counties in Cluster 1, with <50% of households in nine of 12 counties having access to public water service. In Cluster 2, 59.9%–77.9% of households had access to public water. All counties in the Western Coal Field had public water service for at least 75% of households, with most counties offering public water service for at least 85% of households.
DISCUSSION
This exploratory analysis suggests that the very high lung cancer incidence in several southeastern Kentucky counties could be related to coal-mining activity. Furthermore, our women-only analysis suggests that the elevated lung cancer risk we found in this region does not reflect only the influence of occupational exposures, which occur primarily among men. Almost all of the counties in Clusters 1 and 2 in southeastern Kentucky produce relatively large amounts of coal, which could increase the likelihood of environmental exposures to contaminants related to the coal industry.
Environmental exposures could include airborne particulates from dust or diesel exhaust generated at mines, but exposure to trace elements is another possibility that especially warrants further investigation. Coal from the Central Appalachian region can contain a relatively high concentration of arsenic,25–27 so occupational or environmental contact with the coal, its waste products, or contaminated ground- or surface water could conceivably result in arsenic exposure. Arsenic is a well-known carcinogen associated with numerous health effects, including bladder, kidney, liver, and lung cancers.28 Because much of Appalachian Kentucky is rural, and a large majority of residents in some counties do not have public water service, future research might focus on potential exposure to arsenic and other trace elements through drinking water. An analysis of water specimens from a convenience sample of private wells in the region demonstrated that some water contained low-to-moderate concentrations of arsenic.29 Additionally, a preliminary analysis of trace elements in toenail specimens has demonstrated that some residents of the region might be exposed to moderate levels of arsenic, as well as nickel (Unpublished data. Hopenhayn C, Johnson N, Shelton B, Tucker T, Unrine J, Huang B, et al. Concentrations of arsenic, chromium, and nickel in toenail samples from Appalachian Kentucky residents. University of Kentucky 2011).
A recent study by Hendryx et al.7 similarly suggests that the prevalence of tobacco use alone cannot explain the high rate of lung cancer mortality in the rural coal-mining regions of Central Appalachia. It should be noted, however, that their study focused on mortality rather than incidence. Because it is related to survival, mortality might be influenced by many factors, including the presence of comorbid conditions and smoking status at diagnosis.30 In their study, Hendryx et al. used prevalence rates for current cigarette smoking from the BRFSS to adjust for lung cancer risk associated with tobacco use. However, this method might have led to an underestimation of lung cancer risk in areas with a high proportion of former smokers among nonsmokers, as former smokers will always have a higher risk of developing lung cancer than never-smokers. Our study addressed these limitations and, although we employed an alternative methodology, seems to confirm the findings of Hendryx et al.
Although the crude lung cancer incidence rates in Figure 2 seem to show a cluster among coal-producing counties in western Kentucky, we did not identify any significant clusters after adjusting for age, gender, and lifetime smoking prevalence. This finding might be due to differences in topography, geology, and/or mining practices that exist between the Western and Eastern Coal Fields. Exposure to coal products and wastes from western Kentucky might not present the same risks, or might not occur at all given local circumstances. For example, a closer look at the MSHA data shows that surface mining is practiced more intensely in the Eastern Coal Field. Further, the type of surface mining known as mountaintop mining with valley fill is more common in Central Appalachia, and has been noted for its potential for stream degradation.31,32 Also, access to public water systems differs substantially among regions and could play a role in exposure. The data we obtained from the Kentucky Division of Water show that most counties in Cluster 1 had fewer than 50% of households on public water systems in 2000, but more than 80% of households in the Western Coal Field had access to public water systems.
Cluster 3, while statistically significant, had only a slight increase in risk (RR=1.04) associated with it. This cluster includes many counties in the Louisville metropolitan area, including Louisville itself, as well as several counties in the Cincinnati metropolitan area. The high population and, therefore, high number of cases likely contributed to identification of this cluster, despite the slight elevation in risk, by increasing power. Nevertheless, this RR estimate could reflect greater population exposure to air pollution related to automotive transportation and/or industry, which is generally more concentrated in large metropolitan areas.13,33
Limitations
This study had several limitations. First, we relied on lifetime smoking to adjust for tobacco exposure among counties' populations. This methodology could lead to overestimation of risk in areas with lower rates of cessation, and there is some evidence indicating that Appalachian smokers are less likely to have tried to quit smoking.34 We conducted a separate analysis using current smoking rates, however, and the results were similar to what we presented from the primary analysis. Thus, we do not believe this methodology substantially influenced our findings.
Another potential limitation results from our handling of the missing data on tobacco use from the KCR. Because about 20% of cases (approximately 11,000 total) were missing information regarding cigarette use, we assumed that all of these cases were smokers. It is likely, however, that several cases were misclassified, as research has demonstrated that approximately 10% of lung cancer cases are never-smokers.20 To investigate this possibility, we conducted a separate analysis that assumed those without smoking information were nonsmokers. As noted previously, these results were not substantially different from our primary analysis.
The spatial scan statistic as a technique is also somewhat limited by its circular scan window, which might not be able to identify clusters of linear or irregular shape. SaTScan provides an elliptical scan window option that can help with the former, but we chose to run our analysis using the default settings, given the exploratory nature of this research. Regardless, we do not feel that this limitation has greatly influenced this study's findings, as it should tend to make clusters more difficult, rather than easier, to discern.
Lastly, this study was limited by a lack of direct measurement of environmental contamination within the region, or exposure to individuals who live in the region. Collecting these data is very expensive and, thus, is beyond the scope of an exploratory analysis of existing data. However, other studies have demonstrated elevated levels of arsenic and nickel in the region (Unpublished data. Hopenhayn C, Johnson N, Shelton B, Tucker T, Unrine J, Huang B, et al. Concentrations of arsenic, chromium, and nickel in toenail samples from Appalachian Kentucky residents. University of Kentucky 2011).29
CONCLUSION
This study presents suggestive evidence of a link between the coal-mining industry and lung cancer incidence in Kentucky. Future research should include collection of biological specimens (e.g., toenails, urine, and blood) and environmental samples (e.g., air, water, and soil) to determine the presence of trace elements and other lung carcinogens, detailed smoking histories to account for the prominent influence of tobacco, and other data elements reflecting the variety of potential risk factors and confounders for developing lung cancer. Furthermore, future studies should also address the possibility that exposure to relatively low levels of contaminants might be interacting with other factors to increase risk. Smoking, for example, has been shown to interact synergistically with arsenic, so that smokers are at greater risk of arsenic-related metabolic and health effects than nonsmokers.35,36 The population of Appalachian Kentucky might thus be especially sensitive to this or similar environmental exposures due to the high prevalence of heavy tobacco use.8
Footnotes
This study was funded in part by the Kentucky Lung Cancer Research Program. The authors thank Dr. Susanne Arnold and the members of the Lung Cancer Research Initiatives working group at the University of Kentucky Markey Cancer Center for their guidance and encouragement. This study was Institutional Review Board exempt.
REFERENCES
- 1.Centers for Disease Control and Prevention (US) Behavioral Risk Factor Surveillance System survey data. Atlanta: CDC; 2009. [Google Scholar]
- 2.Centers for Disease Control and Prevention (US) National Program of Cancer Registries—United States cancer statistics. [cited 2011 Mar 23]. Available from: URL: http://apps.nccd.cdc.gov/uscs.
- 3.Pollard KM. Washington: Appalachian Regional Commission; 2003. Appalachia at the millennium: an overview of results from Census 2000. [Google Scholar]
- 4.Lengerich EJ, Tucker TC, Powell RK, Colsher P, Lehman E, Ward AJ, et al. Cancer incidence in Kentucky, Pennsylvania, and West Virginia: disparities in Appalachia. J Rural Health. 2005;25:39–47. doi: 10.1111/j.1748-0361.2005.tb00060.x. [DOI] [PubMed] [Google Scholar]
- 5.Cancer death rates—Appalachia, 1994–1998. MMWR Morb Mortal Wkly Rep. 2002;51(24):527–9. [PubMed] [Google Scholar]
- 6.Wingo PA, Tucker TC, Jamison PM, Martin H, McLaughlin C, Bayakly R, et al. Cancer in Appalachia, 2001-2003. Cancer. 2008;112:181–92. doi: 10.1002/cncr.23132. [DOI] [PubMed] [Google Scholar]
- 7.Hendryx M, O'Donnell K, Horn K. Lung cancer mortality is elevated in coal-mining areas of Appalachia. Lung Cancer. 2008;62:1–7. doi: 10.1016/j.lungcan.2008.02.004. [DOI] [PubMed] [Google Scholar]
- 8.Hopenhayn C, Jenkins TM, Petrik J. The burden of lung cancer in Kentucky. J Ky Med Assoc. 2003;101:15–20. [PubMed] [Google Scholar]
- 9.Hopenhayn-Rich C, Stump ML, Browning SR. Regional assessment of atrazine exposure and incidence of breast and ovarian cancers in Kentucky. Arch Environ Contam Toxicol. 2002;42:127–36. doi: 10.1007/s002440010300. [DOI] [PubMed] [Google Scholar]
- 10.Navarro Silvera SA, Rohan TE. Trace elements and cancer risk: a review of the epidemiologic evidence. Cancer Causes Control. 2007;18:7–27. doi: 10.1007/s10552-006-0057-z. [DOI] [PubMed] [Google Scholar]
- 11.Ross MH, Murray J. Occupational respiratory disease in mining. Occup Med (Lond) 2004;54:304–10. doi: 10.1093/occmed/kqh073. [DOI] [PubMed] [Google Scholar]
- 12.Environmental Protection Agency (US) EPA map of radon zones. [cited 2010 Oct 15]. Available from: URL: http://www.epa.gov/radon/zonemap.html.
- 13.Pope CA, 3rd, Burnett RT, Thun MJ, Calle EE, Krewski D, Ito K, et al. Lung cancer, cardiopulmonary mortality, and long-term exposure to fine particulate air pollution. JAMA. 2002;287:1132–41. doi: 10.1001/jama.287.9.1132. [DOI] [PMC free article] [PubMed] [Google Scholar]
- 14.Kulldorff M. A spatial scan statistic. Communications in Statistics: Theory and Methods. 1997;26:1481–96. doi: 10.1080/03610927708831932. [DOI] [PMC free article] [PubMed] [Google Scholar]
- 15.Fang Z, Kulldorff M, Gregorio DI. Brain cancer mortality in the United States, 1986 to 1995: a geographic analysis. Neuro-Oncol. 2004;6:179–87. doi: 10.1215/S1152851703000450. [DOI] [PMC free article] [PubMed] [Google Scholar]
- 16.Pollack LA, Gotway CA, Bates JH, Parikh-Patel A, Richards TB, Seeff LC, et al. Use of the spatial scan statistic to identify geographic variations in late stage colorectal cancer in California (United States) Cancer Causes Control. 2006;17:449–57. doi: 10.1007/s10552-005-0505-1. [DOI] [PubMed] [Google Scholar]
- 17.Fukuda Y, Umezaki M, Nakamura K, Takano T. Variations in societal characteristics of spatial disease clusters: examples of colon, lung and breast cancer in Japan. Int J Health Geogr. 2005;4:16. doi: 10.1186/1476-072X-4-16. [DOI] [PMC free article] [PubMed] [Google Scholar]
- 18.National Cancer Institute (US) Surveillance, Epidemiology, and End Results. [cited 2011 Apr 4]. Available from: URL: http://seer.cancer.gov.
- 19.Centers for Disease Control and Prevention (US) Behavioral Risk Factor Surveillance System. [cited 2011 Apr 4]. Available from: URL: http://www.cdc.gov/brfss.
- 20.Alberg AJ, Ford JG, Samet JM. Epidemiology of lung cancer: ACCP evidence-based clinical practice guidelines (2nd edition) Chest. 2007;132(3 Suppl):29S–55S. doi: 10.1378/chest.07-1347. [DOI] [PubMed] [Google Scholar]
- 21.Richiardi L, Boffetta P, Simonato L, Forastiere F, Zambon P, Fortes C, et al. Occupational risk factors for lung cancer in men and women: a population-based case-control study in Italy. Cancer Causes Control. 2004;15:285–94. doi: 10.1023/B:CACO.0000024223.91059.ed. [DOI] [PubMed] [Google Scholar]
- 22.Steenland K, Loomis D, Shy C, Simonsen N. Review of occupational lung carcinogens. American J Ind Med. 1996;29:474–90. doi: 10.1002/(SICI)1097-0274(199605)29:5<474::AID-AJIM6>3.0.CO;2-M. [DOI] [PubMed] [Google Scholar]
- 23.Information Management Services Inc. SaTScan™: Version 9.0. Bethesda (MD): National Cancer Institute; 2010. [Google Scholar]
- 24.ESRI. ArcGIS: Version 9.3. Redlands (CA): ESRI; 2010. [Google Scholar]
- 25.Goldhaber MB, Lee RC, Hatch JR, Pashin JC, Treworgy J. Role of large scale fluid-flow in subsurface arsenic enrichment. In: Welch AH, Stollenwerk KG, editors. Arsenic in ground water. Norwell (MA): Kluwer Academic Publishers; 2003. pp. 127–64. [Google Scholar]
- 26.Tuttle MLW, Goldhaber MB, Ruppert LF, Hower JC. Arsenic in rocks and stream sediments of the Central Appalachian Basin, Kentucky. Washington: Geological Survey (US); 2002. [Google Scholar]
- 27.Kolker A, Huggins FE, Palmer CA, Shah N, Crowley SS, Huffman GP, et al. Mode of occurrence of arsenic in four US coals. Fuel Processing Technology. 2000;63:167–78. [Google Scholar]
- 28.Smith AH, Hopenhayn-Rich C, Bates MN, Goeden HM, Hertz-Picciotto I, Duggan HM, et al. Cancer risks from arsenic in drinking water. Environ Health Perspect. 1992;97:259–67. doi: 10.1289/ehp.9297259. [DOI] [PMC free article] [PubMed] [Google Scholar]
- 29.Shiber JG. Arsenic in domestic well water and health in Central Appalachia, USA. Water, Air, and Soil Pollution. 2005;160:327–41. [Google Scholar]
- 30.Tammemagi CM, Neslund-Dudas C, Simoff M, Kvale P. Smoking and lung cancer survival: the role of comorbidity and treatment. Chest. 2004;125:27–37. doi: 10.1378/chest.125.1.27. [DOI] [PubMed] [Google Scholar]
- 31.Palmer MA, Bernhardt ES, Schlesinger WH, Eshleman KN, Foufoula-Georgiou E, Hendryx MS, et al. Science and regulation. Mountaintop mining consequences. Science. 2010;327:148–9. doi: 10.1126/science.1180543. [DOI] [PubMed] [Google Scholar]
- 32.Hitt NP, Hendryx M. Ecological integrity of streams related to human cancer mortality rates. Ecohealth. 2010;7:91–104. doi: 10.1007/s10393-010-0297-y. [DOI] [PubMed] [Google Scholar]
- 33.Cohen AJ, Pope CA., 3rd Lung cancer and air pollution. Environ Health Perspect. 1995;103(Suppl 8):219–24. doi: 10.1289/ehp.95103s8219. [DOI] [PMC free article] [PubMed] [Google Scholar]
- 34.Christian WJ, Hopenhayn C. Early stage lung cancer survival in Kentucky: associations with smoking history and Appalachian geography. J Ky Med Assoc. 2010;108:97–105. [Google Scholar]
- 35.Hopenhayn-Rich C, Biggs ML, Smith AH, Kalman DA, Moore LE. Methylation study of a population environmentally exposed to arsenic in drinking water. Environ Health Perspect. 1996;104:620–8. doi: 10.1289/ehp.96104620. [DOI] [PMC free article] [PubMed] [Google Scholar]
- 36.Hertz-Picciotto I, Smith AH, Holtzman D, Lipsett M, Alexeeff G. Synergism between occupational arsenic exposure and smoking in the induction of lung cancer. Epidemiology. 1992;3:23–31. doi: 10.1097/00001648-199201000-00006. [DOI] [PubMed] [Google Scholar]