The prevalence of obesity among children and adolescents has increased threefold between 1980 and 2002, with prevalence rates of up to 17.1% being reported.1–3 Explanatory hypotheses for such a change are multifactorial and include changes in diet and physical activity. High priority should be placed on determining environmental factors that may contribute to this epidemic of childhood obesity.
One environmental topic that has received recent attention in the literature is the effect of local food sources on obesity.4–9 There is supporting evidence for an association between body mass index (BMI) and local food sources. Recent research focusing on children and adolescents provides supporting evidence for an association between body mass index (BMI) and local food sources. In East Harlem, New York, Galvez et al. found that having more than one convenience store in a 6- to 8-year-old child's census block group correlated to higher BMI.10 Oreskovic et al. found that the density of fast-food outlets was positively associated with obesity in Massachusetts children.11 Americans are eating out of the home more often, with potential negative consequences depending on their food source choices.12 Teens use fast-food outlets twice a week on average.13 Fast-food outlets pose a risk because they stock less healthy foods;14–16 eating fast food is associated with higher calories, fat, and sodium;17 and the frequency of an individual's fast-food intake is inversely associated with an individual's fruit and vegetable intake.18 In a study of low socioeconomic status (SES) urban students, it was found that purchases from the urban corner convenience store were energy-dense with poor nutritive value.19
Despite these studies indicating a relationship between the food environment and obesity and unhealthy eating, several other studies have not found evidence for spatial proximity to food sources as a risk factor for obesity.20–24 In a study in Cincinnati, Ohio, Burdette and Whitaker found the distance between the child's residence and fast-food restaurants was not related to obesity status for 3- to 5-year-olds.20 In a four-year longitudinal study, Sturm and Datar found no association between BMI and the density of four food source categories: groceries, convenience stores, fast-food restaurants, or sit-down restaurants.22 Jeffery and colleagues found that proximity to fast-food restaurants was not associated with BMI or eating at these restaurants.23 Counter to many other studies, Crawford et al. showed that obesity increased with greater distance to the nearest fast-food outlet and diminished if there was at least one fast-food outlet within two kilometers of the residence.24 Low SES has been associated with higher rates of obesity,8,11,22,25–30 less availability of supermarkets, and higher densities of both fast-food outlets and convenience stores.11,16,21,31–43
The built environment may also influence obesity through how well it supports physical activity; however, this influence has not been established.44–49 Many urban environments do not allow for safe outdoor activities due to traffic or crime.50–52 Low-income built environments have been found to have less open space.11 Liu et al. found in a cross-sectional analysis of 3- to 18-year-olds that increased neighborhood green space was correlated with a decreased risk for overweight status in high-population environments.53
Spatial analysis techniques for investigating the built environment have improved greatly in the past two decades.54–62 Geographic information systems (GIS) allow for a visual exploration of environmental factors that influence health by providing digital maps. Spatial statistical software can be used to evaluate spatial relationships among health-related variables in the built environment.
The objective for this study was to analyze the relationship between characteristics of the local built environment, including food environment and open space, with BMI of students in kindergarten through 12th grade in an urban, multiethnic population. This study was undertaken to further assess whether there are significant relationships between the density and quality of a wide array of food sources in urban settings where obesity has an especially high prevalence, a debate that has not yet been settled.
We hypothesized that the density of convenience stores/bodegas, fast-food outlets, and sit-down restaurants would be positively correlated to BMI, controlling for sociodemographic variables. We also postulated that lower SES would be directly correlated and open space inversely correlated with BMI.
METHODS
Data sources
Student database.
Upon Institutional Review Board approval from Baystate Medical Center, a multiethnic sample of 10,513 urban students from Springfield, Massachusetts, in kindergarten through 12th grade who had heights and weights measured by school nurses during the 2005–2006 school year were entered into the study. Students were measured in all schools, with the priority given to measure students in kindergarten through fourth grade, seventh-grade students, and 10th-grade students. Students in other grades would be measured if resources were available.
The nurse measured students by classroom without any selection criteria based on obesity status or demographic characteristics. Because of the priority for certain grades, limited nursing resources, and student absenteeism, the number of students (n=10,513) in the sample was actually lower than the number of total school district students (n=25,792). To address this issue, we explored the grade-level distribution of students enrolled in the sample. Also, using the Chi-square test, we compared demographics of sample students—including SES (based on proportion enrolled in the National School Lunch Program [NSLP]), gender, and racial distribution—with demographics of students not enrolled (n=15,279) in the sample.
The school database contains the student's age, gender, race/ethnicity, grade, status of enrollment in NSLP (i.e., free, full-price, or reduced-price lunch), and mode of transportation to school (e.g., walk to school, walk to bus stop, door-to-door transportation, or private). We calculated age- and gender-standardized BMI z-scores using Centers for Disease Control and Prevention (CDC) growth charts.63
Food source database.
We created a local food source database from the 2006 Yellow Pages, the Springfield Public Health Department, and the Internet. Food sources were categorized empirically into sit-down restaurants, fast-food outlets, convenience/bodega stores, and supermarkets/produce markets based on name and classification found in the data source using criteria described in the literature.64,65
Census-tract and land-use maps.
Geographic boundaries and attributes of U.S. Census tracts were obtained from the 2000 U.S. Census.66 Springfield geographic land-use designations were obtained from the Massachusetts GIS.67,68
Map creation for study variables
Shapefiles.
We used ArcMap®69 to integrate information from the various data sources described previously to create digital map layers for each variable by census tract (n=35). These map layers or shapefiles can be graphically displayed in ArcMap or statistically analyzed using the data table that is embedded.61,70
Study variables.
Student database variables were aggregated based on the census tract of the student's home addresses. For each census tract in this study, the mean BMI z-score for students living in the census tract (BMI-Z-CT) was the dependent variable. Main independent variables by census tract included food source count in a quarter-mile radius from student's residence averaged for the census tract, and the proportion of open space in the census tract. Open space was defined as a land-use designation of forest, wetland, recreation area, spectator recreation, water-based recreation, low-density housing (>0.25-acre lots for homes), park, or green space. Demographic variables of the students included mean age and proportion of students in the census tract by race/ethnicity, gender, enrollment in free or reduced-price NSLP, and mode of transportation to school. Census 2000 population-based median household income and high school/college graduation rate information were also included for analysis by census tract.
Exploratory geographic analysis
We used GeoDa®71,72 spatial statistical software for exploratory spatial analysis. Quartile box maps were made for all the main study variables and inspected for trends, patterns, and outliers.70 Next, local indicators of spatial association (LISA), as described by Anselin,73 were displayed to determine if statistically significant clustering existed for variables.
Regression analysis
To determine the strength of association between the local food environment and open space to BMI, we employed ordinary least squares (OLS) linear regression with spatial diagnostics for all census tracts using methods described by Anselin.72 We conducted univariate logistic regression using GeoDa to select candidates for multivariate analysis. Variables with a significance level <0.1 were selected as candidates for the multivariate logistic regression. Then, using SPSS® version 16,74 we performed a two-block hierarchical multiple regression analysis.62 We conducted this regression to assess the hypothesized built environment variables controlling for literature-based risk factors. Therefore, block one contained sociodemographic risk factors for obesity, including proportion of students by census tract who were from a racial/ethnic minority group, enrolled in free or reduced-price NSLP, and high school graduates. We also included the median household income by census tracts. Block two contained the built environment variables, including food source densities and open space. As described by Agresti and Finlay,75 in cases where multicollinearity was found among variables, composite variables were created using either standardized z-scores for variables of different scale (e.g., household income and proportion of students who were high school graduates by census tract) or by summing over similar food source categories.
Finally, we compared the final best model derived from this method with systematic stepwise and backward regression using all variables. When several models were compared, the model with the lowest Akaike's Information Criterion (AIC) was chosen. AIC is a measure of how well a regression model fits. This measure provides a means for selecting the best model among alternative models.76
Regression diagnostics
Using GeoDa, we performed testing for spatial dependence of regression residuals, which, when present, can challenge the assumption of independence in regression analysis.77 Other diagnostics performed included the usual testing of regression for normality of errors, heteroskedasticity, and multicollinearity.70,77,78
RESULTS
Descriptive statistics
Student data.
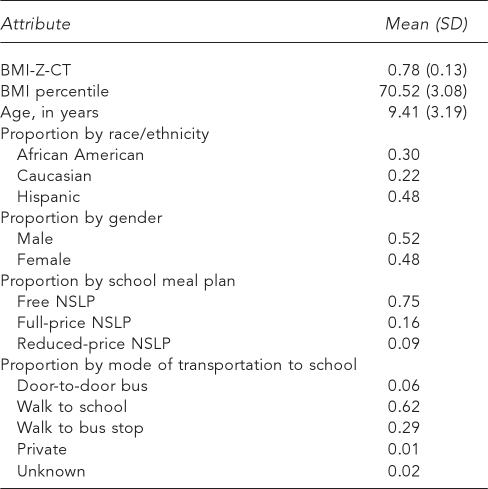
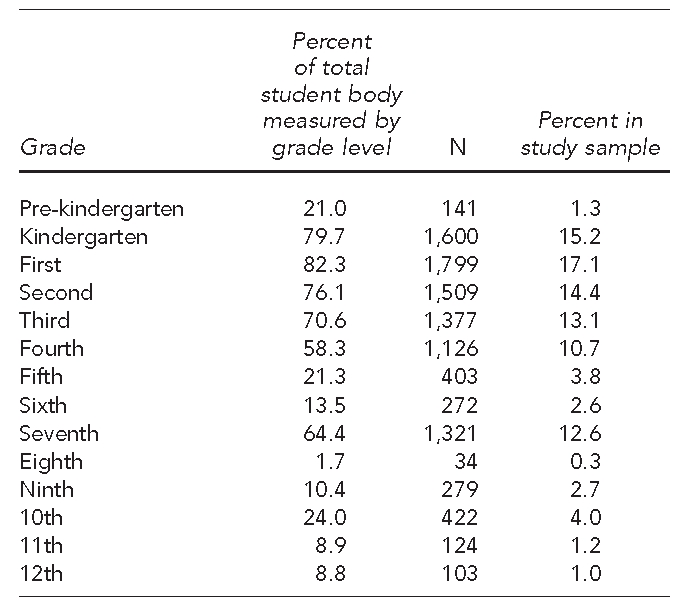
The demographics of this low SES, predominantly minority sample are presented in Table 1. Given the priority to measure students in lower grades, there was a higher proportion of sample students from lower grades, with only 9.2% of the sample being drawn from grades eight through 12 (Table 2). There was no difference in enrollment in free NSLP, which is a measure of SES, between the students enrolled in the sample (i.e., those who had their BMI measured) and those not enrolled in the sample (i.e., those who did not have their BMI measured). As compared with those who were not in the sample, the sample included a slightly lower percentage of Hispanic people, slightly higher percentage of African Americans, and slightly higher percentage of Caucasians; however, there were no gender differences (Table 3).
Table 1.
Demographic characteristics of students in kindergarten through 12th grade who had their BMI measured (n=10,513): Springfield, Massachusetts, 2005–2006
BMI = body mass index
SD = standard deviation
BMI-Z-CT = BMI z-score of students living in census tract
NSLP = National School Lunch Program
Table 2.
Percentage of students who had their BMI measured, by grade level, in Springfield, Massachusetts, 2005–2006
BMI = body mass index
Table 3.
Comparison of demographic characteristics for those students who had their BMI measured (those enrolled in the study) vs. those who did not get their BMI measured (those not enrolled in the study): Springfield, Massachusetts, 2005–2006
BMI = body mass index
NSLP = National School Lunch Program
Food sources.
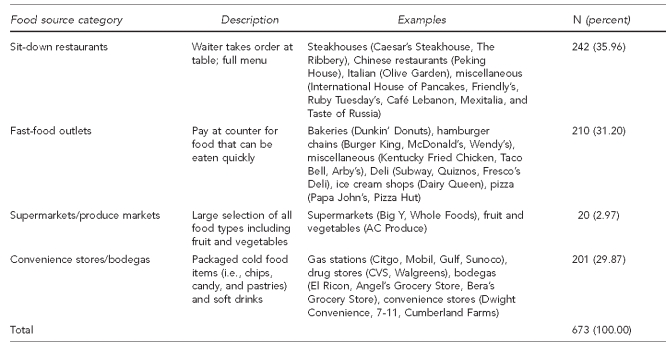
There were similar overall proportions of sit-down restaurants (36%), fast-food outlets (31%), and convenience stores/bodegas (30%). The percentage of food sources in the supermarkets/produce markets category (3%) was low (Table 4).
Table 4.
Food source categories (n=673) in Springfield, Massachusetts, 2005–2006
BMI = body mass index
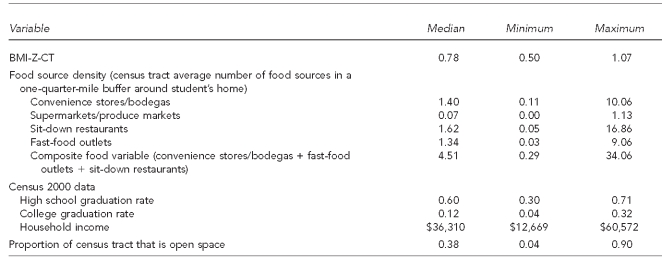
Census-tract descriptive data, including student BMI-Z-CT, food source density, and open space, are presented in Table 5. The census-tract median values for food source density (i.e., the census-tract average number of food sources in a one-quarter-mile buffer around the student's home) was higher for sit-down restaurants (1.62) than for convenience stores/bodegas (1.40) or fast-food outlets (1.34), and lower for supermarkets/produce markets (0.07). The proportion of open space varied from 0.04 to 0.90. The Census 2000 median household income ($36,310) and education level (0.60 high school graduation rate and 0.12 college graduation rate) noted for the area were low.
Table 5.
Data by census tract in a sample of students who had their BMI measured (n=35 census tracts) in Springfield, Massachusetts, 2005–2006
BMI = body mass index
BMI-Z-CT = BMI z-score of students living in census tract
Exploratory analysis
BMI.
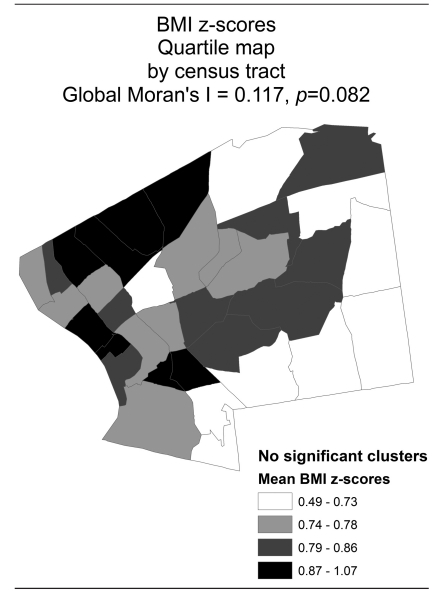
Quartile box maps displayed higher values of BMI-Z-CT in the western and northern parts of the city and lower values in the southeastern part of the city. LISA maps, however, did not reveal statistically significant clustering (Figure 1).
Figure 1.
Quartile box map of mean standardized BMI z-scores for students living in census tracts with clusters found by local indicators of spatial association tests: Springfield, Massachusetts, 2005–2006a
aThe insignificant Moran's I indicates no clustering.
BMI = body mass index
Food sources and open space.
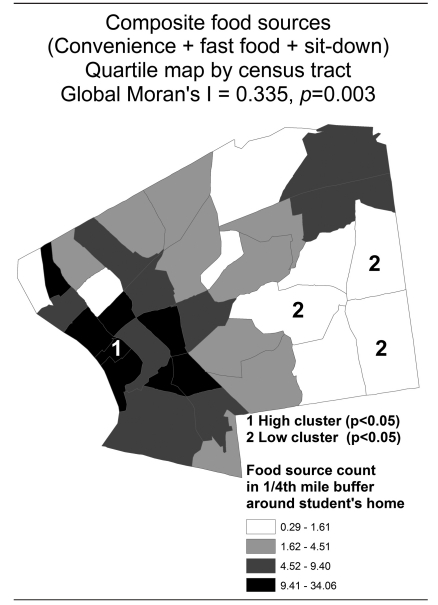
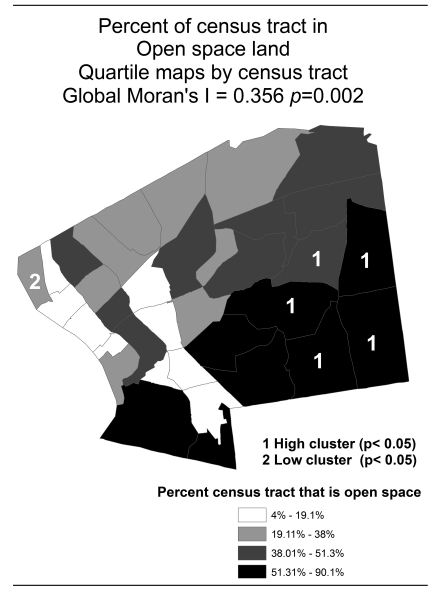
On quartile box map inspection, there were high-density clusters of food sources in the western part of the city and lower-density clusters in the southeastern part of the city (Figure 2). This pattern was opposite to that of open space, which had high-density clusters apparent in the eastern part of the city and lower-density clusters in the western part of the city (Figure 3). LISA maps confirmed statistically what was visually found on the quartile box maps for these two variables.
Figure 2.
Quartile box map of composite food sources (sum of convenience stores/bodegas, fast-food outlets, and sit-down restaurants) with clusters found by local indicators of spatial association tests: Springfield, Massachusetts, 2005–2006a
aNote the high clusters of food sources found in the western region and low clusters found in the eastern region.
Figure 3.
Quartile box map of open space with clusters found by local indicators of spatial association significance test in a study of students who had their BMI measured in Springfield, Massachusetts, 2005–2006a
aNote the cluster of open space found in eastern Springfield.
Demographics.
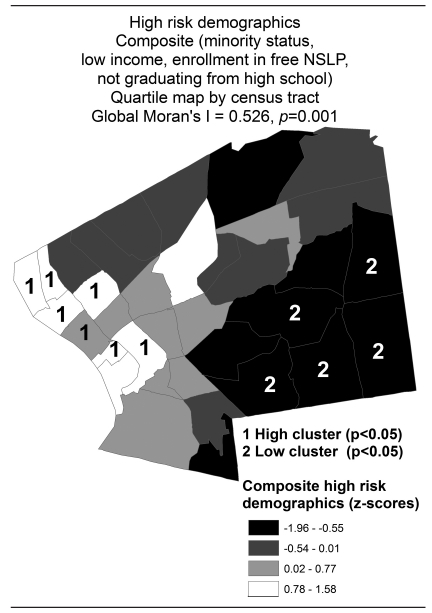
Figure 4 illustrates the spatial pattern of the composite high-risk covariate, which included proportion of racial/ethnic minority students by census tract, proportion enrolled in free NSLP, lower high school graduation rates, and lower median household income, and was found to be higher in the western part of the city than in the eastern part of the city on quartile box maps and LISA statistical analysis.
Figure 4.
Quartile box map of composite high-risk covariate with clusters found by local indicators of spatial association significance test in a study of students who had their BMI measured in Springfield, Massachusetts, 2005–2006a
aThe western part of the city has a cluster of high-risk demographics including low income, minority status, enrollment in free lunch, and low high school graduation rates.
BMI = body mass index
NSLP = National School Lunch Program
Regression
Univariate OLS regression showed that BMI was significantly associated with density of fast-food outlets (β=0.537, p=0.001), sit-down restaurants (β=0.529, p=0.001), and convenience stores/bodegas (β=0.535, p=0.001). Open space in the census tract had a negative association (β=−0.408, p=0.015) with BMI-Z-CT. BMI-Z-CT was associated with the proportion of racial/ethnic minority students in the census tract (β=0.344, p=0.043) and enrollment in free NSLP (β=0.463, p=0.005). Spatially, there was a statistically significant negative trend of BMI-Z-CT going from west to east, indicating regional spatial variation (β=−0.530, p=0.001). Census-tract high school graduation rates (β=−0.292, p=0.089) and median household income (β=−0.331, p=0.052) approached statistical significance for a negative relationship with BMI-Z-CT (Table 6). Age, gender, mode of transportation to school, supermarkets/produce markets, and college graduation rates of census tract were not related to BMI-Z-CT (data not shown).
Table 6.
Significant univariate ordinary least squares regression models of BMI-Z-CT with spatial diagnostics in a sample of students who had their BMI measured in Springfield, Massachusetts, 2005–2006
aSignificant at p≤0.001
bSignificant at p≤0.05
cSignificant at p≤0.01
dDiagnostics for spatial dependence, normality of errors, and heteroskedasticity were met for all variables with one exception: spatial dependence was found for high school graduation.
BMI-Z-CT = BMI z-score of students living in census tract
BMI = body mass index
NSLP = National School Lunch Program
We performed hierarchical multiple regression for all census tracts. Because significant multicollinearity existed among covariates, we created a composite high-risk covariate term for each census tract. This term was calculated by summing (1) standardized values for the proportion of students in the census tract who were of a minority racial/ethnic group and (2) standardized values for the proportion of students in census tract enrolled in free or reduced-price NSLP and subtracting (3) standardized values for the proportion of students in the census tract who were high school graduates and (4) standardized values for median census-tract household income. When entered into block one of the regression model, this composite high-risk covariate term showed a positive relationship to BMI-Z-CT that was significantly different from zero (β=0.379, p=0.025) (Table 6).
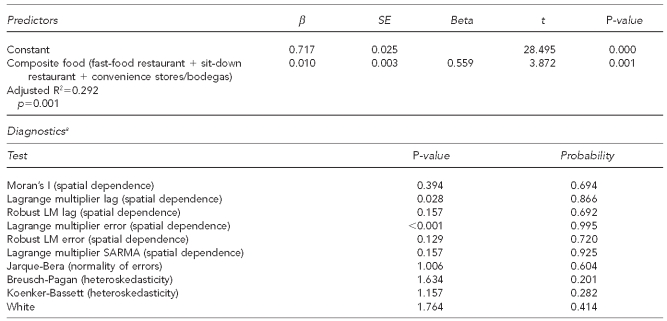
In block two, food source categories were added one at a time and the model was assessed controlling for the composite high-risk covariate term. Convenience stores/bodegas (β=0.482, p=0.004), fast-food outlets (β=0.458, p=0.002), and sit-down restaurants (β=0.450, p=0.003) were significantly related to BMI-Z-CT. When all three categories of food sources were entered into block two together, there was no statistical significance added to the model. That is, each food source category, when controlling for the other two food source categories, did not have a statistically significant relationship to BMI-Z-CT. We then created a composite food source variable consisting of the sum of convenience stores/bodegas, fast-food outlets, and sit-down restaurants and, when placed in the model, it significantly improved the equation (β=0.559, p=0.001) (Table 6) and overall was the best prediction model (Table 7). This finding was confirmed using systematic stepwise and forward regression of all predictor variables. The three food source variables comprising the composite food source variable were examined for interaction effect. However, we found no statistically significant coefficients for the interaction variables.
Table 7.
Final ordinary least squares model with diagnostics in a sample of students who had their BMI measured: Springfield, Massachusetts, 2005–2006
aDiagnostics indicate no spatial dependence, normality of errors, and absence of heteroskedasticity.
BMI = body mass index
LM = Lagrange multiplier
SARMA = seasonal autoregressive moving average
Open space did not remain a significant predictor of BMI-Z-CT when controlling for the high-risk -covariate. This composite high-risk covariate, in turn, did not remain significant when food source categories were entered.
Diagnostic testing performed in GeoDa revealed no spatial dependence for the best prediction model (Table 7). As described by Anselin, this finding precluded further spatial regression analysis.72 Also, we found normality of errors and no heteroskedasticity.
DISCUSSION
This study employed GIS technology and spatial analysis tools to evaluate the relationship between the local food environment and open space to urban students' aggregate BMI-Z-CT. Student BMI z-scores were associated with the density of convenience stores, fast-food outlets, and sit-down restaurants, as well as a composite variable of the three food sources. This association was found even after controlling for high-risk covariates such as income, racial/ethnic minority group status, enrollment in free or reduced-price NSLP, and rates of high school graduation. Although open space was found to have a significant negative relationship to BMI on single-model regression, this relationship was not evident when controlling for demographic variables.
This study provides a more complete analysis of the relationship between the built environment and childhood obesity than most existing studies. Variables such as student demographics, geographic open space, and all major food source categories were included in the analysis. This spectrum of predictors is not found in many of the other studies of environmental predictors of childhood obesity. The finding that sit-down restaurants were associated with higher childhood BMI is novel, and the association between convenience stores and fast-food outlets with higher BMI in children confirms the findings of other studies in children.10,11 It appears that living near fast-food outlets, convenience stores, and sit-down restaurants may be a factor associated with the obesity epidemic in U.S. cities. This study specifically provides support to the efforts of First Lady Michelle Obama's program to improve the quality of food served at restaurants.
The finding that open space did not relate to BMI when controlling for demographics is interesting, as at first it seems to contradict the study by Liu et al.,53 in which green space as measured by satellite imagery was associated with lower BMI in children living in high but not low population density regions. This complex relationship has been found by other research where diversity of land use, increased residential density, and connectivity of streets that contributed to the walkability of a community was associated with more physical activity.78–80 However, the open-space variable used in our study included a combination of the typical green-space land characteristics (e.g., forest and parks) plus an additional lower population density category. Thus, it is likely that the addition of this low-density housing led to a loss of the relationship and is actually consistent with the findings of Liu and colleagues.
In this study, the quartile box maps and LISA statistics provide added insight into the nature of the built environment that cannot be provided by nonspatial analysis alone. Specifically, the geographic clustering of food source density, minority status, and enrollment in free NSLP in the western region and open space, higher income, and high school graduation in the eastern region paints a picture of Springfield as a city of disparities.
Strengths and limitations
This study had two strengths. First, the use of spatial regression provided for more accurate analysis than what is traditionally reported in ecological analysis.81 Second, this study provided digital maps of the food environment for an urban region that can be used for further study.
This study also had several limitations. For one, the sample population included in this study was not drawn randomly and comprised 41% of the total school district population. The predominance of students in lower grade levels who had their BMI measured and were entered into the sample may have reduced the generalizability of this study to students in higher grade levels. There were no socioeconomic or gender differences between the sample and the non-enrolled students. Although differences in racial/ethnic distribution were noted, with a slightly higher proportion of African Americans and Caucasians and a slightly lower proportion of Hispanic people in the sample when compared with the unmeasured group, the magnitude of the differences was small. Therefore, the similarity of those in the sample and those not in the sample minimized the issue of selection bias regarding these major characteristics.
Also, because the level of the analysis was the census tract, individual student behavior could not be evaluated.82 Furthermore, the food sources were categorized empirically based on name and category listed in the Yellow Pages and on the Internet. Although the categories were likely accurate, this method of categorizing was not as reliable as actually visiting and assessing each food source, as has been described in the literature.64,65,83 Finally, this ecological study design did not establish the local food source environment as a causative factor in higher childhood BMI.
CONCLUSION
In summary, in this study of urban students in kindergarten through 12th grade, we found a density of sit-down restaurants, convenience/bodega stores, and fast-food outlets to be associated with BMI z-scores. This finding supports the evidence that the type and density of food sources are associated with elevated BMI z-scores in predominantly poor racial/ethnic minority children living in urban environments.
Footnotes
This research was supported by Baystate Children's Hospital, Children's Miracle Network. Institutional Review Board approval was given by the Baystate Medical Center.
REFERENCES
- 1.Ogden CL, Flegal KM, Carroll MD, Johnson CL. Prevalence and trends in overweight among U.S. children and adolescents: 1999–2000. JAMA. 2002;288:1728–32. doi: 10.1001/jama.288.14.1728. [DOI] [PubMed] [Google Scholar]
- 2.Hedley AA, Ogden CL, Johnson CL, Carroll MD, Curtin LR, Flegal KM. Prevalence of overweight and obesity among U.S. children, adolescents, and adults, 1999–2002. JAMA. 2004;291:2847–50. doi: 10.1001/jama.291.23.2847. [DOI] [PubMed] [Google Scholar]
- 3.Ogden CL, Carroll MD, Curtin LR, McDowell MA, Tabak CJ, Flegal KM. Prevalence of overweight and obesity in the United States, 1999–2004. JAMA. 2006;295:1549–55. doi: 10.1001/jama.295.13.1549. [DOI] [PubMed] [Google Scholar]
- 4.Holsten JE. Obesity and the community food environment: a systematic review. Public Health Nutr. 2009;12:397–405. doi: 10.1017/S1368980008002267. [DOI] [PubMed] [Google Scholar]
- 5.Sallis JF, Glanz K. The role of built environments in physical activity, eating, and obesity in childhood. Future Child. 2006;16:89–108. doi: 10.1353/foc.2006.0009. [DOI] [PubMed] [Google Scholar]
- 6.Giskes K, Kamphuis CB, van Lenthe FJ, Kremers S, Droomers M, Brug J. A systematic review of associations between environmental factors, energy and fat intakes among adults: is there evidence for environments that encourage obesogenic dietary intakes? Public Health Nutr. 2007;10:1005–17. doi: 10.1017/S1368980007665525. [DOI] [PubMed] [Google Scholar]
- 7.Sallis JF, Glanz K. Physical activity and food environments: solutions to the obesity epidemic. Milbank Q. 2009;87:123–54. doi: 10.1111/j.1468-0009.2009.00550.x. [DOI] [PMC free article] [PubMed] [Google Scholar]
- 8.Wang MC, Kim S, Gonzalez AA, MacLeod KE, Winkleby MA. Socioeconomic and food-related physical characteristics of the neighbourhood environment are associated with body mass index. J Epidemiol Community Health. 2007;61:491–8. doi: 10.1136/jech.2006.051680. [DOI] [PMC free article] [PubMed] [Google Scholar]
- 9.Simmons D, McKenzie A, Eaton S, Cox N, Khan MA, Shaw J, et al. Choice and availability of takeaway and restaurant food is not related to the prevalence of adult obesity in rural communities in Australia. Int J Obes (Lond) 2005;29:703–10. doi: 10.1038/sj.ijo.0802941. [DOI] [PubMed] [Google Scholar]
- 10.Galvez MP, Hong L, Choi E, Godbold J, Brenner B. Childhood obesity and neighborhood food-store availability in an inner-city community. Acad Pediatr. 2009;9:339–43. doi: 10.1016/j.acap.2009.05.003. [DOI] [PMC free article] [PubMed] [Google Scholar]
- 11.Oreskovic NM, Kuhlthau KA, Romm D, Perrin JM. Built environment and weight disparities among children in high- and low-income towns. Acad Pediatr. 2009;9:315–21. doi: 10.1016/j.acap.2009.02.009. [DOI] [PubMed] [Google Scholar]
- 12.Kant AK, Graubard BI. Eating out in America, 1987–2000: trends and nutritional correlates. Prev Med. 2004;38:243–9. doi: 10.1016/j.ypmed.2003.10.004. [DOI] [PubMed] [Google Scholar]
- 13.Paeratakul S, Ferdinand DP, Champagne CM, Ryan DH, Bray GA. Fast-food consumption among U.S. adults and children: dietary and nutrient intake profile. J Am Diet Assoc. 2003;103:1332–8. doi: 10.1016/s0002-8223(03)01086-1. [DOI] [PubMed] [Google Scholar]
- 14.Wang MC, Cubbin C, Ahn D, Winkleby MA. Changes in neighbourhood food store environment, food behavior and body mass index, 1981–1990. Public Health Nutr. 2008;11:963–70. doi: 10.1017/S136898000700105X. [DOI] [PMC free article] [PubMed] [Google Scholar]
- 15.Jetter KM, Cassady DL. The availability and cost of healthier food alternatives. Am J Prev Med. 2006;30:38–44. doi: 10.1016/j.amepre.2005.08.039. [DOI] [PubMed] [Google Scholar]
- 16.Horowitz CR, Colson KA, Hebert PL, Lancaster K. Barriers to buying healthy foods for people with diabetes: evidence of environmental disparities. Am J Public Health. 2004;94:1549–54. doi: 10.2105/ajph.94.9.1549. [DOI] [PMC free article] [PubMed] [Google Scholar]
- 17.Schmidt M, Affenito SG, Striegel-Moore R, Khoury PR, Barton B, Crawford P, et al. Fast-food intake and diet quality in black and white girls. Arch Pediatr Adolesc Med. 2005;159:626–31. doi: 10.1001/archpedi.159.7.626. [DOI] [PubMed] [Google Scholar]
- 18.Befort C, Kaur H, Nollen N, Sullivan DK, Nazir N, Choi WS, et al. Fruit, vegetable and fat intake among non-Hispanic black and non-Hispanic white adolescents: associations with home availability and food consumption settings. J Am Diet Assoc. 2006;106:367–73. doi: 10.1016/j.jada.2005.12.001. [DOI] [PubMed] [Google Scholar]
- 19.Borradaile KE, Sherman S, Vander Veur SS, McCoy T, Sandoval B, Nachmani J, et al. Snacking in children: the role of urban corner stores. Pediatrics. 2009;124:1293–8. doi: 10.1542/peds.2009-0964. [DOI] [PubMed] [Google Scholar]
- 20.Burdette HL, Whitaker RC. Neighborhood playgrounds, fast food restaurants, and crime: relationships to overweight in low-income preschool children. Prev Med. 2004;38:57–63. doi: 10.1016/j.ypmed.2003.09.029. [DOI] [PubMed] [Google Scholar]
- 21.Powell LM, Slater S, Mirtcheva D, Bao Y, Chaloupka FJ. Food store availability and neighborhood characteristics in the United States. Prev Med. 2007;44:189–95. doi: 10.1016/j.ypmed.2006.08.008. [DOI] [PubMed] [Google Scholar]
- 22.Sturm R, Datar A. Body mass index in elementary school children, metropolitan area food prices and food outlet density. Public Health. 2005;119:1059–68. doi: 10.1016/j.puhe.2005.05.007. [DOI] [PubMed] [Google Scholar]
- 23.Jeffery RW, Baxter J, McGuire M, Linde J. Are fast food restaurants an environmental risk factor for obesity? Int J Behav Nutr Phys Act. 2006;3:2. doi: 10.1186/1479-5868-3-2. [DOI] [PMC free article] [PubMed] [Google Scholar]
- 24.Crawford DA, Timperio AF, Salmon JA, Baur L, Giles-Corte B, Roberts RJ, et al. Neighborhood fast food outlets and obesity in children and adults: the CLAN Study. Int J Pediatr Obes. 2008;3:249–56. doi: 10.1080/17477160802113225. [DOI] [PubMed] [Google Scholar]
- 25.Vieweg VR, Johnston CH, Lanier JO, Fernandez A, Pandurangi AK. Correlation between high risk obesity groups and low socioeconomic status in school children. South Med J. 2007;100:8–13. doi: 10.1097/01.smj.0000253479.03665.6f. [DOI] [PubMed] [Google Scholar]
- 26.Inagami S, Cohen DA, Finch BK, Asch SM. You are where you shop: grocery store locations, weight, and neighborhoods. Am J Prev Med. 2006;31:10–7. doi: 10.1016/j.amepre.2006.03.019. [DOI] [PubMed] [Google Scholar]
- 27.Black JL, Macinko J. Neighborhoods and obesity. Nutr Rev. 2008;66:2–20. doi: 10.1111/j.1753-4887.2007.00001.x. [DOI] [PubMed] [Google Scholar]
- 28.Schlundt DG, Hargreaves MK, McClellan L. Geographic clustering of obesity, diabetes, and hypertension in Nashville, Tennessee. J Ambul Care Manage. 2006;29:125–32. doi: 10.1097/00004479-200604000-00005. [DOI] [PubMed] [Google Scholar]
- 29.Drewnowski A, Rehm CD, Solet D. Disparities in obesity rates: analysis by ZIP code area. Soc Sci Med. 2007;65:2458–63. doi: 10.1016/j.socscimed.2007.07.001. [DOI] [PMC free article] [PubMed] [Google Scholar]
- 30.Kandris S, Liu G. Indianapolis: The Polis Center at Indiana University-Purdue University at Indianapolis; 2003. Indianapolis site-specific neighborhood health analysis: environmental factors and risk of childhood obesity. [Google Scholar]
- 31.Ford PB, Dzewaltowski DA. Disparities in obesity prevalence due to variation in the retail food environment: three testable hypotheses. Nutr Rev. 2008;66:216–28. doi: 10.1111/j.1753-4887.2008.00026.x. [DOI] [PubMed] [Google Scholar]
- 32.Beaulac J, Kristjansson E, Cummins S. A systematic review of food deserts, 1966–2007. Prev Chronic Dis. 2009;6:A105. [PMC free article] [PubMed] [Google Scholar]
- 33.Pearce J, Blakely T, Witten K, Bartie P. Neighborhood deprivation and access to fast-food retailing. Am J Prev Med. 2007;32:375–82. doi: 10.1016/j.amepre.2007.01.009. [DOI] [PubMed] [Google Scholar]
- 34.Morland K, Wing S, Diez Roux A, Poole C. Neighborhood characteristics associated with the location of food stores and food service places. Am J Prev Med. 2002;22:23–9. doi: 10.1016/s0749-3797(01)00403-2. [DOI] [PubMed] [Google Scholar]
- 35.Algert SJ, Agrawal A, Lewis DS. Disparities in access to fresh produce in low-income neighborhoods in Los Angeles. Am J Prev Med. 2006;30:365–70. doi: 10.1016/j.amepre.2006.01.009. [DOI] [PubMed] [Google Scholar]
- 36.Cummins SC, McKay L, MacIntyre S. McDonald's restaurants and neighborhood deprivation in Scotland and England. Am J Prev Med. 2005;29:308–10. doi: 10.1016/j.amepre.2005.06.011. [DOI] [PubMed] [Google Scholar]
- 37.Powell LM, Chaloupka FJ, Bao Y. The availability of fast-food and full-service restaurants in the United States: associations with neighborhood characteristics. Am J Prev Med. 2007;33(4 Suppl):S240–5. doi: 10.1016/j.amepre.2007.07.005. [DOI] [PubMed] [Google Scholar]
- 38.Block JP, Scribner RA, DeSalvo KB. Fast food, race/ethnicity, and income. Am J Prev Med. 2004;27:211–7. doi: 10.1016/j.amepre.2004.06.007. [DOI] [PubMed] [Google Scholar]
- 39.Lewis LB, Sloane DC, Nascimento LM, Diamant AL, Guinyard JJ, Yancey AK, et al. African Americans' access to healthy food options in South Los Angeles restaurants. Am J Public Health. 2005;95:668–73. doi: 10.2105/AJPH.2004.050260. [DOI] [PMC free article] [PubMed] [Google Scholar]
- 40.Franco M, Diez Roux A, Glass TA, Caballero B, Brancati FL. Neighborhood characteristics and availability of healthy foods in Baltimore. Am J Prev Med. 2008;35:561–7. doi: 10.1016/j.amepre.2008.07.003. [DOI] [PMC free article] [PubMed] [Google Scholar]
- 41.Moore LV, Diez Roux AV. Associations of neighborhood characteristics with the location and type of food stores. Am J Public Health. 2006;96:325–31. doi: 10.2105/AJPH.2004.058040. [DOI] [PMC free article] [PubMed] [Google Scholar]
- 42.Morland K, Wing S, Diez Roux AV. The contextual effect of the local food environment on residents' diets: the atherosclerosis risk in communities study. Am J Public Health. 2002;92:1761–7. doi: 10.2105/ajph.92.11.1761. [DOI] [PMC free article] [PubMed] [Google Scholar]
- 43.Zenk SN, Schulz AJ, Israel BA, James SA, Bao S, Wilson ML. Neighborhood racial composition, neighborhood poverty, and the spatial accessibility of supermarkets in metropolitan Detroit. Am J Public Health. 2005;95:660–7. doi: 10.2105/AJPH.2004.042150. [DOI] [PMC free article] [PubMed] [Google Scholar]
- 44.Abercrombie LC, Sallis JF, Conway TL, Frank LD, Saelens BE, Chapman JE. Income and racial disparities in access to public parks and private recreation facilities. Am J Prev Med. 2008;34:9–15. doi: 10.1016/j.amepre.2007.09.030. [DOI] [PubMed] [Google Scholar]
- 45.Crawford D, Timperio A, Giles-Corti B, Ball K, Hume C, Roberts R, et al. Do features of public open spaces vary according to neighbourhood socio-economic status? Health Place. 2008;14:889–93. doi: 10.1016/j.healthplace.2007.11.002. [DOI] [PubMed] [Google Scholar]
- 46.Giles-Corti B, Donovan RJ. Socioeconomic status differences in recreational physical activity levels and real and perceived access to a supportive physical environment. Prev Med. 2002;35:601–11. doi: 10.1006/pmed.2002.1115. [DOI] [PubMed] [Google Scholar]
- 47.Giles-Corti B, Donovan RJ. The relative influence of individual, social and physical environment determinants of physical activity. Soc Sci Med. 2002;54:1793–812. doi: 10.1016/s0277-9536(01)00150-2. [DOI] [PubMed] [Google Scholar]
- 48.Grow HM, Saelens BE, Kerr J, Durant NH, Norman GJ, Sallis JF. Where are youth active? Roles of proximity, active transport, and built environment. Med Sci Sports Exerc. 2008;40:2071–9. doi: 10.1249/MSS.0b013e3181817baa. [DOI] [PubMed] [Google Scholar]
- 49.Witten K, Hiscock R, Pearce J, Blakely T. Neighbourhood access to open spaces and the physical activity of residents: a national study. Prev Med. 2008;47:299–303. doi: 10.1016/j.ypmed.2008.04.010. [DOI] [PubMed] [Google Scholar]
- 50.Lovasi GS, Hutson MA, Guerra M, Neckerman KM. Built environments and obesity in disadvantaged populations. Epidemiol Rev. 2009;31:7–20. doi: 10.1093/epirev/mxp005. [DOI] [PubMed] [Google Scholar]
- 51.Taylor RB, Harrell AV. Physical environment and crime. Washington: National Institute of Justice; 1996. [Google Scholar]
- 52.Kuo FE, Sullivan WC. Environment and crime in the inner city: does vegetation reduce crime? Environ Behav. 2001;33:343–67. [Google Scholar]
- 53.Liu GC, Wilson JS, Qi R, Ying J. Green neighborhoods, food retail and childhood overweight: differences by population density. Am J Health Promot. 2007;21(4 Suppl):317–25. doi: 10.4278/0890-1171-21.4s.317. [DOI] [PubMed] [Google Scholar]
- 54.Goodchild MF, Janelle DG, editors. Spatially integrated social science. New York: Oxford University Press, Inc.; 2004. [Google Scholar]
- 55.Anselin L. Spatial econometrics: methods and models. Dordrecht (Netherlands): Kluwer; 1988. [Google Scholar]
- 56.Lawson AB, Biggeri A, Bohning D, Lesaffre E, Viel J-F, Bertollini R, editors. Disease mapping and risk assessment for public health. West Sussex (UK): John Wiley & Sons; 1999. [Google Scholar]
- 57.Haining R. Spatial data analysis in the social and environmental sciences. Cambridge (UK): Cambridge University Press; 1990. [Google Scholar]
- 58.Waller LA, Gotway CA. Applied spatial statistics for public health data. Hoboken (NJ): John Wiley & Sons; 2004. [Google Scholar]
- 59.Gao X, Asami Y, Chung C-JF. An empirical evaluation of spatial regression models. Computers and Geosciences. 2006;32:1040–51. [Google Scholar]
- 60.Fotheringham AS, Brunsdon C, Charlton M. Geographically weighted regression: the analysis of spatially varying relationships. West Sussex (UK): John Wiley & Sons; 2002. [Google Scholar]
- 61.Price M. Mastering ArcGIS. 2nd ed. New York: McGraw Hill; 2006. [Google Scholar]
- 62.Field A. Discovering statistics using SPSS®. 2nd ed. London: Sage Publications Ltd.; 2005. [Google Scholar]
- 63.Kuczmarski R, Ogden C, Guo S. 2000 CDC growth charts for the United States: methods and development. Vital Health Stat 11. 2002;(246) [PubMed] [Google Scholar]
- 64.Saelens BE, Glanz K, Sallis JF, Frank LD. Nutrition Environment Measures Study in Restaurants (NEMS-R): development and evaluation. Am J Prev Med. 2007;32:273–81. doi: 10.1016/j.amepre.2006.12.022. [DOI] [PubMed] [Google Scholar]
- 65.Glanz K, Sallis JF, Saelens BE, Frank LD. Nutrition Environment Measures Survey in Stores (NEMS-S): development and evaluation. Am J Prev Med. 2007;32:282–9. doi: 10.1016/j.amepre.2006.12.019. [DOI] [PubMed] [Google Scholar]
- 66.Census Bureau (US) Census 2000. Washington: Department of Commerce (US), Census Bureau; 2001. [Google Scholar]
- 67.Census Bureau (US) Redistricting Census 2000 TIGER/Line files. Washington: Department of Commerce (US), Census Bureau; 2000. [Google Scholar]
- 68.Massachusetts Geographic Information System. Census 2000 tract datalayers. [cited 2007 Dec 15]. Available from: URL: http://www.mass.gov/mgis/laylist.htm.
- 69.ESRI. ArcGIS®: Version 9.3. Redlands (CA): ESRI; 2008. [Google Scholar]
- 70.Kurland KS, Gorr WL. GIS tutorial for health. 2nd ed. Redlands (CA): ESRI Press; 2006. [Google Scholar]
- 71.GeoDa Center for Geospatial Analysis and Computation and Arizona Board of Regents. GeoDa®: Version 0.9.8.11. Tempe (AZ): GeoDa Center for Geospatial Analysis and Computation and Arizona Board of Regents; 2009. [Google Scholar]
- 72.Anselin L. Exploring spatial data with GeoDa®: a workbook. Urbana (IL): Center for Spatially Integrated Social Science; 2005. [Google Scholar]
- 73.Anselin L. Local indicators of spatial association (LISA) Geographical Analysis. 1995;27:93–115. [Google Scholar]
- 74.SPSS Inc. SPSS®: Version 16. Chicago: SPSS, Inc.; 2007. [Google Scholar]
- 75.Agresti A, Finlay B. Statistical methods for the social sciences. 4th ed. Gainesville (FL): Prentice Hall; 2008. [Google Scholar]
- 76.Akaike H. Information theory and an extension of the maximum likelihood principle. Second International Symposium on Information Theory; Budapest: Akademia Kiado; 1973. pp. 267–81. [Google Scholar]
- 77.Anselin L. Santa Barbara (CA): University of California, National Center for Geographic Information and Analysis; 1992. Spatial data analysis with GIS: an introduction to application in the social sciences. [Google Scholar]
- 78.Frank LD, Pivo G. Impacts of mixed use and density on utilization of three modes of travel: single-occupant vehicle, transit, and walking. Transportation Res Rec. 2007;1466:44–52. [Google Scholar]
- 79.Frank LD, Schmid TL, Sallis JF, Chapman J, Saelens BE. Linking objectively measured physical activity with objectively measured urban form: findings from SMARTRAQ. Am J Prev Med. 2005;28(2 Suppl 2):117–25. doi: 10.1016/j.amepre.2004.11.001. [DOI] [PubMed] [Google Scholar]
- 80.Humpel N, Owen N, Leslie E. Environmental factors associated with adults' participation in physical activity: a review. Am J Prev Med. 2002;22:188–99. doi: 10.1016/s0749-3797(01)00426-3. [DOI] [PubMed] [Google Scholar]
- 81.Ward MD, Gleditsch KS. Spatial regression models. Los Angeles: Sage Publications; 2008. [Google Scholar]
- 82.Piantadosi S, Byar DP, Green SB. The ecological fallacy. Am J Epidemiol. 1988;127:893–904. doi: 10.1093/oxfordjournals.aje.a114892. [DOI] [PubMed] [Google Scholar]
- 83.Glanz K, Clawson M, Young M, Carvalho M. Nutrition environment measures training manual. Atlanta: Emory University, Rollins School of Public Health; 2006. [Google Scholar]


