Abstract
Detection of the intrinsic fluorescence from proteins is important in bio-assays because it can potentially eliminate the labeling of external fluorophores to proteins. This is advantageous because using external fluorescent labels to tag biomolecules requires chemical modification and additional incubation and washing steps which can potentially perturb the native functionality of the biomolecules. Hence the external labeling steps add expense and complexity to bio-assays. In this paper, we investigate for the first time the feasibility of using bimetallic nanostructures made of silver (Ag) and aluminum (Al) to implement the metal enhanced fluorescence (MEF) phenomenon for enhancing the intrinsic emission of biomolecules in the ultra-violet (UV) spectral region. Fluorescence intensities and lifetimes of a tryptophan analogue N-acetyl-L-tryptophanamide (NATA) and a tyrosine analogue N-acetyl-L-tyrosinamide (NATA-tyr) were measured. Increase in fluorescence intensities of upto 10-fold and concurrent decrease in lifetimes for the amino acids were recorded in the presence of the bimetallic nanostructures when compared to quartz controls. We performed a model protein assay involving biotinylated bovine serum albumin (bt-BSA) and streptavidin on the bimetallic nanostructured substrate to investigate the distance dependent effects on the extent of MEF from the bimetallic nanostructures and found a maximum enhancement of over 15-fold for two layers of bt-BSA and streptavidin. We also used finite difference time domain (FDTD) calculations to explore how bimetallic nanostructures interact with plane waves and excited state fluorophores in the UV region and demonstrate that the bimetallic substrates are an effective platform for enhancing the intrinsic emission of proteins and other biomolecules.
Keywords: Metal-enhanced fluorescence (MEF), fluorescence, plasmonics, surface plasmons, metal nanoparticles, bioassays, bimetallic, alloys, finite-difference-time domain (FDTD)
1. Introduction
Bioaffinity assays are extensively used in all aspects of medical research including proteomics, clinical diagnostics and drug discovery. Most of these assays depend on the use of extrinsic fluorophores in the visible region which are used to label the bio-molecules of interest and to provide target-specific signals which are distinct from the intrinsic emission of the other biomolecules in the sample. While this approach has been successful, there is growing interest in label-free detection 1–3 to avoid the need for external labeling reactions which can adversely affect the native functionality of biomolecules, and can also become increasingly costly and complicated for a variety of applications such as high-throughput screening. The importance of label-free detection can be seen from the large number of methods which are being developed, including surface-enhanced Raman scattering (SERS),4–6 electrochemical approaches,7–8 optical transmission,9–10 reflectivity,11 and surface plasmon resonance (SPR).12–16
The intrinsic emission from proteins and nucleic acids has been widely used to study their biophysical properties and photophysics.17–19 Proteins exhibit intrinsic absorption maximum in the ultra-violet (UV) region around λ = 280 nm, which mainly arises from the absorption of the three aromatic amino acid residues tryptophan, tyrosine, and phenylalanine.17 These residues are also responsible for the intrinsic fluorescence from proteins. However, the intrinsic emission from the biopolymers of proteins and nucleic acids have not been widely used for detection and bio-assays. In the case of proteins, this absence is due to the occurrence of tryptophan residues on almost all proteins, so that the emission is not selective for the target proteins. In the case of nucleic acids, the emission quantum yields are very low (in the range of 10−5 to 10−4) due to non-radiative relaxation and other processes,20 so that intrinsic DNA emission has not been used for DNA assays. This limitation again has been overcome by the use of extrinsic labels which binds to biomolecules and absorbs and emits at longer wavelengths. Hence it would be advantageous to be able to selectively observe the emission from target proteins and nucleic acids.
During the past several years, this laboratory17,21–37 and others 38–40 have been developing techniques that use metallic nanostructures for improved fluorescence detection. This approach represents a fundamental change in fluorescence technology because the fluorescence properties can be significantly modified by the near-fields created by surface plasmons on the metallic structures. In particular, the metallic structures can substantially modify the rates of spontaneous emission and the directionality of the emission. This has been referred to as metal-enhanced fluorescence (MEF).17,21–33 Our understanding of this phenomenon is based on short range (near-field) interactions of fluorophores with the metallic nanostructures. On the excitation side, the interaction of the metal nanoparticles with the incident light creates intense enhancements in the near-fields around the nanoparticle. If a fluorophore is within the area of this near-field enhancement, it will experience very high rates of excitation (higher excitation-emission cycles). On the emission side, the excited-state fluorophores then interacts strongly with surface plasmons on the metallic nanoparticles via through space non-contact interactions. These interactions result in strong coupling between the excited fluorophores and the plasmons in the metal. This coupled fluorophore-plasmon system which we call a “plasmaphore” then radiates as a unified entity the enhanced emission that is observed during experimental settings.26 For the case of a fluorophore on a continuous metal film (supported on a dielectric substrate), the excited state fluorophores near the film induces surface plasmons on the film, which then radiates back into the dielectric substrate in a highly directional manner, a process called surface plasmon-coupled emission (SPCE).35–37 The metals used for metal-enhanced fluorescence (MEF) and directional surface plasmon coupled emission (SPCE) are typically gold, aluminum and silver. Because of its absorption bands gold is typically used for longer wavelength MEF and SPCE applications (beyond λ = 500 nm).41–42 Silver provides MEF and SPCE for wavelengths from about λ = 380 nm to λ = 800 nm,21,24,35–37 again limited at short wavelengths by absorption. Aluminum does not absorb to below λ = 250 nm and is thus promising for MEF and SPCE at deep UV wavelengths where unlabelled proteins and nucleic acids absorb and emit.22,30–31,43–44 However, much less information is available about MEF and SPCE with aluminum, and in general the metal-modified emission seems to be less enhanced than with silver. Because the extinction cross-sections and quantum yields of these biopolymers are low, it is desirable to obtain higher MEF and SPCE intensities from unlabelled proteins and nucleic acids in the UV than is achievable by aluminum alone.
In this study, we explore the use of silver-aluminum based bimetallic “alloys” or composites to increase the intrinsic emission intensity of amino acids and proteins. We preferred the use of only proteins because we need even higher enhancements for the low quantum yield DNA, RNA, nucleotides and bases.20,30 The rationale for using silver-aluminum “alloys” is that silver seems to provide higher MEF (at its optimal spectral operational region), but aluminum displays lower absorption at UV wavelengths, and thus such a combination may potentially provide the benefits of both metals to create a novel bimetallic or “alloy” material that maximizes the intrinsic emission enhancement of biomolecules in the UV. For example, aluminum may potentially allow higher selected excitation of fluorohores absorbing from λ = 250 to 320 nm, and silver may potentially provide enhanced emission above λ = 300 nm. Such “alloyed” substitutes could then be valuable for the label-free detection of protein and nucleic acids. Using bimetallic substrates possess an added advantage in regard to optical tunability. By modifying the composition and arrangement of the constituent metal components, the optical properties of the bimetallic substrate can be specifically tuned to the appropriate wavelength region as needed by the application. Hence there is great potential to significantly optimize MEF applications. This study is the first to report on the use of bimetallic “alloy” substrates for the intrinsic emission enhancement of biomolecules in the UV region.
In this paper, we demonstrated the usefulness of silver-aluminum “alloys” as a MEF substrate with peptide analogues of tyrosine - N-acetyl-L-tyrosinamide (NATA-tyr), and tryptophan - N-acetyl-L-tryptophanamide (NATA), and observed a 10-fold increase in fluorescence emission intensity with NATA-tyr and a 2-fold increase in emission intensity with NATA. We also obtained significant enhancement in emission intensity (greater than 15-fold) from full proteins in the form of a model bioassay system comprising of biotinylated -BSA (bt-BSA) with streptavidin (SA). We examined the effect of distance of proteins from the bi-metallic surface on the degree of MEF by varying of the thickness of the protein layers on top of the substrate and showed a maximum enhancement of over 15-fold for two layers of bt-BSA-SA. We also present the results of numerical finite-difference time-domain (FDTD) 30–31,33–34,45 calculations to understand how bimetallic or “alloy” nanoparticles interact with incident plane waves and fluorophores in the UV region. Our FDTD calculations show enhancements in the radiative power emitted by fluorophores in the UV when in proximity to bimetallic or “alloy” nanaostructures. We also present FDTD calculations showing enhancements in the electromagnetic near-field distributions around the “alloy” nanoparticles due to their interaction with incident plane waves as well as excited-state fluorophores in the UV. Our FDTD calculations suggests that silver-aluminum “alloy” nanostructures are very promising substrates for enhancing the emission of fluorophores in the spectral range relevant for the intrinsic emission of biomolecules and thus strongly corroborates the conclusions from our experimental observations.
2. Materials and Methods
Experimental Details
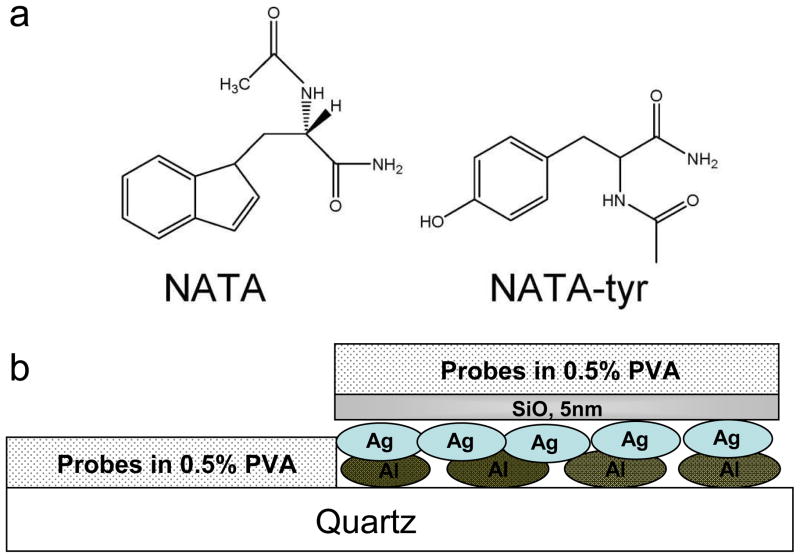
Aluminum slugs, silver wires, silicon monoxide, N-acetyl-L-tryptophanamide (NATA), and low molecular weight polyvinyl alcohol (PVA, MW 13000 - 23000), biotininylated bovine serum albumin (bt-BSA) and streptavidin (SA) were purchased from Sigma-Aldrich and used as received. N-acetyl-L-tyrosinamide (NATA-tyr) was obtained from Acros Organics. Distilled water (with a resistivity of 18.2 MΩ-cm) purified using Millipore Milli-Q gradient system was used for sample preparation. The bimetallic nanostructured films on quartz slides were prepared using an Edwards Auto 306 vacuum evaporation chamber under high vacuum (< 3×10⁻⁷ torr). 5 nm of Al film was deposited on the quartz slides followed by a layer of 5 nm Ag. Once the metals were deposited a 5 nm thick dielectric (silica) was deposited on top without breaking the vacuum. The deposition of the silica layer served the purpose of spacer between the metal surface and the probes. The deposition rate of the various layers was adjusted by the filament current and the thicknesses of the deposited films were monitored using an inbuilt quartz crystal microbalance. N-acetyl-L-tryptophanamide (NATA) and N-acetyl-L-tyrosinamide (NATA-tyr) (chemical structures shown in Figure 1a) were spin coated on the quartz and metal substrates using 0.5% poly-vinyl alcohol solution at 3000 rpm using a Speedline Technologies spin coating system. At these conditions the PVA film thickness is expected to be approximately 20 nm. Figure 1b depicts the schematic of the set up discussed above. We have performed numerous control experiments where probes of varying types were spin coated on a quartz substrate coated with 5–10 nm of silica layer and found the emission intensity to be very similar to those from probes spin coated directly on the quartz substrate. As a result we believe that quartz and silica coated quartz allows for a comparable distribution of the adsorbed probes.22,29–31 As a result for our experiments, probes spin coated directly on quartz served as the control unless otherwise stated. Further studies were carried out to investigate the distance dependence effect on MEF as a model protein system was varied at different distances from the bimetallic nanostructured surface. We chose bt-BSA and SA interactions to examine this distance dependence effect. bt-BSA (100μg/ml) in phosphate buffer (pH~7.4) was incubated on the metal surface for 1 hour followed by several rinsing steps. Subsequently streptavidin (100μg/ml) was pipetted on top of the bt-BSA layer. All fluorescence intensity and lifetime studies were carried out in wet conditions by placing a quartz cover slip on top of the substrate.
Figure 1.
(a) Chemical structure of NATA and NATA-tyr. (b) Schematic of cross-section of the experimental set up using fluorescence probes (not to scale).
A Hewlett-Packard 8453 spectrophotometer was used to obtain absorption spectra from the bimetallic nanostructured samples. Fluorescence emission spectra of NATA and NATA-tyr on the solid substrates were recorded using a Varian Cary Eclipse Fluorescence Spectrophotometer. Both the steady-state and time-domain lifetime measurements were carried out using front face illumination. We performed time-domain lifetime studies using a PicoQuant lifetime fluorescence spectrophotometer (Fluotime 100). The excitation source was a pulsed laser diode (PicoQuant PDL800-B) with a 20 MHz repetition rate. The Instrument Response Function (IRF) for our system was approximately 300 ps. Intensity decays were measured through bandpass interference filters. Vertically polarized excitation was used to measure emission lifetimes and magic angle observation was used in the emission path for the time-domain measurements. This optical configuration reduces the effect of scattered excitation beam and removes the effects of rotational diffusion without significant distortion of the spectra or lifetimes.
The fluorescence intensity decays were analyzed in terms of the multi-exponential model as the sum of individual single exponential decays:17
| (1) |
In the above expression, τi are the decay times and αi are the amplitudes. The fractional contribution of each component to the steady-state intensity is described by:17
| (2) |
the mean (intensity weighted) lifetime is represented by:17
| (3) |
and the amplitude weighted lifetime is given by:17
| (4) |
The values of αi and τi were determined using the PicoQuant Fluofit 4.1 (Professional Version) software with the deconvolution of instrument response function and nonlinear least squares fitting. We employed the tried and tested method of calculating the χ2 value to determine the goodness-of-fit criterion.
Imaging of the bimetallic film surface morphology was performed using a Hitachi SU-70 Scanning Electron Microscope (SEM). A low probe voltage was applied (3 keV) for the analysis to minimize charging caused by the non-conductive silica top layer. The samples were mounted on an Al-stub and affixed using carbon conductive tape. The sample was studied at low magnification to see the general features and homogeneity of the surface. Higher magnification images were obtained at representative areas that helped us to analyze the nanoscale features and observe the average particle size of the top metal layer.
Computational Details
Three-dimensional FDTD simulations are performed using the FDTD Solutions package from Lumerical Solutions, Inc. (Vancouver, Canada). FDTD Solutions was implemented using the parallel option on a Dell Precision PWS690 Workstation with the following components: Dual Quad-Core Intel Xeon E5320 processors at 1.86 GHz, and 24 GB RAM. All post-processing of the FDTD data was done with MATLAB (version 7.0) from (Mathworks - Natick, MA), or OriginPro 7 (Originlab Corporation - Northampton, MA). For the fluorophore based calculations it is assumed that excitation of the fluorophore has already occurred and the fluorophore is now emitting dipole radiation. Hence the fluorophore is modeled as a time-windowed, oscillating point dipole source for the electric field, with frequency content spanning the spectral range (100–700 nm) of interest and polarization perpendicular to the metal nanoparticle surface. After testing for convergence, a grid size of 1 nm was used for all our calculations. The typical duration of our simulations was 400 fs.
The FDTD calculations were done for fluorophores near an Ag, Al or a bimetallic nanoparticle that we represent as an “Alloy”. We defined the Alloy as a new a material whose wavelength-dependent dielectric constants are the average of silver and aluminum constants for every wavelength. Further details of our computational setup are described in our previous reports.22,30–31,33–34 In our calculations, dipole polarizations along the x-axis are considered, where the x orientation of the dipole is perpendicular to the metal nanoparticle surface. We used a refractive index of 1.33 for water. We calculate the total radiated power enhancement as Prad/P0, where Prad is the integral of the Poynting vector over a surface enclosing the fluorophore and metal nanoparticle, and P0 is the result of this integral with only the fluorophore present. This enhancement can be equated with an increase of the radiative decay rate according to , where γrad is the radiative decay rate of the dipole in proximity of the metal nanoparticle and is the radiative decay rate of an isolated dipole (in water): 30–31,45
| (5) |
Eq. (5) shows that an enhancement in the total radiated power is indicative of a corresponding increase in the relative radiative decay rate of the system and vice-versa. An increase in the radiative decay rate will usually result in an increased quantum yield, providing the non-radiative decay processes remain unaffected.
3. Results and Discussion
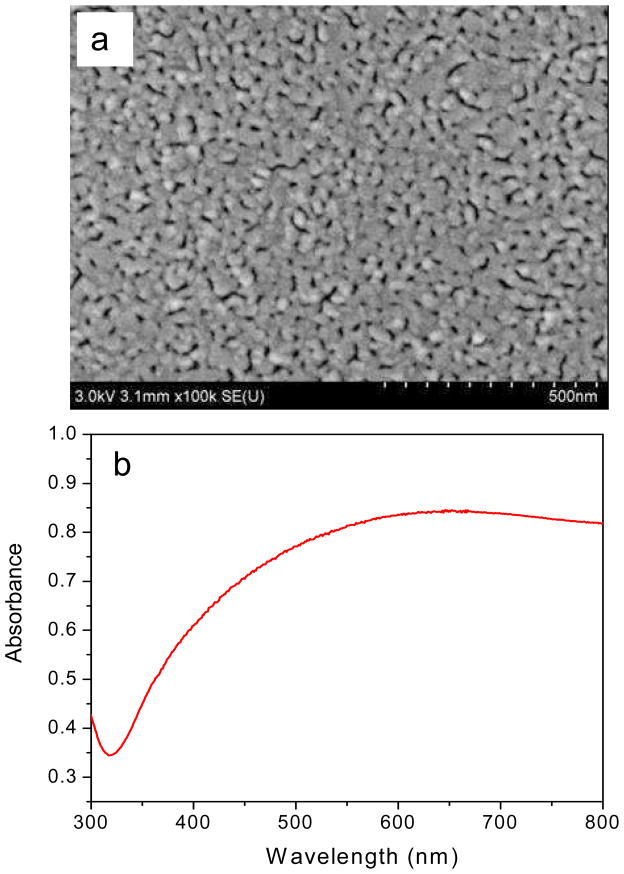
Rough or porous metal surfaces are well suited for fluorophore enhancement due to their ability to interact with incident plane waves and create surface plasmons that can lead to the enhanced excitation and emission of nearby fluorophores. Slow deposition of metals on the quartz substrate enables us to introduce these desired properties. The deposition rate of metals is primarily controlled by the filament current in the vacuum deposition chamber. The SEM image clearly shows a rough and porous metal layer deposited on the quartz slide (Figure 2a). The average particle size obtained from higher magnification SEM images is roughly between 40 nm–80 nm. The absorption spectrum of the sample does not show a sharp distinctive plasmon resonance peak in the UV-Visible region (300–800 nm) (Figure 2b) which might be attributable to the distribution of Ag and Al nanoparticles of widely varying sizes and shapes. We deposited the metals on the quartz by a sequential layered process and it is possible that thermal evaporation might induce some reorganization of the particles during the successive deposition step, thus potentially making the bimetallic film behave like an alloy mixture of Al and Ag.
Figure 2.
(a) Field emission Scanning Electron Micrograph of the fabricated bi-metallic substrate. (b) Absorption spectrum of bimetallic nanostructures on quartz.
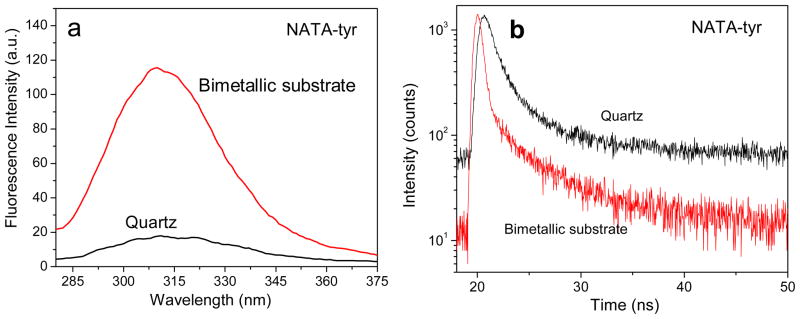
The emission spectra of NATA-tyr and NATA spin coated in 0.5% PVA on quartz and the bimetallic nanostructured substrate are shown in Figure 3. We observed an approximately 10-fold fluorescence enhancement for NATA-tyr in presence of the bimetallic nanoparticles when compared with the quartz control (Figure 3a). The shape of the emission spectra for NATA-tyr on both the slides (bimetallic substrate and control) are similar with no major spectral shift, which signifies that the molecules of NATA-tyr do not react with the underlying metal and thus its spectral properties are preserved on the bimetallic film. We examined the fluorescence lifetime of NATA-tyr spin coated on the bimetallic nanoparticles and compared it to the control quartz surface (Figure 3b). We observed a faster decay of NATA-tyr in vicinity of the bimetallic nanostructures compared to the quartz slides. The intensity decay of NATA-tyr film on quartz was fitted with a single exponential decay yielding a lifetime of 3.5 ns and a constant background level. On the other hand, NATA-tyr spin coated on the bimetallic nanostructured substrate had to be fitted with a double-exponential fitting routine with two contributing lifetimes of 3.5 ns (16%) and 0.91 ns (84%) resulting in an amplitude weighted lifetime of 1.2 ns. Hence, the intensity decays indicate that the lifetime of NATA-tyr on the bimetallic substrates decreased approximately 3-fold. The more complex multi-exponential decay for NATA-tyr on metal substrates may reflect the presence of the NATA-tyr probes at varied distances and orientations from the bimetallic surface. Most of these fluorophores undergo a through-space non-contact interaction with the underlying bimetallic substrate which is shown by the shorter component of the lifetime, while the longer lifetime component indicates the presence of a fraction of fluorophores beyond distances optimal for the MEF effect to take place. We believe these effects demonstrate the coupling of excited state fluorophores with the plasmons in the bimetallic nanostructures. This excited fluorophore-metal complex then behaves a single radiating unit which radiates as a single entity the enhanced emission that we observe in the experiments.
Figure 3.
(a) Emission spectra of NATA-tyr spin coated with 0.5% PVA solution on quartz and bimetallic substrate. (b) Fluorescence intensity decay of NATA-tyr spin coated with 0.5% PVA solution on quartz and bimetallic substrate.
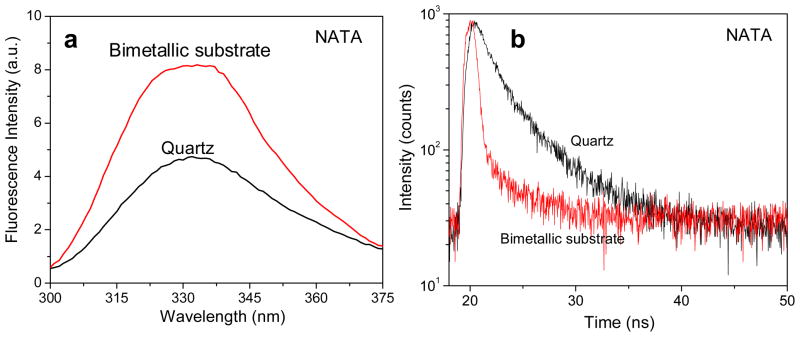
Figure 4a shows the emission spectra of NATA spin coated in 0.5% PVA on quartz and the bimetallic substrate and shows an approximately 2-fold enhancement of the molecule when in proximity of the metals. Similar to the case of NATA-tyr, the shape of the emission spectra is also conserved on the bimetallic substrate for NATA. The lifetime for NATA were also computed on quartz and on the bimetallic substrate and presented in Figure 4b. The lifetime of NATA spin coated on bare quartz was calculated using a single exponential fit to approximately 3.1 ns. The amplitude weighted lifetime decreased about 2.5-fold to approximately 1.2 ns for NATA in the proximity of the bimetallic nanostructures. These findings lead us to believe that the thermally evaporated bimetallic “alloy” nanostructured films could potentially be used as MEF substrates for performing label free bioassays in the UV region. Hence we have performed a model bioassay on this bimetallic substrate to investigate this phenomenon further.
Figure 4.
(a) Emission spectra of NATA spin coated with 0.5% PVA solution on quartz and bimetallic substrate. (b) Fluorescence intensity decay of NATA spin coated with 0.5% PVA solution on quartz and bimetallic substrate.
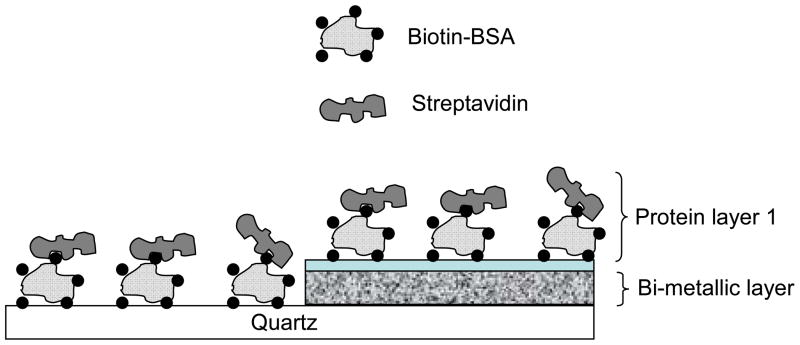
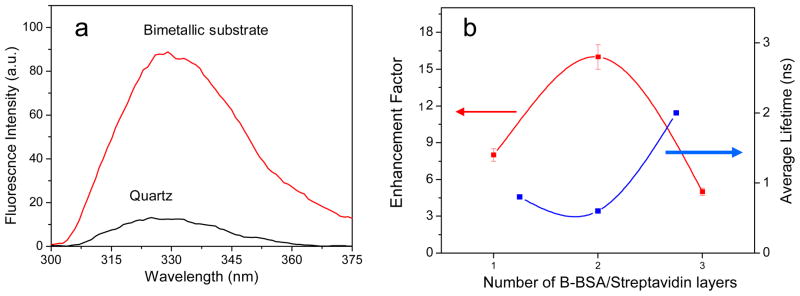
As a model bioassay we selected the system of bt-BSA with streptavidin (SA). A bt-BSA (100 μg/ml) solution in phosphate buffer (pH~7.4) was dropped cautiously onto the bimetallic substrate as well as the quartz control. After 1 hour of incubation, the unbound proteins were rinsed with phosphate buffer. Subsequently, streptavidin solution (100 μg/ml) was added to form the protein assay layer as shown in the schematic of Figure 5. The high degree of affinity between bt and SA is well documented. After a similar wait time (1 hour) and proper rinsing the slides (quartz as control; bimetallic coated slide as substrate), they were tested for fluorescence intensity and lifetime studies. The slides were carefully topped with quartz cover slips, to keep the proteins under wet conditions, to minimize denaturation and unfolding. Monitoring the enhancement of fluorescence using SA conjugated to bt-BSA is much easier than native BSA due to the abundance of trp residues in SA SA has 24 trp residues compared to just 2 in BSA. SA also has a 2-fold higher quantum yield as compared to BSA which makes it a suitable candidate for studying intrinsic protein fluorescence. The immobilized protein on the metal surface showed an enhancement of 8-fold (Figure 6a), and a 4-fold decrease in lifetime. We would like to point out that although the measured emission signal will have contributions from both the BSA as well as the streptavidin layer, it is expected that the overwhelming majority of the contribution to the emission will originate from the streptavidin layer as it has significantly more trp residues than BSA (12-fold more).
Figure 5.
Schematic representing the protein binding assay for the study of the effect of distance dependence on MEF from the bimetallic substrate.
Figure 6.
(a) Emission spectra of layer 1 of the protein assay on quartz and the bimetallic substrate. (b) Amplitude weighted lifetime and fluorescence enhancement factor of multiple layers of protein on the bimetallic substrate.
We examined the effect of distance of proteins from the bi-metallic surface on the degree of MEF. The experiment was carried out by variation of the thickness of the protein layers on top of the substrate using layer by layer immobilization. Single, double and triple layers of bt-BSA/SA were immobilized on top of the bimetallic substrate as well as the quartz control substrate, where the multiple layers were constructed by repeating each step as discussed before. The effective thickness of the protein layers from the metal surface can be roughly estimated to be around 15, 25 and 35 nm respectively. On subsequent incubation of the layers we observed an enhancement trend as shown in Figure 6b. With 2 layers of protein the enhancement increases to approximately 16-fold. The protein multilayer system may not provide us with a single distance dependent parameter as the trp residues are distributed through out the proteins, but it can serve as a model for a qualitative design parameter for further development of label free assays. The emission spectra obtained resembles the characteristic protein emission. On addition of the third layer we observe a decrease in the enhancement of the protein emission. This decrease in the enhancement (compared to the 2-layer case) can be attributed to the increased distance of the protein from the bimetallic surface. We believe it is because the final layer of protein (> 30 nm) is now beyond the most effective region for the MEF phenomenon to occur, an observation in accordance to our previously reported results.23 We would like to point out (to avoid any confusion) that the enhancement factors plotted for each protein layer in Figure 6b was computed by dividing the emission intensity of each protein layer on the bimetallic substrate with that of the intensity of the corresponding protein layer on quartz. For example, for the case of the bi-layer - the control was the bi-layer of protein on quartz; for the case of the tri-layer - the control was the tri-layer of protein on quartz and hence forth. So the control for each data point was different. As a result we do not expect to see a saturation of the enhancement which can potentially be expected were the controls used for each of the data point the same.
Figure 6b also shows the calculated average lifetime of the protein layers on the substrate. The average lifetime for all the layers on bare quartz slides was around 3.1 ns. In case of proteins immobilized on the bimetallic surface we observed reduced lifetimes. The average lifetime for the first two layers of protein on the bimetallic film are comparable, namely 0.8ns and 0.65 ns respectively. As in the case of fluorescence enhancement, the comparative change in lifetime for the third protein layer on the bimetallic substrate (when compared to the quartz) is significantly less than the first two layers (3.1 ns on quartz → 2 ns on the third layer on the bimetallic substrate). This is because for the case of the first two layers, the distance from the protein to the bimetallic substrate was close enough to elicit a strong interaction with the metal. This will lead to the reduction in lifetime as the metallic nanoparticles induce new channels of radiative or non-radiative decay from the excited state fluorophores.17,25 Regardless of whether the metal quenches or enhances the emission intensity of the fluorophore, the interaction of the metal will inevitably lead to a reduction in the lifetime of the emission. Hence our results show that the proteins can effectively couple with the plasmons in the bimetallic “alloy” substrate to distances of upto approximately 30 nm. This distance dependence MEF effect can further be optimized by fabricating bimetallic nanostructures of varying morphology to build an effective assay platform that exploits the intrinsic emission of proteins.
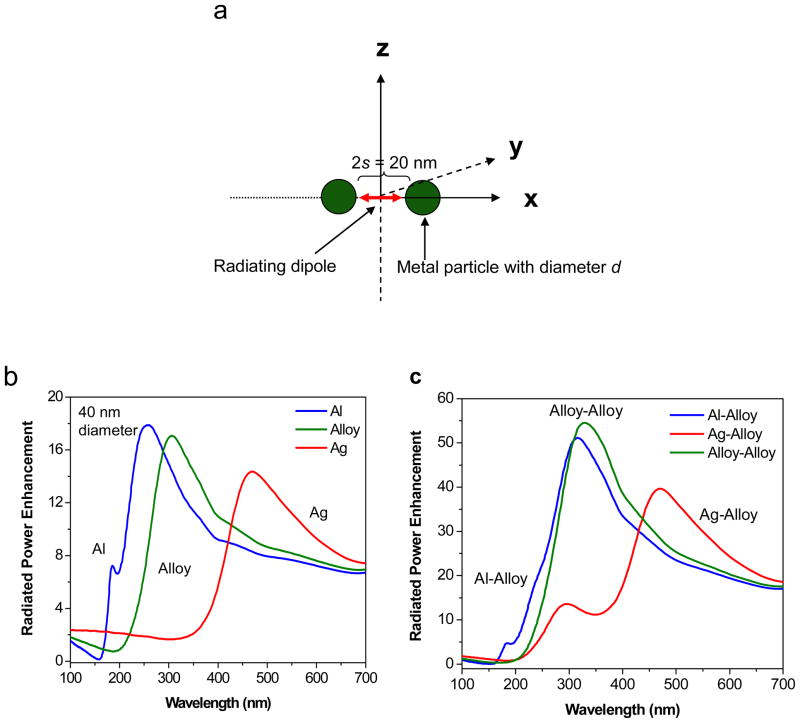
We have performed FDTD calculations to further investigate the interaction of fluorophores in the UV range with bimetallic or “Alloy” nanostructures. Three potential scenarios were examined that involved use of three different metals. The metal particles studied were: (i) pure silver (Ag); (ii) pure aluminum (Al) and; (iii) a new material we created that we call an “Alloy” - whose wavelength dependent dielectric constants were the average (with a 1:1 ratio) of the dielectric constants of Ag and Al at each wavelength studied. We created the Alloy as a way of representing the optical properties of the bimetallic nanostructures. Since the metal particles have sub-wavelength sizes it seems reasonable to use the average spectral properties for the calculation of Alloy properties. We studied single spherical Ag, Al and Alloy nanoparticles as well as dimers of Ag-Alloy, Al-Alloy and Alloy-Alloy. In each case a d = 40 nm spherical metal particle was chosen as the preferred size. We are aware that the morphology of the actual particles is not exactly spherical, but we chose the simplest geometry for ease in our calculations. A schematic of the computational model is presented in Figure 7a where the fluorophore is modeled by a radiating dipole and placed in the origin, d is the diameter of each nanoparticle, 2s is the distance between the metal surfaces. Since the fluorophore is placed at the origin, it is at a distance s from each metal surface. The case of the single particle (monomer) system corresponds to simply removing one of the nanoparticles in Figure 7a. A background dielectric constant of 1.33 is used to mimic reactions in water. For our calculations, the fluorophore is placed at a distance of s = 10 nm from the surface of the metal nanoparticle for the case of the single particle system, and in the middle of the dimer axis for the dimer system which had a spacing of 2s = 20 nm (surface-surface). We chose a fluorophore-metal separation of s = 10 nm as we felt it represented a reasonable distribution of the spacing of the randomly oriented fluorophore molecules from the metal nanparticles used in our experiments. It is assumed the excitation stage of fluorescence has occurred and the fluorophore is now emitting dipolar radiation. Hence we model this radiating fluorophore as an oscillating point dipole source. The fluorophore is oriented with its dipole moment along the x-axis, which is normal to the metal surface. We deliberately chose the perpendicular orientation of the fluorophore because we have shown in our previous reports that this orientation gives us the maximum enhancement in the radiated power and hence we chose to present the “best case” scenario.30–31,33 The main objective of our calculations is to better understand the advantage of using bimetallic nanoparticles (represented as the Alloy) in the UV regions which is appropriate for the detection of proteins using their intrinsic emission.
Figure 7.
(a) Schematic representing the sample geometry of the radiating dipole and the metal nanoparticles used for the FDTD calculations. (b) FDTD calculations of the effect of a d = 40 nm Al, Ag, and bimetallic “Alloy” monomer nanoparticle on the power radiated by a dipole spaced s = 10 nm away from them and oriented along the x-axis; (c) FDTD calculations of the effect of a d = 40 nm “Al-Alloy”, “Ag-Alloy”, and “Alloy-Alloy” dimer nanoparticle system spaced 2s = 20 nm apart (surface-surface) on the power radiated by a dipole located in the center of the dimer axis, i.e. s = 10 nm from each metal nanoparticle. The dipole is oriented along the x-axis.
The results of the calculations of the relative increase in the power radiated by a dipole when it is in close proximity to an Ag, Al and Alloy nanoparticle (spaced s = 10 nm) is presented in Figure 7b. These set of FDTD computations were performed by calculating the total radiated power by integrating the flux normal to the six sides of a closed box containing the fluorophore-metal nanoparticle system, and then dividing it by the corresponding power radiated by an isolated fluorophore (in water). An enhancement or quenching in the total radiated power by a system is related to relative changes in the radiative decay rate of the system in comparison to an isolated dipole as described by Eq. 1 and reported elsewhere.30–31,33,45 Figure 7b shows the radiated power enhancements when a fluorophore (oscillating dipole) is placed near a d = 40 nm Ag, Al, and Alloy monomer nanoparticle in water. We see that for Al, the enhancement in the radiated power peaks at approximately λmax = 255 nm with a maximum enhancement factor of ~ 18-fold. For the case of Ag, we observe a maximum enhancement of ~ 14-fold at λmax = 472 nm. And finally for the case of the Alloy we observe a maximum enhancement of ~17-fold at λmax = 306 nm, which is in the emission maximum of NATA-tyr. These calculations show that for the wavelength ranges that are important for enhancing the intrinsic emission of proteins and amino acids (300 nm – 350 nm), the Alloy (bimetallic nanostructures) serves as an effective substrate for UV MEF applications. We would like to note that the enhancements observed by all the three metals with this particular dipole orientation is in agreement with our previous reports, 30–31,33 and occurs due to the fluorophore’s dipole inducing a dipole in the metal nanoparticle in a configuration that allows the dipoles to align along the axis head to tail, leading to a much larger effective radiating dipole than in the case of an isolated fluorophore (constructive interference).
We have previously shown that the emission of dipoles placed in between two metal nanoparticles in either an Ag-Ag or an Al-Al dimer system is increased significantly when compared to the case of an isolated dipole or for the case of a dipole next to a single metal nanoparticle.30–31,33 Hence we investigated the possibility of observing highly enhanced emission for dipoles in between dimers consisting of Ag-Alloy, Al-Alloy and Alloy-Alloy. For these calculations, we kept the diameters of the particles to be constant at d = 40 nm and the dimer spacing was also maintained at 2s = 20 nm, namely the dipole being s = 10 nm from the surface of each individual metal nanoparticle. Figure 7c shows the results of these calculations where we see the Ag-Alloy dimer displaying a primary enhancement peak at λmax = 470 nm with maximum enhancements of ~ 40-fold. Interestingly we also observe a secondary blue-shifted enhancement maximum at λmax = 296 nm with enhancement magnitude of ~ 14-fold. We believe the blue shifted peak is contributed by the Alloy in the dimer and the red-shifted peak occurs due to the Ag as their individual enhancement peak in Figure 7b suggests. For the case of the Al-Alloy dimer, we observation only one main enhancement peak at λmax = 315 nm with maximum enhancement of ~ 50-fold. Finally, for the case of the Alloy-Alloy dimer we also see one enhancement peak located at λmax = 330 nm with the enhancement maximum being ~ 55-fold. These results again suggest that for the wavelength range of interest for protein or amino acid fluorescence (300–350 nm), the Alloy-Alloy (or bimetallic) dimer system shows the maximum enhancement and thus serves as the most effective MEF substrate. We would like to emphasize that the enhancement factor can be expected to significantly increase (upto 3–4 orders of magnitude) by decreasing the distance between at the metal nanoparticles (2s) as reported by us previously.30–31,33
The radiated power enhancements calculated in Figure 7 denote propagating radiation (far-field radiation) which represents the total emission from the fluorophore-metal system. Now we investigate the effect of the interaction of incident plane waves as well as excited-state fluorophores (dipole) on the near-fields around the metal nanoparticles. This is important because MEF is essentially a near-field through-space interaction and so these interactions are interesting for understanding the underlying physics of the mechanism and also for spectroscopic applications. Figure 8 shows the effect of a λ = 280 nm plane wave excitation on the near-fields around a d = 40 nm Alloy nanoparticle in water. A wavelength of 280 nm was chosen for our calculations because it is typically used to excite intrinsic biomolecule fluorescence. All the near-field calculations shown are performed along a single plane, that is, the x-y plane running through the center of the Alloy (bimetallic) nanoparticles. In Figure 8a, we show the near-field intensity image (E2 = Ex2 + Ey2 + Ez2) in water of a plane wave of wavelength λ = 280 nm with its electric field oriented along the x-axis and its propagation vector along the z-axis (out of the plane of paper). Since we are observing the plane wave along its planar wavefront, we see an image of uniform intensity. Figure 8b shows the near-fields intensities around a d = 40 nm Alloy nanoparticle created by its interaction with the plane wave of Figure 8a. The data comprising Figure 8c is the result of dividing the raw data of Figure 8b with that of Figure 8a and shows the near-field enhancements around the d = 40 nm Alloy nanoparticle by its interaction with the plane wave of Figure 8a. All the images are presented in the log scale (base 10) for clarity of observation. Figure 8c clearly reveals that the interaction of the Alloy nanoparticle with λ = 280 nm incident light produces regions of high field enhancements around the nanoparticle. The field intensity patterns in these regions show an enhancement of over 10-fold in some areas which is interesting as this means that a biomolecule (or any other fluorophore) once localized in these areas will experience a much higher excitation field than if it were isolated and directly excited only by the incident light. This will lead to higher excitation rates of the fluorophore, which can potentially lead to larger number of excitation-emission cycles in a given time period. It is worth mentioning that the high field enhancements localized in a small region around the Alloy nanoparticle may also contribute to smaller effective excitation volumes near the particle which can lead to a reduction in the unwanted background from the sample.
Figure 8.
FDTD calculations of: (a) the near-field intensity image in water of a plane wave of wavelength λ = 280 nm oriented along the x-axis and propagating along the z-axis (out of the plane of paper); (b): Near-field intensity image of the fields created around a d = 40 nm “alloy” nanoparticle by its interaction with the plane wave of Figure 8(a); (c) Image of the near-field enhancement around a d = 40 nm Alloy nanoparticle by its interaction with the plane wave of Figure 8(a). This image is generated by dividing the raw data of Fig. 8(b) by that of Fig. 8(a). Note all images are in the log scale (base 10).
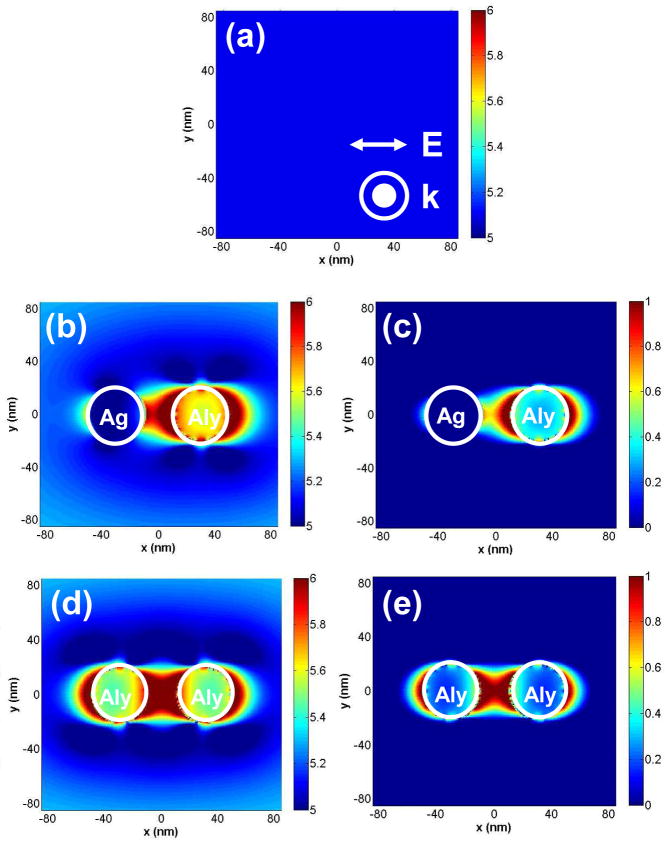
Figures 9(a–e) show respectively the electric field intensity in the x-y plane (E2 = Ex2 + Ey2 + Ez2) of a plane wave of wavelength λ = 280 nm, the near-fields around a dimer system consisting of a d = 40 nm Ag and a d = 40 nm Alloy nanoparticle spaced apart by a distance of 2s = 20 nm, the corresponding near-field enhancement image, the near-fields around a dimer system consisting of two d = 40 nm Alloy nanoparticles spaced apart by a distance of 2s = 20 nm, and the corresponding near-field enhancement image. Figures 9b and c reveal an interesting phenomenon where the near-fields are not symmetric around the dimer system but rather concentrated around the Alloy nanoparticle. It is clearly observed that the enhanced region is more pronounced around the Alloy nanoparticle as judged by the dark red regions that are on the right side of the enhancement image of Figure 9c. On the side of the Ag particle, we hardly observe any enhanced areas as denoted by the blue regions. Figures 9b and c leads us to infer that when an Ag nanoparticle is near an Alloy nanoparticle under UV illumination, it will be the Alloy nanoparticle that will strongly contribute to the enhanced excitation as a result of the more effective interaction with excitation light in the UV.
Figure 9.
FDTD calculations of: (a) the near-field intensity image in water of a plane wave of wavelength λ = 280 nm oriented along the x-axis and propagating along the z-axis (out of the plane of paper); (b) Near-field intensity image of the fields created around a dimer system consisting of d = 40 nm Ag and d = 40 nm Alloy (Aly) nanoparticle spaced by 2s = 20 nm due to the interaction with the plane wave of Figure 9(a); (c) Image showing the near-field enhancement around a dimer system consisting of d = 40 nm Ag and d = 40 nm Alloy (Aly) nanoparticle spaced by 2s = 20 nm due to the interaction with the plane wave of Figure 9(a). This image is generated by dividing the data of Fig. 9(b) by that of Fig. 9(a). Note all images are in the log scale (base 10); (d): Near-field intensity image of the fields created around a dimer system consisting of two d = 40 nm Alloy (Aly) nanoparticles spaced apart by 2s = 20 nm apart by its interaction with the plane wave of Figure 9(a); (c): Image showing the near-field enhancement around a dimer system consisting of two d = 40 nm Alloy (Aly) nanoparticles spaced 2s = 20 nm apart by its interaction with the plane wave of Figure 9(a).
Figures 9(d–e) show respectively the near-fields around a dimer system consisting of two d = 40 nm Alloy nanoparticles spaced apart by a distance of 2s = 20 nm, and the near-field enhancement image. Figures 9d and e show the near-fields are symmetrically distributed around both the Alloy nanoparticles, which is expected for a homogenous dimer system as we have reported elsewhere.30–31,33 Figure 9e shows the enhancement image where the symmetric distribution of the enhanced near-fields is clearly observed around both the Alloy nanoparticles. Additionally a comparison of Figure 9e with Figure 9c also shows that the degree of enhancement is greater for the Alloy-Alloy dimer than the Ag-Alloy dimer. This is expected as Figure 9 revealed that the Alloy interacts much more strongly with incident excitation at λ = 280 nm. A comparison of Figure 9e with Figure 8c also reveals the near-fields are more enhanced for the dimer Alloy system when compared to the single particle Alloy system. The enhanced radiation power calculations presented in Figure 7b and c signifies an increase in the radiative decay rate of the fluorophore-metal system when the fluorophore is in proximity to the Alloy nanoparticle. This increase in the radiative decay rate can also potentially decrease the excited state lifetime of the fluorophore. Thus a shorter excited-state lifetime combined with an increased excitation-emission cycle can translate to a significant increase in the number of photons emitted by the fluorophore in a given time period (providing the excited-state molecule is not saturated).
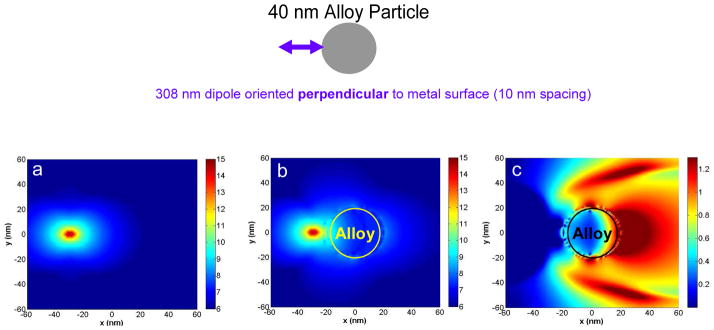
Figure 10 presents the effect of an excited-state fluorophore emitting at λ = 308 nm on the near-fields around a d = 40 nm Alloy nanoparticle. We choose 308 nm as this wavelength is emission maximum of NATA-tyr and which gave us significant enhancements in our experiments. We kept the dipole source (fluorophore) oscillating at a fixed frequency corresponding to 308 nm throughout the entire simulation time, and constructed a time average of the square of the electric field vector over the last period of evolution. The calculations of Figure 10 were done along a plane through the center of the metal and/or dipole (at z = 0 nm) and are displayed in the logarithmic scale (base 10). Figure 10a shows the near-fields around an isolated radiating dipole (excited-state fluorophore). We see the near-fields spread quite uniformly spread around the radiating dipole. In Figure 10b we show the near-fields around the d = 40 nm Alloy nanoparticle that is spaced s = 10 nm from the radiating dipole. We see that the near-fields around the Alloy nanoparticle are indeed induced by the radiating dipole. We would like to note that the near-fields observed in Figure 10b are not necessarily radiative and hence are not a definitive indication of the propagating radiation that is generally detected in experimental observations. In order to better express the metal-fluorophore interactions we present the enhancement image in Figure 10c. It is interesting to observe that the near-field is not enhanced between the Alloy nanoparticle and the dipole, but shows the largest enhancement in the distal side of the particle relative to the dipole – an observation we have reported for Ag and Al nanoparticles previously.30–31,33 It is also interesting to observe that the regions of near-field enhancements extend tens of nanometers away from the bimetallic Alloy nanoparticle. Such spatial variations in the near-field enhancements are not easily inferred from either experimental observations or calculations involving changes in the total radiated power. Hence they are helpful in augmenting our insight into the nature of MEF that can be interesting from the perspective of applications involving molecular spectroscopy. We believe the enhanced near-fields can play a role in creating the enhanced far-field emission that is observed in Figures 7b and c.
Figure 10.
(a) FDTD calculations showing the near-field intensity of the dipole in water radiating at λ = 308 nm and oriented along the x-axis; (b) the near-field intensity image around an Alloy particle, d = 40 nm, due to the interaction with the dipole placed s = 10 nm. (c) the near-field enhancement image in presence of the Alloy particle. Image (c) is generated by dividing the data of panel (b) by that of panel (a). All images are presented in the log scale (base 10) for clarity.
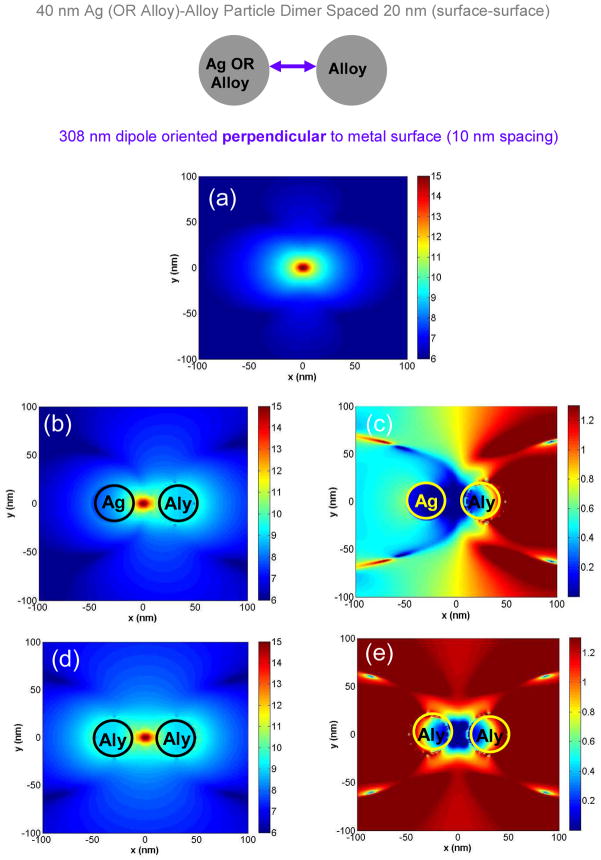
Like the case of the single nanoparticle systems, it is also informative to observe the near-fields generated around dimer systems consisting of Alloy and Ag or Alloy and Alloy by their interaction with a radiating dipole located in the middle of the dimer axis. Figure 11 shows the results of these calculations. Figure 11a displays the near-fields around an isolated dipole radiating at λ = 308 nm. In Figure 11b we see the near fields around a dimer consisting of a d = 40 nm Ag nanoparticle (left side) and a d = 40 nm Alloy particle (right side) that are spaced apart by 2s = 20 nm. The dipole is located in the center of the dimer axis, namely s = 10 nm from the surface of each nanoparticle. Here we see an interesting phenomenon where the near-fields are concentrated around the Alloy nanoparticle (right side). This is clearly seen in Figure 11c which is the enhancement image. Here the enhanced region is clearly more pronounced around the Alloy nanoparticle as judged by the red regions that are on the right side of the image that extends tens of nanometers around the Alloy particle. On the side of the Ag particle, we hardly observe any enhanced areas as denoted by the blue regions. Figures 11b and c leads us to draw an important conclusion, namely when an Ag nanoparticle is near an Alloy nanoparticle, it will be the Alloy nanoparticle that will strongly contribute to the enhanced emission observed for dipoles in their vicinity that emit in the biologically relevant UV range. Figure 11d shows the case of the radiating dipole in the middle of a d = 40 nm Alloy –Alloy dimer. In this image, the near-fields are symmetrically distributed around both the Alloy particles, which is expected for a homogenous dimer system.30–31,33 Figure 11e shows the enhancement image where the symmetry of distribution of the enhanced near-fields is clearly observed around both the Alloy nanoparticles. Additionally a comparison of Figure 11e with Figure 11c also shows that the degree of enhancement is greater for the Alloy-Alloy dimer than for the Ag-Alloy dimer. This is expected as the contribution of the Ag towards the enhancement at λ = 308 nm is relatively negligible. Also comparing figure 11e with Figure 10c we see that the near-fields induced by excited-state fluorophores in the UV are significantly enhanced for the dimer Alloy system when compared to the single particle Alloy system. This is expected because now the excited state dipole is interacting with two Alloy nanoparticles to generate intense near-fields that can lead to the generation of significantly more intense propagating radiation as seen from Figures 7b and c. In the case of the dimer, the excited-state dipole creates two mirror dipoles in each of the Alloy nanoparticles which then aligns head-to-tail to create a large effective radiating dipole leading to the significantly enhanced emission intensities. Again we see from the calculated near-fields, bimetallic (or Alloy) nanoparticles interact strongly with dipoles in the emission wavelength of tyrosine suggesting its utility for use in MEF applications in enhancing the intrinsic emission of amino acids and/or proteins. Our numerical calculations were instructive in providing us with an insight on how the thermally evaporated bimetallic nanostructured films can enhance the intrinsic emission of biomolecules in the UV. The set of coupled theoretical and experimental results show that bimetallic or Alloy substrates could indeed be useful for performing label free bioassays. We would like to point out that the metal-enhanced fluorescence (MEF) phenomenon is a complex phenomenon that is comprised of the simultaneous interplay of both enhancements in the emission intensity of the probes due to enhanced radiative pathways induced by the metal as well as quenching of the probe emission that can occur due to non-radiative energy transfer to the metal as reported by us and other groups.17,25–26,33,35,46–48 The emission intensities observed in experiments is the net result from the radiative and non-radiative channels induced by the metal and depends on a case by case basis that involves key paramemeters such as the size and shape of the metal nanostructures, metal-probe distance, metal-probe orientation, the effect of solvents, wavelength of emission etc.
Figure 11.
(a) FDTD calculations showing the near-field intensity of the dipole in water radiating at λ = 308 nm and oriented along the x-axis; (b) The intensity image of the near-fields created around a dimer system consisting of a d = 40 nm Ag nanoparticle and a d = 40 nm Alloy (Aly) nanoparticle spaced 2s = 20 nm apart with the dipole radiating at λ = 308 nm placed at the middle of the dimer axis (located s = 10 nm from the surface of each particle); (c) Near-field enhancement in the Ag-Alloy dimer system generated by dividing the raw data of panel (b) by that of panel (a); (d) Intensity image of the near-fields created around a dimer system consisting of two d = 40 nm Alloy nanoparticles spaced 2s = 20 nm apart with the dipole radiating at λ = 308 nm placed at the middle of the dimer axis; (e) Near-field enhancement in the Alloy-Alloy dimer system generated by dividing the raw data of panel (d) by that of panel (a). All images are presented in the log scale (base 10) for clarity.
4. Conclusion
The present work demonstrates for the first time the potential for using plasmonic bimetallic nanostructures as platforms for the detection of intrinsic emission of biomolecules such as proteins. The bimetallic substrate was fabricated by thermally evaporating Ag and Al under high vacuum in a sequential layered process on quartz slides. The presence of Ag-Al based bimetallic nanostructures leads to increased fluorescence intensity of a tryptophan analogue N-acetyl-L-tryptophanamide (NATA) and a tyrosine analogue N-acetyl-L-tyrosinamide (NATA-tyr). Complimentary to these findings we observed decreased lifetimes of the probes when in vicinity of the bimetallic nanostructures compared to bare quartz slides which served as the control. A model bioassay based on biotin-BSA/streptavidin chemistry was used to perform a study exploring the effect of distance dependence on the extent of MEF and provided qualitative estimation of the optimal working distance from the metal surface. These preliminary experimental results suggest that MEF can be implemented with bimetallic substrates in the UV region to enhance the intrinsic emission of amino acids and proteins, and thus potentially be used in creating novel bio-assays that can overcome the need for external labeling of biomolecules with costly and complex extrinsic probes. We have presented numerical FDTD studies that showed the effect of Ag, Al and bimetallic “alloy” nanoparticles on incident plane wave excitation and excited-state dipoles in the their vicinity. The theoretical results helps us understand how bimetallic “alloy” nanostructures interact with fluorophores in the UV and clearly suggest that the bimetallic substrate composed of Ag and Al have a distinct advantage in the wavelength region that is important for the detection of intrinsic fluorescence of proteins.
Acknowledgments
This work was supported by the National Institutes of Health (NIH) - Grant Nos. HG002655, HG005090, RC1GM091081 and K25AI087968. The authors thank Dr. Wen-An Chiou and Dr. Larry Liu of NISP laboratories, University of Maryland, College Park for helping with SEM imaging of the samples.
References
- 1.Ramachandran N, Larson DN, Stark PRH, Hainsworth E, LaBaer J. FEBS J. 2005;272:5412–5425. doi: 10.1111/j.1742-4658.2005.04971.x. [DOI] [PubMed] [Google Scholar]
- 2.Yu X, Xu D, Cheng Q. Proteomics. 2006;6:5493–5503. doi: 10.1002/pmic.200600216. [DOI] [PubMed] [Google Scholar]
- 3.Cooper MA. Drug Discov Today. 2006;11:1068–1074. doi: 10.1016/j.drudis.2006.10.001. [DOI] [PubMed] [Google Scholar]
- 4.Stuart DA, Yonzon CR, Zhang X, Lyandres O, Shah NC, Glucksberg MR, Walsh JT, Van Duyne RP. Anal Chem. 2005;77:4013–4019. doi: 10.1021/ac0501238. [DOI] [PubMed] [Google Scholar]
- 5.Sun L, Yu C, Irudayaraj J. Anal Chem. 2007;79:3981–3988. doi: 10.1021/ac070078z. [DOI] [PMC free article] [PubMed] [Google Scholar]
- 6.Grow AE, Wood LL, Chaycomb JL, Thompson PA. J Microbiol Methods. 2003;53:221–233. doi: 10.1016/s0167-7012(03)00026-5. [DOI] [PubMed] [Google Scholar]
- 7.Vestergaard M, Kerman K, Tamiya E. Sensors. 2007;7:3442–3458. doi: 10.3390/s7123442. [DOI] [PMC free article] [PubMed] [Google Scholar]
- 8.Hansen JA, Wang J, Kawde AN, Xiang Y, Gothelf KV, Collins G. J Am Chem Soc. 2006;128:2228–2229. doi: 10.1021/ja060005h. [DOI] [PubMed] [Google Scholar]
- 9.Acharya G, Chang CL, Savran C. J Am Chem Soc. 2006;128:3862–3863. doi: 10.1021/ja057490l. [DOI] [PubMed] [Google Scholar]
- 10.Zeskind BJ, Jordan CD, Timp W, Trapani L, Waller G, Horodincu V, Ehrlich DJ, Matsudaira P. Nature Methods. 2007;4:567–569. doi: 10.1038/nmeth1053. [DOI] [PubMed] [Google Scholar]
- 11.Landry JP, Zhu XD, Gregg JP. Optics Letts. 2004;29:581–583. doi: 10.1364/ol.29.000581. [DOI] [PubMed] [Google Scholar]
- 12.Willets KA, Van Duyne RP. Annu Rev Phys Chem. 2007;58:267–297. doi: 10.1146/annurev.physchem.58.032806.104607. [DOI] [PubMed] [Google Scholar]
- 13.Phillips KS, Cheng Q. Anal Bioanal Chem. 2007;387:1831–1840. doi: 10.1007/s00216-006-1052-7. [DOI] [PubMed] [Google Scholar]
- 14.Wegner GJ, Wark AW, Lee HJ, Codner E, Saeki T, Fang S, Corn RM. Anal Chem. 2004;76:5677–5684. doi: 10.1021/ac0494275. [DOI] [PubMed] [Google Scholar]
- 15.Lee HJ, Wark AW, Corn RM. Langmuir. 2006;22:5241–5250. doi: 10.1021/la060223o. [DOI] [PMC free article] [PubMed] [Google Scholar]
- 16.Lee HJ, Nedelkov D, Corn RM. Anal Chem. 2006;78:6504–6510. doi: 10.1021/ac060881d. [DOI] [PubMed] [Google Scholar]
- 17.Lakowicz JR. Principles of Fluorescence Spectroscopy. 3. Springer; New York: 2006. [Google Scholar]
- 18.Ladokhin AS. Fluorescence spectroscopy in peptide and protein analysis. In: Meyers RA, editor. Encyclopedia of Analytical Chemistry. John Wiley & Sons; New York: 2000. pp. 5762–5779. [Google Scholar]
- 19.Brand L, Johnson ML, editors. Fluorescence spectroscopy. Vol. 278. Academic Press; San Diego: 1997. Methods in enzymology. [Google Scholar]
- 20.Peon J, Zewail AH. Chem Phys Lett. 2001;348:255–262. [Google Scholar]
- 21.Zhang J, Fu Y, Chowdhury MH, Lakowicz JR. Nano Letters. 2007;7:2101–2107. doi: 10.1021/nl071084d. [DOI] [PMC free article] [PubMed] [Google Scholar]
- 22.Ray K, Chowdhury MH, Lakowicz JR. Anal Chem. 2007;79:6480–6487. doi: 10.1021/ac071363l. [DOI] [PMC free article] [PubMed] [Google Scholar]
- 23.Ray K, Badugu R, Lakowicz JR. J Phys Chem C. 2007;111:7091–7097. doi: 10.1021/jp067635q. [DOI] [PMC free article] [PubMed] [Google Scholar]
- 24.Ray K, Badugu R, Lakowicz JR. J Am Chem Soc. 2006;128:8998–8999. doi: 10.1021/ja061762i. [DOI] [PMC free article] [PubMed] [Google Scholar]
- 25.Lakowicz JR. Anal Biochem. 2001;298:1–24. doi: 10.1006/abio.2001.5377. [DOI] [PMC free article] [PubMed] [Google Scholar]
- 26.Lakowicz JR, Ray K, Chowdhury M, Szmacinski H, Fu Y, Zhang J, Nowaczyk K. Analyst. 2008;133:1308–1346. doi: 10.1039/b802918k. [DOI] [PMC free article] [PubMed] [Google Scholar]
- 27.Lakowicz JR, Shen Y, D’Auria S, Malicka J, Fang J, Gryczynski Z, Gryczynski I. Anal Biochem. 2002;301:261–277. doi: 10.1006/abio.2001.5503. [DOI] [PMC free article] [PubMed] [Google Scholar]
- 28.Szmacinski H, Ray K, Lakowicz JR. Anal Chem. 2009;385:358–364. doi: 10.1016/j.ab.2008.11.025. [DOI] [PMC free article] [PubMed] [Google Scholar]
- 29.Ray K, Chowdhury MH, Szmacinski H, Lakowicz JR. J Phys Chem C. 2008;112:17957–17963. doi: 10.1021/jp807025n. [DOI] [PMC free article] [PubMed] [Google Scholar]
- 30.Chowdhury MH, Ray K, Johnson ML, Gray SK, Pond J, Lakowicz JR. J Phys Chem C. 2010;114:7448–7461. doi: 10.1021/jp911229c. [DOI] [PMC free article] [PubMed] [Google Scholar]
- 31.Chowdhury MH, Ray K, Gray SK, Pond J, Lakowicz JR. Anal Chem. 2009;81:1397–1403. doi: 10.1021/ac802118s. [DOI] [PMC free article] [PubMed] [Google Scholar]
- 32.Ray K, Szmacinski H, Lakowicz JR. Anal Chem. 2009;81:6049–6054. doi: 10.1021/ac900263k. [DOI] [PMC free article] [PubMed] [Google Scholar]
- 33.Chowdhury MH, Pond J, Gray SK, Lakowicz JR. J Phys Chem C. 2008;112:11236–11249. doi: 10.1021/jp802414k. [DOI] [PMC free article] [PubMed] [Google Scholar]
- 34.Chowdhury MH, Gray SK, Pond J, Geddes CD, Aslan K, Lakowicz JR. J Opt Soc Am B. 2007;24:2259–2267. doi: 10.1364/JOSAB.24.002259. [DOI] [PMC free article] [PubMed] [Google Scholar]
- 35.Lakowicz JR. Anal Biochem. 2005;337:171–194. doi: 10.1016/j.ab.2004.11.026. [DOI] [PMC free article] [PubMed] [Google Scholar]
- 36.Gryczynski I, Malicka J, Gryczynski Z, Lakowicz JR. Anal Biochem. 2004;324:170–182. doi: 10.1016/j.ab.2003.09.036. [DOI] [PMC free article] [PubMed] [Google Scholar]
- 37.Ray K, Szmacinski H, Enderlein J, Lakowicz JR. Appl Phys Lett. 2007;90:251116. doi: 10.1063/1.2751125. [DOI] [PMC free article] [PubMed] [Google Scholar]
- 38.Sokolov K, Chumanov G, Cotton TM. Anal Chem. 1998;70:3898–3905. doi: 10.1021/ac9712310. [DOI] [PubMed] [Google Scholar]
- 39.Antunes PA, Constantino CJL, Aroca RF, Duff J. Langmuir. 2001;17:2958–2964. [Google Scholar]
- 40.Ringler M, Schwemer A, Wunderlich M, Nichtl A, Kürzinger K, Klar TA, Feldmann J. Phys Rev Lett. 2008;100:203002. doi: 10.1103/PhysRevLett.100.203002. [DOI] [PubMed] [Google Scholar]
- 41.Zhang J, Lakowicz JR. Optics Express. 2007;15:2598–2606. doi: 10.1364/oe.15.002598. [DOI] [PMC free article] [PubMed] [Google Scholar]
- 42.Gryczynski I, Malicka J, Gryczynski Z, Lakowicz JR. J Phys Chem B. 2004;108:12568–12574. doi: 10.1021/jp040221h. [DOI] [PMC free article] [PubMed] [Google Scholar]
- 43.Malicka J, Gryczynski I, Gryczynski Z, Lakowicz JR. J Phys Chem B. 2004;108:19114–19118. doi: 10.1021/jp047136u. [DOI] [PMC free article] [PubMed] [Google Scholar]
- 44.Gryczynski I, Malicka J, Lumoska J, Gryczynski Z, Lakowicz JR. Photochem Photobiol. 2004;80:482–486. doi: 10.1562/0031-8655(2004)080<0482:SPPEON>2.0.CO;2. [DOI] [PMC free article] [PubMed] [Google Scholar]
- 45.Kaminski F, Sandoghdar V, Agio M. J Comp and Theor Nanoscience. 2007;4:635–643. [Google Scholar]
- 46.Mennucci B, Cappelli C, Guido CA, Cammi R, Tomasi J. J Phys Chem A. 2009;113:3009–3020. doi: 10.1021/jp8094853. [DOI] [PubMed] [Google Scholar]
- 47.Navarro JRG, Plugge M, Loumaigne M, Sanchez-Gonzales A, Mennucci B, Débarre A, Brouwer AM, Werts MHV. Photochem Photobiol Sci. 2010;9:1042–1054. doi: 10.1039/c0pp00063a. [DOI] [PubMed] [Google Scholar]
- 48.Speelman AL, Muñoz-Losa A, Hinkle KL, VanBeek DB, Mennucci B, Krueger BP. J Phys Chem A. 2011;115:3997–4008. doi: 10.1021/jp1095344. [DOI] [PMC free article] [PubMed] [Google Scholar]


