

Abstract
Interactions among the dimensions of the Five Factor Model (FFM) have not typically been evaluated in mental health research, with the extant literature focusing on bivariate relationships with psychological constructs of interest. This study used latent profile analysis to mimic higher-order interactions to identify homogenous personality profiles using the FFM, and also examined relationships between resultant profiles and affect, self-esteem, depression, anxiety, and coping efficacy. Participants (N = 371) completed self-report and daily diary questionnaires. A 3-profile solution provided the best fit to the data; the profiles were characterized as well-adjusted, reserved, and excitable. The well-adjusted group reported better psychological functioning in validation analyses. The reserved and excitable groups differed on anxiety, with the excitable group reporting generally higher anxiety than the reserved group. Latent profile analysis may be a parsimonious way to model personality heterogeneity.
Keywords: personality, five factor model, latent profile analysis
1. Introduction
Individuals bring a set of traits with them from situation to situation, which influence how they engage with the world, and are closely related to mental health outcomes. There are several theoretical conceptualizations of personality (e.g., Eysenck, 1992), with the most widely studied and agreed upon taxonomy being the Five Factor Model (FFM; McCrae & Costa, 1987). The FFM yields five personality dimensions: Neuroticism (emotional instability, distress in response to stressors), Extraversion (sociability, energy, positive emotionality), Openness (appreciation of personal emotion, curiosity, independent judgment), Agreeableness (trustfulness, altruism, cooperativeness), and Conscientiousness (goal directed, self-control, organization). These dimensions have been supported across samples and cultures (McCrae & Costa, 1987).
Characterological relationships with psychological outcomes have been widely studied, with most research focusing on associations between single FFM dimensions and other constructs. Neuroticism has emerged as the strongest predictor of maladaptive psychological functioning (Clark, Watson, & Mineka, 1994; Kotov et al., 2010; McCrae & Costa, 1987), suggesting that emotional instability is a core feature of psychological dysfunction. However, this does not imply that other traits are inconsequential. Despite reliably differentiating individuals who are predisposed to internalization, Neuroticism does not discriminate well between specific problems (McCrae & Costa, 1987; Kotov et al., 2010), underscoring the importance of evaluating the other dimensions. Extraversion has been shown to correlate with a number of psychological constructs (e.g., Brown, Chorpita, & Barlow, 1998; Clark et al., 1994; Enns & Cox, 1997), as has Conscientiousness (e.g., Besser & Shackelford, 2007; Hayes & Joseph, 2003), but less is known about Openness and Agreeableness. A recent meta-analysis suggests that while low Conscientiousness is common across psychopathology, and thus does not increase specificity when making predictions about people, Agreeableness and Openness yielded small, “equivocal” correlations (Kotov et al., 2010). This is somewhat unexpected given that Agreeableness is characterized by an ability to get along with others (McCrae & Costa, 1997), and that Openness leads to feeling “both the good and the bad more intensely” (McCrae & Costa, 1991).
Although evaluating the first-order effects of the FFM dimensions on psychological outcomes is an ostensibly pure way to assess how personality is related to mental health, this method overlooks the reality that traits do not exist in isolation. Although qualitatively distinct, Neuroticism, Extraversion, Agreeableness, and Conscientiousness have been shown to covary (McCrae & Costa, 1987), as have Openness and Extraversion (Digman, 1997; DeYoung, Peterson, & Higgins, 2002). Thus, the five factors vie for shared variance when making predictions about psychological outcomes, potentially concealing mutual influence due to measurement and/or true overlap between dimensions. That is, while simultaneously entering the FFM dimensions as predictors in a statistical model controls for common variance, these types of models are only informative with regards to the additive effects (i.e., first order effects) of these personality dimensions, and preclude the possibility that dimensions of the FFM can be modeled as multiplicative effects (i.e., interactions).
Despite longstanding theory that personality trait interactions may be important predictors of mental health (e.g., Eysenck, 1987), few studies have evaluated this hypothesis. Because the level of variance explained by an interaction may be small due to reduced statistical power after accounting for first-order effects (Cohen, Cohen, West, & Aiken, 2003), significant findings may be an underestimation of real-world effects. Thus, even small but significant interactions may be important in enhancing theoretical understanding of personality (Chaplin, 1997). The multiplicative effects of Neuroticism and Extraversion (i.e., high Neuroticism, low Extraversion), for example, have been shown to be predictive of depressive symptoms in university (McFatter, 1994) and clinical (Gershuny & Sher, 1998) samples; although, there has been difficulty replicating these results using a community sample (Jorm et al., 2000). Swickert, Hittner, and Foster (2010) demonstrated that Neuroticism, Extraversion, and Openness interacted such that at differing levels of Extraversion, the Neuroticism-Openness relationship was differently predictive of perceived social support.
These studies of trait interactions represent an advancing sophistication in assessing how the FFM can be used to predict psychological outcomes, although none utilize all FFM dimensions. Variable-centered analyses with more than three interacting variables are difficult to interpret, and may be less suitable for making inferences about individuals, because results are at the level of the variable, not the person. When considering all 5 dimensions of the FFM as predictor variables, the number of higher-order interactions is numerous (ten 2-way interactions alone), and can result in statistical problems such as increases in the variance inflation factor and reduced statistical power (Cohen et al., 2003). Because it is often impractical to model all higher-order interactions of interest, person-centered statistical approaches (e.g., latent profile analysis) can be used to mimic higher-order interaction terms (Lanza, Rhodes, Nix, & Greenberg, 2010). Latent profile analysis (LPA) describe how traits are organized within individuals (Robins, John, & Caspi, 1998). Cataloging interactive effects as subtypes is practical in that it offers a brief and simple summary of complicated relationships (Herzberg & Roth, 2006; Robins et al., 1998). Even the Diagnostic and Statistical Manual of Mental Disorders employs a categorical approach for mental health, and as such, simplifies complicated interactions of symptoms to create a nomenclature to inform diagnosis, make predictions, and determine treatment for groups of people.
There have been attempts to organize groups of respondents based on statistical interactions of traits into types (termed Resilients, Overcontrollers, and Undercontrollers) since the 1970’s (Herzberg & Roth, 2006). Resilients were characterized by low Neuroticism, and moderate Extraversion and Agreeableness. Overcontrollers reported high Neuroticism, but low Extraversion. Undercontrollers yielded high Neuroticism, and moderate Extraversion and Openness. Attempts to replicate these findings using variable-centered approaches have yielded five types rather than three, although this has not been reliably established (Herzberg & Roth, 2006).
Alternatively, using a person-centered statistical approach to classify individuals based on probabilistic theory offers a method for finding homogenous subtypes of people from FFM data. Several studies have used person-centered techniques with the FFM to validate the three subtypes (Asendorpf, Borkenau, Ostendorf, & Van Aken, 2001), make predictions about ADHD (Martel, Goth-Owens, Martinez-Torteya, & Nigg, 2010), criminality (Herzberg & Hoyer, 2009), and prejudice (Ekehammar & Akrami, 2003). These investigations suggest that personality interactions may also be predictive of other mental health characteristics.
The present study used LPA to determine whether interactions among FFM personality dimensions can be used to organize respondents into groups with homogenous trait profiles. Once profile groups were established, each was examined in relation to psychological variables that were chosen based on empirical and theoretical considerations (positive affect, negative affect, self-esteem, depression, anxiety, coping efficacy) to assess for group differences among the profile types.
2. Method
2.1 Participants
The sample was comprised of 371 college students (freshman = 34.2%, sophomore = 18.4%, junior = 20.3%, senior = 27.1%) from a large western university with ages ranging from 17 to 25 (M = 20.13, SD = 2.09). Over half of the sample was female (female = 69.0%, male = 31.0%). Participants identified as Caucasian (37.8%), Asian American (30.7%), Hispanic (20.8%), or African American (10.1%).
2.2 Procedure
Participants in this study were part of an internet-based daily diary study on stress and coping. Recruitment strategies included flyers, course/club presentations, and university seminars. After informed consent, participants completed a demographics survey and FFM measure. For five days, each participant completed a measure of affect using an internet-based daily diary. At the final point of data collection, respondents were administered measures of depression, anxiety, self-esteem, and coping efficacy. Participants received $25 for taking part.
2.3 Materials
International Personality Item Pool
(Goldberg, 1999). The FFM was assessed using the 50-item version wherein each dimension (Emotional Stability, Extraversion, Openness, Agreeableness, and Conscientiousness) is comprised of ten items. Participants rated how accurately each item described them on a 5-point scale (1 = very inaccurate, 5 = very accurate); higher total scores indicate higher levels of each trait. Cronbach’s alphas indicated adequate reliability (Emotional Stability: α =.87, Extraversion: α =.88, Openness: α =.80, Agreeableness: α =.74, Conscientiousness: α =.82). Because the Emotional Stability factor is measured such that higher scores indicate greater stability, it was reverse scored so that higher scores indicated lesser stability (i.e., higher Neuroticism), and will be referred to as Neuroticism in the analyses to correspond with FFM terminology.
Positive and Negative Affect Schedule
(Watson, Clark, & Tellegen, 1988). Affect was measured using 20 adjectives (e.g., excited, distressed) that are rated with regard to how one feels at that moment from (1 = very slightly, 5 = very much). Two scale scores were yielded for positive affect and negative affect by summing each scale’s items; higher scores reflect greater affect. For the current study, each respondents’ score was created by pooling across the 5 days of data collection. Reliability was good (positive affect: α = .92, negative affect: α = .89).
Brief Symptom Inventory
(Derogatis & Spencer, 1982). Depression and anxiety were assessed using the respective dimensions of the BSI. Respondents rated the extent to which a symptom bothered them over the previous 5 days on a 5-point scale (0 = not at all, 4 = extremely); higher scores indicate higher levels of anxiety/depression. Reliability was good (anxiety: α = .83 depression: α = .85).
State Self-Esteem Scale
(Heatherton & Polivy, 1991). Self-esteem was measured via 20 statements (e.g., I feel confident about my abilities) that respondents rated their agreement with on a 5-point scale (1 = not at all, 5 = extremely); higher scores indicate greater self-esteem. Reliability was excellent (α = .92).
Coping Efficacy
The belief about one’s ability to handle stressful situations was measured using 8 items (e.g., Overall, how successful have you been in handling your problems?) adapted from Sandler, Tein, Mehta, Wolchik, and Ayers (2000). Each item was rated on a 4-point scale (1 = not at all, 4 = very); higher scores indicate higher efficacy. Reliability was good (α = .88).
2.4 Data Analysis
LPA (Lanza, Flaherty, & Collins, 2003) was used to derive categorical latent variables that represent classes of individuals who share similar FFM profiles. LPA is an empirically driven method that defines taxonomies or classes of people based on common characteristics. LPA uses all observations of the continuous dependent variable (e.g., the 5 scale scores of the IPIP) to define these classes via maximum likelihood estimation (Little & Rubin, 1987). The probability that an individual was properly classified, which enables each person to be categorized into the best-fitting class, is estimated simultaneously with the overall model (Hill, Degnan, Calkins, & Keane, 2006). Models are estimated with classes added iteratively to determine which model is the best fit to the data. For this study, LPA was conducted using MPlus 5.1 (Muthén & Muthén, 2006). To determine the optimal number of classes for the sample, each model was evaluated using the Lo-Mendell-Rubin Adjusted Likelihood Ratio Test (LMRT; Lo, Mendell, & Rubin, 2001), the Bootstrapped Likelihood Ratio Test (BLRT; Arminger, Stein & Wittenberg, 1999; McLachlan & Peel, 2000), Akaike information criteria (AIC; Akaike, 1974), and sample size-adjusted Bayesian information criteria (sBIC; Schwarz, 1978). The LMRT and the BLRT compare the fit of a target model (e.g., 2 class model) to a comparison model which specifies one less class (e.g., 1 class model). The p-value generated for the LMRT and BLRT indicates whether the solution with more classes (p < .05) or less classes (p > .05) fits better. The AIC and sBIC are descriptive fit indices wherein smaller values indicate better model fit. In addition to these indices, each model was evaluated on their interpretability to determine whether the classes truly represented different categories, rather than being an artifact of a nonnormal distribution (Muthén, 2006). It should be noted that small classes (those that contain less than 5% of the sample) are typically considered spurious classes, a condition often associated with extracting too many classes/profiles (Hipp & Bauer, 2006), therefore class size was also considered when determining the optimal number of classes.
After substantive interpretation of each class from the best-fitting solution, multilevel regression and ANOVA were used to examine the association between class membership and the validity measures. Because positive and negative affect consisted of repeated observations, multilevel regression was conducted using HLM6 (Raudenbush, Bryk, &Congdon, 2004). For these analyses, the reduction in the proportion of variance explained (or error) index is presented as an indicator of effect size. This index is analogous to R2 from linear regression (see Nezlek, 2001, for a full discussion of this index). In addition, a series of ANOVAs were conducted to evaluate potential differences on self-esteem, depression, anxiety, coping efficacy as a function of profile. A Bonferroni correction was used for all follow-up tests using a familywise error rate of .05 per validity measure.
3. Results
3.1 Latent Profile Analysis
Latent profile models containing 1, 2, 3, and 4 classes were fit to the data. The model fit indices for each LPA are available in Table 1. The LMRT and BLRT indicated that the 2-class solution fit better than the 1-class solution (p < .001). The 3-class solution was deemed superior to the 2-class solution due to a significant LMRT value (p = .026) and BLRT value (p < .001), and lower AIC and sBIC values. Although the 4-class solution revealed slightly lower AIC and sBIC values, and a statistically significant BLRT value (p = .03), the LMRT indicated that it was not statistically different from the 3-class solution (p = .098). Moreover, the 4-class solution yielded a class size that was too small to be of substantive value (6 individuals for 1.6% of the sample. Therefore, the 3-class solution was considered the best fit to the data.
Table 1.
Model fit indices
| Solution | LMRT (p) | BLRT (p) | AIC | sBIC |
|---|---|---|---|---|
| 1 class | 3652.71 | 3660.15 | ||
| 2 class | 128.58 (< .001) | 132.20 (< .001) | 3532.51 | 3544.40 |
| 3 class | 32.18 (.026) | 33.09 (< .001) | 3511.42 | 3527.78 |
| 4 class | 20.73 (.098) | 21.31 (= .03) | 3502.11 | 3522.93 |
Note. LMRT = Lo-Mendell-Rubin Test, BLRT = Bootstrapped Lo-Mendell Rubin Test, AIC = Akaike Information Criterion, sBIC = sample size-adjusted Bayesian Information Criterion
The overall sample means and conditional response means used to substantively interpret each class are available in Table 2 and illustrated in Figure 1. Class 1 composed 49.3% of the sample (n = 183) and represents individuals with relatively low levels of Neuroticism, and relatively high levels of Extraversion, Agreeableness, and Openness. Accordingly, this profile was referred to as “well-adjusted”. Class 2 composed 28.3% of the sample (n = 105) and was termed “reserved” because it comprised individuals with the lowest levels of Extraversion, moderate Neuroticism, and relatively low Agreeableness, and Openness. Class 3 composed 22.4% of the sample (n = 83) and was characterized by individuals who reported the highest Neuroticism and Extraversion, but also a relatively high level of Openness, and was referred to as “excitable”.
Table 2.
Overall sample means (SD) and FFM profile conditional response means (SD)
| n | N | E | O | A | C | |
|---|---|---|---|---|---|---|
| Sample 3-class solution |
371 | 2.93 (.77) | 3.36 (.74) | 3.64 (.60) | 4.00 (.50) | 3.54 (.66) |
| Class 1 | 183 | 2.38 (.97) | 3.60 (.80) | 3.78 (.70) | 4.19 (.51) | 3.72 (.66) |
| Class 2 | 105 | 3.21 (.74) | 2.65 (1.35) | 3.23 (.78) | 3.60 (.82) | 3.29 (.85) |
| Class 3 | 83 | 3.69 (.93) | 3.74 (1.04) | 3.84 (.91) | 4.10 (.72) | 3.50 (.92) |
Note. N = Neuroticism; E = Extraversion; O = Openness; A = Agreeableness; C = Conscientiousness
Figure 1.
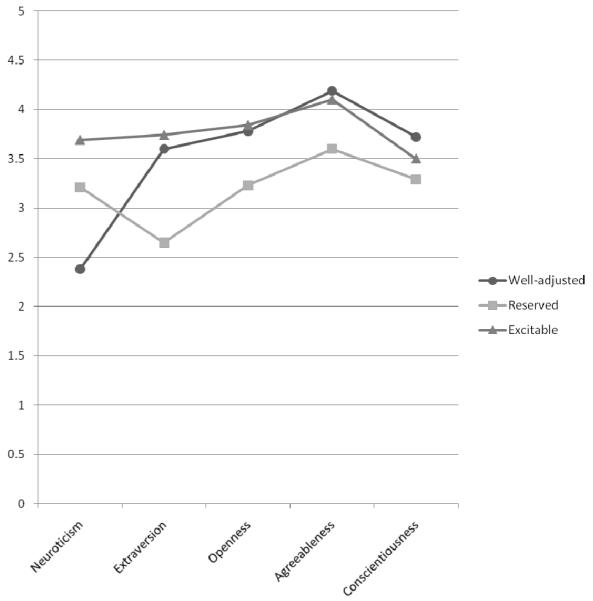
Conditional response means of the 3-class solution using the FFM
3.2 Validation analysis: Association of latent profiles with psychological outcomes
Multilevel linear regression with a dummy coding system was used to examine differences among the three classes on the repeated measures outcomes of positive and negative affect. Each regression was run twice for each outcome with class 1 (well-adjusted) serving as the reference group in the first equation, and class 3 (excitable) serving as the reference group in the second equation. The unstandardized regression coefficients for the multilevel model predicting positive affect indicated that the well-adjusted group reported significantly higher positive affect than the reserved (b = −0.43, SE = .08, p < .001) and excitable (b = −0.29, SE = .10, p < .001) groups (R2 = .067). For negative affect, respondents in the well-adjusted group were significantly lower than the reserved (b = 0.17, SE = .07, p < .001) and excitable (b = 0.28, SE = .08, p < .001) groups (R2 = .044).
ANOVA was used to examine differences among the three profiles on the psychological outcomes of depression, anxiety, self-esteem, and coping efficacy. As shown in Table 3, significant differences were found between profiles for all 4 validity measures. Post-hoc comparisons revealed significant differences between some personality groups. Self-esteem scores were significantly higher for the well-adjusted group compared to the reserved (d = .98) and excitable (d = .72) groups. Depression scores were significantly lower for the well-adjusted group compared to the reserved (d = −.76) and excitable (d = −1.14) groups. Similarly, anxiety scores were significantly lower for the well-adjusted group compared to the reserved (d = −.77) and excitable (d = −1.18) groups. However, anxiety scores were also significantly lower for the reserved group relative to the excitable group (d = −.39). Coping efficacy scores were also significantly higher for the well-adjusted group relative to the reserved (d = 1.07) and excitable (d = .71) groups.
Table 3.
Comparison of FFM classes on single time-point psychological outcomes
| Outcome | F | df | p η 2 | M (SD) | ||
|---|---|---|---|---|---|---|
| Well-Adjusted | Reserved | Excitable | ||||
|
|
||||||
| Self-Esteem | 36.00* | 2, 368 | .16 | 3.70(.62) | 3.05(.70) | 3.20(.76) |
| Depression | 41.86* | 2, 368 | .19 | 0.64(.64) | 1.28(1.00) | 1.54(.92) |
| Anxiety | 47.49* | 2, 368 | .21 | 0.56(.57) | 1.10(.81) | 1.43(.87) |
| Coping efficacy | 40.59* | 2, 368 | .18 | 3.34(.45) | 2.84(.48) | 2.99(.53) |
Note. pη2 = partial eta-squared from omnibus ANOVA
p < .05
4. Discussion
In the present study, LPA was used to identify groups of individuals with similar personality profiles. Three subtypes emerged, and the profiles were validated using measures of positive affect, negative affect, self-esteem, depression, anxiety, and coping efficacy.
The largest class, termed well-adjusted, was low on Neuroticism, and moderately high on the other four factors. In general, those who were well-adjusted were characterized by emotional stability, gregariousness and activity, cooperativeness, and self-control. These individuals could be compared to the Resilient subtype described by Herzberg and Roth (2006). A well-adjusted individual’s high Extraversion may buffer against the anhedonia and lethargy, and lower Neuroticism may enable them to flourish despite environmental stressors. These individuals also reported being quite Open; considering McCrae and Costa’s (1991) suggestion that greater Openness leads to a stronger experience of both internal and external worlds (for better or worse), it could be speculated that a person with this profile may be apt to experience their other traits more strongly.
The reserved group reported moderately high levels of Neuroticism and Conscientiousness, but lower levels of Extraversion, Openness, and Agreeableness. That is, individuals who were characterized as reserved reported lower activity and gregariousness, a cautious, cooperative demeanor, and also moderate levels of emotional stability and self-control; these characteristics are similar in profile to Overcontrollers (Herzberg & Roth, 2006). These traits suggest that a person with this profile is likely to enjoy alone time, place a greater emphasis on their inner world, and be more cautious (McCrae & Costa, 1987). Such individuals may prefer to have only a couple of close social ties (Asendorpf et al., 2001).
The excitable group was best described by the highest levels of Neuroticism, Extraversion, and Openness. Based on their personality profile, those who fit into the excitable group had relatively high emotional instability, gregariousness, activity, and openness, akin to Undercontrollers (Herzberg & Roth, 2006). As such, an excitable person is likely to be full of energy and assertive, but they may also respond more dramatically to stressful events. Also, given an excitable individual’s Openness, it should be noted that their other traits may be somewhat intensified (McCrae & Costa, 1991).
On the validity analyses, well-adjusted individuals yielded higher positive affect and lower negative affect compared to the reserved and excitable groups, although the effects were small. This is consistent with prior research (e.g., McCrae & Costa, 1991) and does not suggest that reserved and excitable people are necessarily unhappier, but rather that they outwardly express fewer positive emotions, and possibly more negative emotions. Additionally, the well-adjusted group reported other indicators of good mental health such as higher confidence, and beliefs about managing stress, and also fewer depressive and anxious symptoms. Although the excitable and reserved groups were relatively similar in terms of self-esteem, coping efficacy, and depression, excitable individuals reported significantly more anxiety compared to the reserved group. This suggests that excitable individuals are more anxious than reserved individuals, and thus the two trait profiles have different predictive utility.
Taken together, these findings serve as a preliminary investigation using LPA to summarize the synergistic relationships of the FFM dimensions to (1) describe distinct personality profiles, and (2) validate those profiles using other important psychological constructs. Three profiles emerged, with two of the profiles (i.e., reserved and excitable) being associated with poorer outcomes. However, this should be interpreted with caution, given the relatively large proportion of the sample (approximately 25% each) represented by the two profiles. Because FFM traits are broad by definition, it may be most appropriate to suggest that the trait clusters described here denote vulnerabilities, rather than expected outcomes. Despite having relatively similar predictions about affect, self-esteem, and depression, the two profiles demonstrated discriminant validity on anxiety. This suggests that the two profiles are meaningfully different, and highlights the importance of the multiplicative influences of the five dimensions.
Limitations for the current study include using a convenience sample of college students, self-report measures, and a cross-sectional design which precludes conclusions about personality as a causal mechanism of mental health outcomes. Despite these limitations, this study provides an example of how LPA can be used to model commonalities among personality variables.
Acknowledgements
This research was supported by grant number MH065515 from the National Institute of Mental Health.
References
- Akaike H. A new look at the statistical model identification. IEEE Transactions on Automatic Control. 1974;19:716–723. [Google Scholar]
- Arminger G, Stein P, Wittenberg J. Mixtures of condition mean- and covariance—structure models. Psychometrika. 1999;64:475–494. [Google Scholar]
- Asendorpf JB, Borkenau P, Ostendorf F, van Aken MA. Carving personality description at its joints: Confirmation of three replicable personality prototypes for both children and adults. European Journal of Personality. 2001;15:169–198. [Google Scholar]
- Besser A, Shackelford TK. Mediations of the effects of the Big Five personality dimensions on negative mood and confirmed affective expectations by perceived situational stress: A quasi-field study of vacationers. Personality and Individual Differences. 2007;42:1333–1346. [Google Scholar]
- Brown TA, Chorpita BF, Barlow DH. Structural relationships among dimensions of the DSM–IV anxiety and mood disorders and dimensions of negative affect, positive affect, and autonomic arousal. Journal of Abnormal Psychology. 1998;107:179–192. doi: 10.1037//0021-843x.107.2.179. [DOI] [PubMed] [Google Scholar]
- Chaplin WF. Personality, interactive relations, and applied psychology. In: Hogan R, Johnson JA, Briggs SR, editors. Handbook of personality psychology. Academic Press; San Diego, CA: 1997. pp. 873–890. [Google Scholar]
- Clark LA, Watson D, Mineka S. Temperament, personality, and the mood and anxiety disorders. Journal of Abnormal Psychology. 1994;103:103–116. [PubMed] [Google Scholar]
- Cohen J, Cohen P, West SG, Aiken LS. Applied multiple regression/correlation analysis for the behavioral sciences. 3rd ed. Erlbaum; Hillsdale: 2003. [Google Scholar]
- Derogatis LR, Spencer PM. The Brief Symptom Inventory (BSI): Administration, scoring, and procedures manual--I. Division of Medical Psychology, Johns Hopkins University School of Medicine; Baltimore, MD: 1982. [Google Scholar]
- DeYoung CG, Peterson JB, Higgins DM. Higher-order factors of the Big Five predict conformity: Are there neuroses of health? Personality and Individual Differences. 2002;33:533–552. [Google Scholar]
- Digman JM. Higher-order factors of the Big Five. Journal of Personality and Social Psychology. 1997;73:1246–1256. doi: 10.1037//0022-3514.73.6.1246. [DOI] [PubMed] [Google Scholar]
- Ekehammar B, Akrami N. The relation between personality and prejudice: a variable-and a person centred approach. European Journal of Personality. 2003;17:449–464. [Google Scholar]
- Enns MW, Cox BJ. Personality dimensions and depression: Review and commentary. Canadian Journal of Psychiatry. 1997;42:274–284. doi: 10.1177/070674379704200305. [DOI] [PubMed] [Google Scholar]
- Eysenck HJ. Four ways five factors are not basic. Personality and Individual Differences. 1992;13:667–673. [Google Scholar]
- Eysenck HJ. The place of anxiety and impulsivity in a dimensional framework. Journal of Research in Personality. 1987;21:489–492. [Google Scholar]
- Gershuny BS, Sher KJ. The relation between personality and anxiety: Findings from a 3-year prospective study. Journal of Abnormal Psychology. 1998;107:252–262. doi: 10.1037//0021-843x.107.2.252. [DOI] [PubMed] [Google Scholar]
- Goldberg LR. A broad-bandwidth, public-domain, personality inventory measuring the lower-level facets of several five-factor models. In: Mervielde I, Deary I, De Fruyt F, Ostendorf F, editors. Personality psychology in Europe. Vol. 7. Tilburg University Press; Tilburg, The Netherlands: 1999. pp. 7–28. [Google Scholar]
- Hayes N, Joseph S. Big 5 correlates of three measures of subjective wellbeing. Personality and Individual Differences. 2003;34:723–727. [Google Scholar]
- Heatherton TF, Polivy J. Development and validation of a scale for measuring state self-esteem. Journal of Personality and Social Psychology. 1991;60:895–910. [Google Scholar]
- Herzberg PY, Hoyer J. Personality prototypes in adult offenders. Criminal Justice and Behavior. 2009;36:259–274. [Google Scholar]
- Herzberg PY, Roth M. Beyond resilients, undercontrollers, and overcontrollers? An extension of personality prototype research. European Journal of Personality. 2006;20:5–28. [Google Scholar]
- Hill AL, Degnan KA, Calkins SD, Keane SP. Profiles of externalizing behavior problems for boys and girls across preschool: The roles of emotion regulation and inattention. Developmental Psychology. 2006:42. doi: 10.1037/0012-1649.42.5.913. [DOI] [PubMed] [Google Scholar]
- Hipp JR, Bauer DJ. Local solutions in the estimation of growth mixture models. Psychological Methods. 2006;11:36–53. doi: 10.1037/1082-989X.11.1.36. [DOI] [PubMed] [Google Scholar]
- Jorm AF, Christensen H, Henderson AS, Jacomb PA, Korten AE, Rodgers B. Predicting anxiety and depression from personality: Is there a synergistic effect of neuroticism and extraversion? Journal of Abnormal Psychology. 2000;109:145–149. doi: 10.1037//0021-843x.109.1.145. [DOI] [PubMed] [Google Scholar]
- Kotov R, Gamez W, Schmidt S, Watson D. Linking “Big” personality traits to anxiety, depressive, and substance use disorders: A meta-analysis. Psychological Bulletin. 2010;136:768–821. doi: 10.1037/a0020327. [DOI] [PubMed] [Google Scholar]
- Lanza ST, Flaherty BP, Collins LM. Latent class and latent transition analysis. In: Schinka JA, Velicer WA, editors. Handbook of psychology: Research methods in psychology. Wiley; New York, NY: 2003. pp. 663–685. [Google Scholar]
- Lanza ST, Rhodes BL, Nix RL, Greenberg MT. Modeling the interplay of multilevel risk factors for future academic and behavior problems: A person-centered approach. Development and Psychopathology. 2010;22:313–335. doi: 10.1017/S0954579410000088. [DOI] [PMC free article] [PubMed] [Google Scholar]
- Little RJ, Rubin DB. Statistical analysis with missing data. Wiley; New York, NY: 1987. [Google Scholar]
- Lo Y, Mendell N, Rubin D. Testing the number of components in a normal mixture. Biometrika. 2001;88:767–778. [Google Scholar]
- Martel MM, Goth-Owens T, Martinez-Torteya C, Nigg JT. A person-centered personality approach to heterogeneity in attention-deficit/hyperactivity disorder (ADHD) Journal of Abnormal Psychology. 2010;119:186–196. doi: 10.1037/a0017511. [DOI] [PMC free article] [PubMed] [Google Scholar]
- McCrae RR, Costa PT. Validation of the five-factor model of personality across instruments and observers. Journal of Personality and Social Psychology. 1987;52:81–90. doi: 10.1037//0022-3514.52.1.81. [DOI] [PubMed] [Google Scholar]
- McCrae RR, Costa PT. Adding liebe und arbeit: The full five factor model and well-being. Personality and Social Psychology Bulletin. 1991;17(2):227–232. [Google Scholar]
- McCrae RR, Costa PT. Personality trait structure as a human universal. American Psychologist. 1997;52:509–516. doi: 10.1037//0003-066x.52.5.509. [DOI] [PubMed] [Google Scholar]
- McFatter RM. Interactions in predicting mood from extraversion and neuroticism. Journal of Personality and Social Psychology. 1994;66:570–578. doi: 10.1037//0022-3514.66.3.570. [DOI] [PubMed] [Google Scholar]
- McLachlan GJ, Peel D. Finite mixture models. John Wiley; New York, NY: 2000. [Google Scholar]
- Muthén B. Should substance use disorders be considered as categorical or dimensional? Addiction. 2006;101:6–16. doi: 10.1111/j.1360-0443.2006.01583.x. [DOI] [PubMed] [Google Scholar]
- Muthén L, Muthén B. Mplus User’s Guide. 4th Ed. Los Angeles, CA: 2006. [Google Scholar]
- Nezlek JB. Multilevel random coefficient analyses of event- and interval-contingent data in social and personality psychology research. Personality and Social Psychology Bulletin. 2001;27:771–785. [Google Scholar]
- Raudenbush S, Bryk A, Congdon R. HLM for Windows. 2004. Version 6.06. [Google Scholar]
- Robins RW, John OP, Caspi A. The typological approach to studying personality. In: Cairns RB, Bergman L, Kagan J, editors. Methods and models for studying the individual. Sage; Thousand Oaks, CA: 1998. pp. 135–160. [Google Scholar]
- Sandler IN, Tein JY, Mehta P, Wolchik S, Ayers T. Coping efficacy and psychological problems in children of divorce. Child Development. 2000;71:1099–1118. doi: 10.1111/1467-8624.00212. [DOI] [PubMed] [Google Scholar]
- Schwarz G. Estimating the dimension of a model. Annals of Statistics. 1978;6:461–464. [Google Scholar]
- Swickert RJ, Hittner JB, Foster AA. Big Five traits interact to predict perceived social support. Personality and Individual Differences. 2010;48:736–741. [Google Scholar]
- Watson D, Clark LA. On traits and temperament: General and specific factors of emotional experience and their relation to the five-factor model. Journal of Personality. 1992;60:441–476. doi: 10.1111/j.1467-6494.1992.tb00980.x. [DOI] [PubMed] [Google Scholar]
- Watson D, Clark LA, Tellegen A. Development and validation of brief measures of positive and negative affect: The PANAS scales. Journal of Personality and Social Psychology. 1988;54:1063–1070. doi: 10.1037//0022-3514.54.6.1063. [DOI] [PubMed] [Google Scholar]