

Abstract
Background
Skin lesion color is an important feature for diagnosing malignant melanoma. New basis function correlation features are proposed for discriminating malignant melanoma lesions from benign lesions in dermoscopy images. The proposed features are computed based on correlating the luminance histogram of melanoma or benign labeled relative colors from a specified portion of the skin lesion with a set of basis functions. These features extend previously developed statistical and fuzzy logic-based relative color histogram analysis techniques for automated mapping of colors representative of melanoma and benign skin lesions from a training set of lesion images.
Methods
Using the statistical and fuzzy logic-based approaches for relative color mapping, melanoma and benign color features are computed over skin lesion region of interest, respectively. Luminance histograms are obtained from the melanoma and benign mapped colors within the lesion region of interest and are correlated with a set of basis functions to quantify the distribution of colors. The histogram analysis techniques and feature calculations are evaluated using a data set of 279 malignant melanomas and 442 benign dysplastic nevi images.
Results
Experimental test results showed that combining existing melanoma and benign color features with the proposed basis function features found from the melanoma mapped colors yielded average correct melanoma and benign lesion discrimination rates as high as 86.45% and 83.35%, respectively.
Conclusions
The basis function features provide an alternative approach to melanoma discrimination that quantifies the variation and distribution of colors characteristic of melanoma and benign skin lesions.
Keywords: image processing, color, malignant melanoma, histogram, fuzzy logic, basis function
A significant number of malignant melanomas, especially early melanomas curable by excision, are not diagnosed correctly in the clinical setting (1–4). The diagnostic sensitivity reported for unaided dermatologist observers ranges from a low of about 66% to about 81% (1–3, 5). Diagnostic accuracy for non-dermatologists is believed to be lower. The relatively low diagnostic sensitivity of dermatologist and nondermatologist detection of malignant melanoma demonstrates the uncertainty involved in skin lesion analysis. Paramount in the process of skin lesion analysis is the identification of features that can be consistently interpreted by dermatologists and non-dermatologists in the recognition of abnormal skin lesions.
Color is an important skin lesion feature for detecting malignant melanoma (4, 6–15). Many color descriptors have been applied to melanoma detection, including variation of hues (7), analytical color techniques for detecting color variegation (8), red, green, and blue (rgb) color channel statistical parameters (16–18), spherical color coordinates and (L, a*, b*) color coordinate features (9), percentage of the skin lesion containing absolute shades of reddish, bluish, grayish, and blackish areas and the number of those color shades present within the skin lesion (10). Color quantization for the different color shades examined in Ganster et al. (10) was performed using the median cut color quantization algorithm (11).
There are two primary difficulties associated with melanoma detection based on color. First, the colors considered characteristic of melanoma vary with imaging techniques. Second, colors characteristic of melanomas vary with skin pigmentation and melanoma types. The use of relative color (19), in which the average background skin color is subtracted from each lesion pixel, can compensate for color changes due to different skin types as well as to lighting and digital imaging techniques (19).
In previous research, statistical and fuzzy logic relative color histogram analysis techniques were investigated for color labeling to facilitate the calculation of percent melanoma color and fuzzy ratio measures, respectively, for clinical (12–14) and dermoscopy (15) skin lesion images. The statistical method, as applied to dermoscopy images, is presented in detail in Stanley et al. (15) and is summarized in the following steps: (1) obtain separate training and test sets of skin lesion images, (2) initialize separate cumulative relative color histograms for melanoma and benign lesions for the training set of lesions, (3) perform steps 4–8 for each training lesion, (4) compute the lesion's average rgb surrounding skin color and subtract this value from the color value at each pixel within the lesion to generate a relative color representation for the lesion, (5) requantize the relative rgb color values by dividing the values by a factor of 4, (6) generate a histogram using the requantized rgb values for mapping the relative colors to the histogram bins, (7) determine populated histogram bins based on the percentage of lesion area that each bin contains, (8) increment-populated histogram bins in the melanoma cumulative histogram for melanomas and benign cumulative histogram for benign lesions, (9) compute the probability of each histogram bin as being a melanoma color or a benign color using cumulative histograms, (10) compare the melanoma and benign probabilities at each corresponding bin to assign a color label to that bin as a melanoma color, a benign color, an unknown color (equal melanoma and benign probability), or unpopulated (no melanoma or benign lesions with relative colors mapping to the histogram bin), (11) iteratively region grow the color labels to the unpopulated histogram bins using an extrapolation technique to generate the final cumulative histogram bin melanoma and benign color labels, (12) repeat steps 13–16 for each training set lesion, (13) select a region of interest inside of the lesion, (14) perform steps 4–5 above over the selected region of interest, (15) count the number of pixels within the region of interest with requantized relative color values that are labeled as melanoma colors from the final color labeled histogram bins found in step 11, (16) compute the percent melanoma color feature by dividing the number of pixels in step 14 by the area of the lesion region of interest, and (17) repeat steps 13–16 for each test set lesion.
Details for determining the lesion surrounding rgb skin color (rskin, gskin, and bskin) and relative color for pixels within the skin lesion (rrel(x, y), grel(x, y), and brel(x, y)) are given in detail in Stanley et al.(14, 15). Relative color values can take on the integer values in the range [−255, 255]. Therefore, the relative color histogram has 5113 total bins. Dividing the 511 relative colors by 4 results in histogram bins containing 4 × 4 × 4 relative colors, except for some bins on the edges of the cube that are 4 × 4 × 3 and one bin in the corner of the cube that is 3 × 3 × 3. Figure 1 shows the relative color space with a labeled bin of dimension 4 × 4 × 4 and its three-color bin edges, where each relative color bin edge consists of four color levels.
Fig. 1.
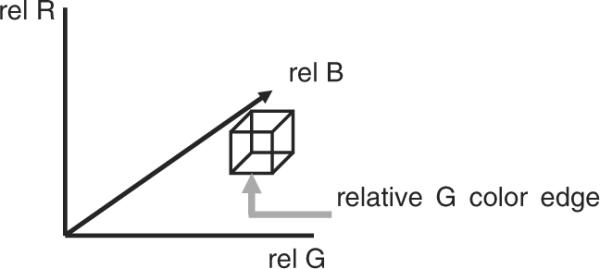
Relative rgb space showing one bin of dimension 4 × 4 × 4 and its three-color bin edges.
The fuzzy logic method is presented in detail in (14) and is summarized in the following steps: (1) obtain separate training and test sets of skin lesions, (2) initialize a cumulative relative color histogram for benign lesions for the training set of lesions, (3) perform steps 4–7 for each training benign lesion, (4) compute the lesion's average rgb surrounding skin color and subtract this value from the color value at each pixel within the lesion to generate a relative color representation for the lesion, (5) requantize the relative rgb color values by dividing the values by a factor of 4, (6) generate a histogram using the requantized rgb values for mapping the relative colors to the histogram bins, (7) add the bin counts for the lesion to the corresponding bin counts in the cumulative histogram, (8) compute a secondary histogram from the cumulative histogram, (9) determine a fuzzy set B and associated membership values μB based on the secondary histogram to quantize the degree of association of each relative color histogram bin as a benign color (see description below), (10) iteratively aggregate the membership values to the histogram bins with zero membership to generate the final relative color histogram bin benign color membership values, (11) repeat steps 12–16 for each training set lesion, (12) select a region of interest inside of the lesion, (13) perform steps 4–5 above over the selected region of interest, (14) determine the number of pixels within the region of interest with requantized relative color values that have membership value μB greater than or equal a specified α (α-cut), (15) determine the number of pixels within the region of interest with requantized relative color values that have non-zero membership value μB, (16) compute the fuzzy ratio as the ratio of number of pixels found from steps 10 and 11, 17) repeat steps 12–16 for each test set lesion.
From the fuzzy logic method description, B is a fuzzy set with a trapezoidal membership function for relative skin lesion color, for benign color (14). The secondary histogram, given in step 5, is a function of t which indicates the number of bins of the three-dimensional relative color histogram that are populated with t lesion pixels summed over all benign images in the training set. A more detailed description of the secondary histogram as used for generating the trapezoidal membership function μB is given in (14). For secondary histogram bin frequency count t, the membership function μB(t) denoting the fuzzy set B is given as
| (1) |
F is determined as the frequency count such that 5% of the total bins comprising the secondary histogram have frequency F or greater, and t represents the number of hits in a bin over the training set of benign images (14).
In this research, new basis function correlation features are proposed. Using a training set of dermoscopy lesion images, color mappings are determined for melanoma and benign colors determined from statistical (15) and fuzzy logic (14) approaches overviewed above, respectively. Luminance histograms are determined from the melanoma and benign mapped colors within a skin lesion area of interest, respectively, and are correlated with a set of weighted density distribution (WDD) basis functions (20–22) for feature calculations.
The remaining sections of the paper include: (1) an overview of the dermoscopy image data set examined, (2) feature calculation methodology using the statistical approach and fuzzy logic approaches, (3) an overview of the lesion region of interest analysis, (4) experiments performed, (5) results and discussion, and (6) conclusions.
Methodology
Dermoscopy image data
This research uses dermoscopy images consisting of digitized red, green, blue (rgb) color skin lesion images, with a typical size of 1024 × 768 pixels. The data set includes 279 malignant melanoma images, confirmed by histopathology, and 442 dysplastic nevus (benign) dermoscopy images selected at random from 2000 lesions in the EDRA interactive Atlas of Dermoscopy (23), Skin Cancer and Associates (Plantation, FL, USA) and the Dermatology Associates of Tallahassee, FL. The melanomas are all invasive malignant melanomas, with no melanomas in situ. Figure 2 shows image examples from the image data set of a malignant melanoma (a) and a benign (dysplastic nevus) lesion (b).
Fig. 2.

Dermoscopy image examples of melanoma and benign lesions. (a) Melanoma image. (b) Benign image (dysplastic nevus).
Skin lesion border determination
In this research, skin lesion borders are found by a dermatologist manually, with points chosen along the border and joined in a closed curve that minimizes the second derivative of the associated function (spline curve) (24). Borders obtained with this approach have been used in several skin lesion feature analysis studies (9, 12–15, 25, 26).
Statistical color mapping technique
The color feature obtained using the statistical mapping approach overviewed in the previous section is the percent melanoma color (15). Formally, the percentage of melanoma color for a lesion is given as D = 100E/A, where E is the number of pixels within the lesion region of interest with relative colors that map into melanoma bins and A is the area of the lesion region of interest. For this study, in addition to calculating D over the lesion region of interest, the histogram of luminance values for the requantized relative colors that map into melanoma bins is determined and is denoted as Γ. Γ is correlated with the set of basis functions presented in `Methodology.' E for basis function correlation calculations.
Fuzzy logic color mapping technique
The fuzzy color ratio for a skin lesion is given as R(α)=S(α)/V based on the fuzzy logic method overviewed in the introductory section (14). S(α) is the total number of pixels within the skin lesion region of interest with requantized relative color values over the lesion region of interest with μB greater than or equal to a specified α. V includes all of the pixels within the skin lesion region of interest that have a non-zero membership value in B. For this study, in addition to calculating R(α) over the lesion region of interest, the histogram of luminance values of requantized relative colors with μB greater than or equal to a specified a and is denoted as Π. Π is correlated with the set of basis functions presented in `Methodology.' E for basis function correlation feature calculations.
Basis function correlation features
Correlation features are introduced in this research for quantifying the variation and distribution of melanoma and benign labeled colors, represented as luminance values, within the lesion region of interest. The basis function features for a lesion are computed by correlating the luminance histograms, Γ and Π, determined based on the statistical and fuzzy logic methods, respectively, with a set of WDD basis functions (20), which are shown in Fig. 3.
Fig. 3.

WDD functions used for computing correlation-based features (20). WDD, weighted density distribution.
Twelve WDD-based features are computed. Each of the WDD functions is decomposed into 128 discrete points for point-to-point correlation with the luminance histograms corresponding to the melanoma or benign labeled colors present within the lesion region of interest. Based on the relative color histogram bin quantization, the range of the luminance values for computing the luminance histogram is from −63 to 64, giving a total of 128 histogram bins. The melanoma and benign color mappings were derived from the training set of images, for the statistical and fuzzy-based approaches, respectively. Let W1 denote the WDD function in Fig. 3(a), W2 denote the WDD function in Fig. 3(b) and so on. For a skin lesion with color mapping performed using the statistical approach, six WDD features (fΓ,1,…, fΓ,6) are computed using the luminance histogram Γ according to the expression
| (2) |
for k = 1, 2, …, 6. Note that the luminance histogram contains 128 bins (−63 through 64) with frequency of occurrence values. The WDD functions were adjusted to have 128 points that were point-to-point correlated and multiplied with the WDD functions, with the feature values as the sums of the point-to-point multiplications. Six additional features (fΓ,7, … , fΓ,12) are computed by correlating the six WDD functions with the sequence of absolute differences between of the histogram frequencies for consecutive luminance values as follows:
| (3) |
for k = 7, 8, …, 12, where Γ (−1) = 0. Similar features are computed from the luminance histogram Π obtained using the fuzzy logic approach based on benign lesion color and are denoted as (fΠ,1, −, fΠ,12).
Lesion region analysis
Color mapping is performed using the statistical and fuzzy-based approaches from a training set of images over different regions of the skin lesion for skin lesion discrimination. The skin lesion regions are referenced as the boundary area percentage. The boundary area percentage is defined as the uniform skin lesion region from the boundary to the interior that contains a specified percentage of the lesion area. The boundary area region is found by iteratively growing from the lesion boundary toward the lesion center. Starting with the lesion boundary, all eight-connected neighbors of each boundary pixel located in the lesion interior are identified. A cumulative count of all uniquely identified interior pixels is maintained. The resulting cumulative count is compared to the desired area percentage. If the area percentage is met or exceeded, region growing is stopped. Otherwise, the uniquely identified interior pixels become the new inner lesion border. From the new inner border, the unique eight-connected interior border pixels are found and are added to the cumulative count of boundary area pixels. The process continues until the area percentage criterion has been satisfied. Figure 4 shows an example with the boundary area percentage (dark) of 25% of the lesion area. This area is used for feature calculations, and the remaining 75% of the lesion interior is excluded from feature calculations.
Fig. 4.
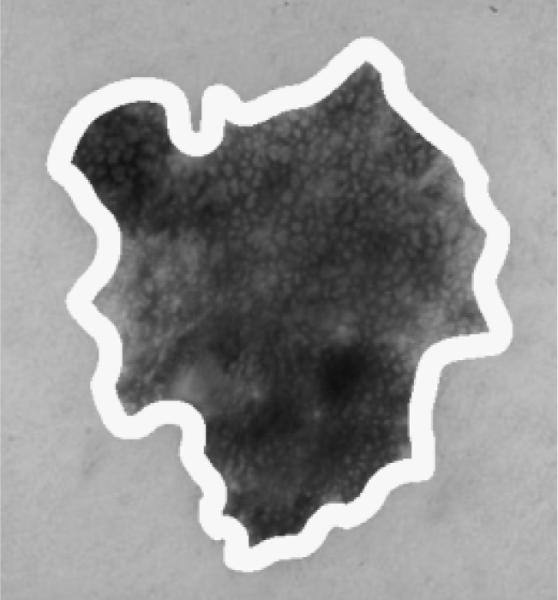
Boundary area percentage example using 25% of the lesion area for analysis (white region) [This is the same lesion as in Fig. 1(a)].
Experiments Performed
For this research, there were 279 melanoma and 442 benign dermoscopy images for analysis. Experiments were performed using 10 randomly generated training and test sets to compare the melanoma discrimination capability of the percent melanoma color (D), fuzzy ratio [R(α)], and the basis function correlation features computed from the luminance histogram based on the mapped melanoma colors from the statistical approach [fΓ,1(t), …, fΓ,12(t)] and the mapped benign colors for different α-cuts based on the fuzzy logic-based approach (fΠ,1, … , fΠ,12). These features were computed using the 25%, 50%, and 100% boundary area portions of the skin lesion. Each training set consisted of 90% of the images (251 melanomas and 398 benign), and the remaining 10% of the images (28 melanomas and 44 benign) were used for the test set.
The percent melanoma color (D) and the basis function features (fΓ,1, …, fΓ,12) were computed using the training set of lesions for melanoma color mapping based on the statistical approach. The fuzzy ratio [R(α)] and the basis function features (fΠ,1, … , fΠ,12) were found based on the fuzzy logic method using the training set of benign lesion images to determine the relative color fuzzy set B and corresponding membership μB for benign color mapping for α = 0.1, 0.4, 0.7, and 1.0. The following skin lesion discrimination experiments were performed using features computed from the training and test sets of lesion images. First, melanoma discrimination was performed using the percent melanoma color feature, D. Second, using the basis function features [fΓ,1, … , fΓ,12], the features from the training set of images were used to train a standard back propagation neural network, with the trained neural network applied to the features from the test set of images for discrimination. Third, melanoma discrimination was performed using the fuzzy ratio, R(α). Fourth, using the basis function features (fΠ,1, … , fΠ,12), the features from the training set of images were used to train a standard back propagation neural network, with the trained neural network applied to the features from the test set of images for discrimination. Fifth, neural network classification was performed using the different feature combinations [D, fΓ,1, …, fΓ,12), (R(α), fΠ,1, …, fΠ,12), and (R(α),D, fΓ,1, …, fΓ,12]. The procedure for melanoma discrimination based on the percent melanoma color and fuzzy ratio is given in `Lesion discrimination using percent melanoma color and fuzzy ratio features'. The procedure for neural network training and testing for the different feature combinations is given in `Lesion discrimination using neural network'. For comparison of the discrimination capability of the different feature combinations described above, the average test true positive (tp) and true negative (tn) rates were computed over 10 randomly generated training/test sets. A tp means diagnosing a melanoma as a melanoma. A tn means diagnosing a benign skin lesion as benign.
Lesion discrimination using percent melanoma color and fuzzy ratio features
For lesion evaluation, D is computed over all training images. A lesion is scored as malignant if D ≥ β. Otherwise, the lesion is benign. β is a threshold determined from the percentage of melanoma color features found over the training set of images. The threshold β is selected such that tpβ ≥ tnβ is minimized for β∈[0, 100], where α is evaluated in increments of 1 and tpβ (true positive rate) and tnβ (true negative rate) are the percentage of correctly classified melanoma and benign lesions at threshold α, respectively. The ratios R(α) computed from the training data were sorted to facilitate automated threshold T selection using a procedure similar to the approach for selecting β for discrimination with the percent melanoma color feature.
Lesion discrimination using neural network
For neural network classification, the following procedure was performed. The neural network architectures used were 12 × 10 × 6 × 1, 13 × 10 × 6 ×1, and 14 × 10 × 6 × 1 for the different feature combinations, where there were 12, 13, and 14 input features, 10 nodes in the first hidden layer, six nodes in the second hidden layer, and one output. Logarithmic transfer functions were used in the hidden layers and output. Neural network training was performed with termination conditions of 20 epochs or RMSE<0.07. The neural network output threshold, ε, was determined based on maximizing the average tp and tn rates over the training set.
Results and Discussion
The percent melanoma color (D), fuzzy ratio [R(α)], associated basis function correlation features [(fΓ,1, …, fΓ,12), (fΠ,1, …, fΠ,12)], and combinations of these features were computed and evaluated over 10 randomly generated training and test sets for the 25%, 50%, and 100% lesion boundary area cases. For each boundary area case, the fuzzy ratio [R(α)] and corresponding basis function features (fΠ,1, …, fΠ,12) are computed with α 5=.1, 0.4, 0.7, and 1.
Table 1 presents the average test tp and tn results over 10 trials for the boundary area percentages of 25%, 50%, and 100% for the percent melanoma color (D) and the fuzzy ratio [R(α)] with for α=0.1, 0.4, 0.7, and 1.0. Table 2 shows the average test neural network results over 10 trials for the boundary area percentages 25%, 50%, and 100% for the basis function correlation features computed from the luminance histograms from the mapped melanoma colors using the statistical approach [fΓ,1(t), …, fΓ,12(t)] and benign colors using the fuzzy logic-based approach (fΠ,1, …, fΠ,12) with α=.1, 0.4, 0.7, and 1.0. Table 3 gives the average test neural network results over the 10 training/test sets for the basis function correlation features determined from the melanoma mapped colors using the statistical approach combined with the percent melanoma color feature (D, fΓ,1, …, fΓ,12) and the fuzzy ratio feature [R(α), fΠ,1, …, fΠ,12]. The results are shown for the 25%, 50%, and 100% boundary area cases with α=0.1, 0.4, 0.7, and 1.0. Table 4 presents the average test neural network results over the 10 training/test sets for the basis function correlation features determined from the melanoma mapped colors using the statistical approach combined with the percent melanoma color and fuzzy ratio features [fΓ,1, …, fΓ,12, D, R(α)]. The results are shown for the 25%, 50%, and 100% boundary area cases with α=0.1, 0.4, 0.7, and 1.0.
Table 1.
Average test true positive and true negative results over 10 randomly generated training/test sets for percent melanoma color (D) and fuzzy ratio R(α) features for α = 0.1, 0.4, 0.7, and 1
| 25% boundary area |
50% boundary area |
100% boundary area |
||||
|---|---|---|---|---|---|---|
| tp% | tn% | tp% | tn% | tp% | tn% | |
| D | 86.69 | 71.49 | 82.47 | 73.76 | 87.01 | 65.08 |
| R(α) | ||||||
| α = 0.1 | 78.57 | 73.76 | 77.60 | 64.26 | 80.19 | 65.50 |
| α = 0.4 | 79.22 | 75.41 | 77.60 | 66.32 | 74.03 | 72.73 |
| α = 0.7 | 83.77 | 72.52 | 80.52 | 66.53 | 73.05 | 74.79 |
| α = 1 | 87.01 | 70.25 | 82.47 | 66.32 | 74.68 | 74.38 |
Results are shown for 25%, 50%, and 100% boundary area cases. The true positive and true negative rates are given as tp% and tn%, respectively.
Table 2.
Average test true positive and true negative results over 10 randomly generated training/test sets for the basis function correlation features computed from the mapped melanoma colors and from the benign colors for α = 0.1, 0.4, 0.7, and 1
| 25% boundary area |
50% boundary area |
100% boundary area |
||||
|---|---|---|---|---|---|---|
| tp% | tn% | tp% | tn% | tp% | tn% | |
| fΓ, 1,...fΓ, 12 | 84.14 | 82.00 | 84.98 | 82.00 | 80.81 | 81.96 |
| fΠ, 1,...fΠ, 12 | ||||||
| α = 0.1 | 79.52 | 80.57 | 79.47 | 84.78 | 80.19 | 75.00 |
| α = 0.4 | 75.28 | 75.01 | 76.90 | 82.01 | 73.12 | 72.25 |
| α = 0.7 | 76.39 | 75.03 | 77.89 | 83.39 | 70.61 | 72.24 |
| α = 1 | 72.23 | 66.67 | 75.61 | 72.26 | 67.55 | 69.47 |
Results are shown for 25%, 50%, and 100% boundary area cases. The true positive and true negative rates are given as tp% and tn%, respectively.
Table 3.
Average test true positive and true negative results over 10 randomly generated training/test sets for the basis function correlation features computed from the mapped melanoma colors and the percent melanoma color feature, and the basis function correlation features computed from the mapped benign colors and the fuzzy ratio for α = 0.1, 0.4, 0.7, and 1
| 25% boundary area |
50% boundary area |
100% boundary area |
||||
|---|---|---|---|---|---|---|
| tp% | tn% | tp% | tn% | tp% | tn% | |
| D, fΓ, 1,...fΓ, 12 | 84.45 | 79.15 | 87.17 | 79.15 | 87.31 | 77.73 |
| R(α),fΠ, 1,...fΠ, 12 | ||||||
| α = 0.1 | 83.40 | 80.57 | 82.50 | 81.99 | 84.87 | 76.33 |
| α = 0.4 | 82.58 | 76.39 | 83.02 | 79.20 | 81.67 | 77.78 |
| α = 0.7 | 85.38 | 76.36 | 83.95 | 79.20 | 80.77 | 72.20 |
| α = 1 | 84.18 | 74.97 | 83.15 | 76.37 | 79.66 | 69.40 |
Results are shown for 25%, 50%, and 100% boundary area cases. The true positive and true negative rates are given as tp% and tn%, respectively.
Table 4.
Average test true positive and true negative results over 10 randomly generated training/test sets for the basis function correlation features computed from the mapped melanoma colors, the percent melanoma color feature, and the fuzzy ratio feature for α = 0.1, 0.4, 0.7, and 1
| 25% boundary area |
50% boundary area |
100% boundary area |
||||
|---|---|---|---|---|---|---|
| tp% | tn% | tp% | tn% | tp% | tn% | |
| fΓ, 1,...fΓ, 12, D, R(α) | ||||||
| α = 0.1 | 84.10 | 77.75 | 86.45 | 83.35 | 86.61 | 81.96 |
| α = 0.4 | 84.24 | 77.79 | 85.75 | 81.97 | 85.32 | 79.11 |
| α = 0.7 | 84.43 | 77.74 | 86.25 | 82.00 | 87.85 | 80.55 |
| α = 1 | 85.23 | 83.35 | 86.16 | 79.17 | 87.99 | 79.12 |
Results are shown for 25%, 50%, and 100% boundary area cases. The true positive and true negative rates are given as tp% and tn%, respectively.
The experimental results presented in Tables 1–4 highlight several observations. First, the percent melanoma color and fuzzy ratio features achieved higher overall average (average of tp and tn rates) recognition rates for the 25% boundary area case than the 50% and 100% boundary area cases. This is consistent with previous research findings that the outer portion of the skin lesion near the boundary yields higher discrimination results than regions that include the interior portion of the lesion (12, 13, 15). Second, similar melanoma and benign lesion discrimination results were obtained for the percent melanoma color and fuzzy ratio features, with tp and tn rates of 86.69% and 71.49% for the percent melanoma color feature and 87.01% and 70.25% for the fuzzy ratio feature (α=1), respectively, for the 25% boundary area case. For the 50% and 100% (entire lesion) boundary area cases, the percent melanoma color feature obtained slightly higher average tp and tn rates than the fuzzy ratio feature.
Third, the basis function correlation features computed based on the statistical approach achieved higher overall discrimination rates than the fuzzy logic-based approach for all of the α-cuts examined. This could also be interpreted to indicate that the distribution of melanoma mapped colors provide slightly better discrimination information than the benign mapped colors. The basis function correlation features fΓ,1, …, fΓ,6 are computed by correlating each of the basis functions shown in Fig. 3 with the luminance histogram for a skin lesion derived from all of the melanoma mapped colors present within the lesion based on the statistical approach. The features fΓ,7, …, fΓ,12 are found based on correlating the basis functions with the different between a bin and the adjacent bin for the luminance histogram from all of the melanoma mapped colors. The features fΠ,1, …, fΠ,12 are similarly computed based on the luminance histogram obtained from all of the benign mapped colors contained within the lesion using the fuzzy logic-based approach that satisfies a specified α-cut. The basis function features quantify the distribution and variation of the melanoma mapped colors present within the lesion. The percent melanoma color feature gives the ratio of melanoma mapped colors present within the lesion region of interest but provides no context for the distribution of those colors. Thus, the basis function features provide useful discrimination information that is different from the percent melanoma color feature. Similar statements can be made about the relationship between the fuzzy ratio and the basis function features derived from the benign mapped colors present within the lesion. Figure 5 shows an example of a melanoma lesion in (a), the luminance histogram of melanoma mapped colors using the statistical approach based on the 25% boundary area case in (b), and the luminance histogram of benign mapped colors using the fuzzy logic-based approach for α=0.1 based on the 25% boundary case. The melanoma lesion in Fig. 5 was misclassified using the percent melanoma color feature but correctly classified utilizing the associated basis function features with and without the percent melanoma color feature. The luminance histograms in Fig. 5(b) and (c) interestingly have similar shapes, but the melanoma mapped colors present in the lesion have a wider range that includes brighter luminance values than the benign mapped colors for α=0.1. This is a common characteristic for the luminance histograms for the melanoma and benign mapped colors (for the different αcuts). For comparison purposes, Fig. 6 shows a benign lesion in (a) and its luminance histograms for the melanoma and benign mapped colors (α=0.1) in (b) and (c), respectively, based on the 25% boundary area case. Inspecting the luminance histograms in Figs 5 and 6, it can be observed that the melanoma and benign mapped colors present within the melanoma lesion tend to produce peak regions in the histograms. In contrast, the melanoma and benign mapped colors within the benign lesion tend to be more uniform in frequency of occurrence. This distribution variation can be quantified using the basis functions for skin lesion discrimination.
Fig. 5.

Luminance histogram example for melanoma and benign mapped colors for a melanoma lesion for the 25% boundary area case. (a) Melanoma lesion image. (b) Luminance histogram for melanoma mapped colors using the statistical approach. (c) Luminance histogram for benign mapped colors using the fuzzy logic-based approach for α=0.1.
Fig. 6.

Luminance histogram example for melanoma and benign mapped colors for a benign lesion for the 25% boundary area case. (a) Benign lesion image. (b) Luminance histogram for melanoma mapped colors using the statistical approach. (c) Luminance histogram for benign mapped colors using the fuzzy logic-based approach for α=0.1.
Fourth, the 50% boundary area case obtained higher overall average discrimination rates for the statistical and fuzzy logic-based approaches for the basis function correlation features than the 25% and 100% boundary area cases. These results appear to indicate that the distribution of mapped colors from the outer portion of the lesion contains discrimination information, but the luminance histogram may not be sufficiently populated from the 25% outer boundary case to provide for evaluating/quantifying the variation of the mapped color distribution. Fifth, the experimental results from Tables 2 and 3 show that integrating the fuzzy ratio with the associated basis function features improves overall average discrimination for all α-cuts examined. This appears to highlight the complementary information between the fuzzy ratio and the distribution of benign mapped colors within the lesion. However, the same relationship does not seem to hold for the percent melanoma color feature, where the overall average discrimination results slightly decline when combining the percent melanoma color feature and the associated basis function features. The tp rates are similar or increase for the 25%, 50%, and 100% boundary area cases, but the tn rates decline in all cases. The experimental results for the percent melanoma color and associated basis function features from Tables 1 and 2 show that the distribution and variation in the distribution of melanoma colors provides improved overall discrimination capability, but the percent melanoma color feature yields better melanoma discrimination (tp rate) than the associated basis function features for the 25% and 100% boundary area cases.
Sixth, combining the fuzzy ratio [R(α)], percent melanoma color (D), and basis function features (fΓ,1, …, fΓ,12) derived using the statistical approach yield the highest overall discrimination rates, as high as 84.90% (average of tp rate of 86.45% and tn rate of 83.35%) for the 50% boundary area and α=0.1 case. The 50% and 100% boundary area percentage cases yielded higher overall discrimination results than the 25% case for all α–cuts. This result may show that while the individual features [fΓ,7, …, fΓ,12, D, R(α)] do not provide the best discrimination information, these features computed based on the most, if not all of the skin lesion, contain complementary information for melanoma and benign lesion discrimination. Finally, the experimental results show that the introduced basis function features provide useful skin lesion discrimination information. The basis functions from Fig. 3 provide the capability to quantify the distribution, variation of the distribution of luminance information from melanoma or benign mapped colors, as determined from a training set of lesions.
Conclusion
In this research, basis function correlation features have been investigated to extend previously developed statistical and fuzzy logic-based methods to find melanoma and benign mapped colors, respectively, for melanoma discrimination. Relative color histogram bins were labeled as melanoma or benign colors based on obtaining cumulative relative color histograms from a training set of melanoma and benign lesions using statistical and fuzzy logic-based approaches, respectively, over a specified boundary area percentage of the skin lesions. The percent melanoma color and fuzzy ratio features were computed based on determining the number of pixels within the lesion, which mapped to labeled melanoma or benign colors (for a specified α-cut). Luminance histograms of these melanoma and benign colors were found and correlated with the set of basis functions for feature calculations. The difference luminance histograms were also correlated with the set of basis functions for feature computations. Experimental results showed that the basis functions achieved higher overall discrimination rates (average of tp and tn rates), as high as 83.49% (average of 84.98% tp and 82.00% tn) using the statistical approach for melanoma mapped colors for the 50% boundary case. Experimental results also indicated that combining the fuzzy ratio (α=0.1) and percent melanoma color feature with the basis function features found from the melanoma mapped colors improved discrimination capability with an overall recognition rate of 84.90% (average of 86.45% tp and 83.35% tn rates) for the 50% boundary area case. The basis function features provide discrimination information related to the distribution and variation of melanoma and benign mapped colors present within different portions of the skin lesion. Using the basis function features with the fuzzy ratio and percent melanoma color showed that there is color discrimination information in all portions of the skin lesion, with the strongest color discrimination information present in the outer half of the skin lesion.
References
- 1.Lightstone AC, Kopf AW, Garfinkel L. Diagnostic accuracy - a new approach to its evaluation. Arch Dermatol. 1965;91:497–502. doi: 10.1001/archderm.1965.01600110083017. [DOI] [PubMed] [Google Scholar]
- 2.Grin C, Kopf AW, Welkovich B, Bar R, Levenstein M. Diagnostic accuracy in malignant melanoma. Arch Dermatol. 1990;126:763–766. [PubMed] [Google Scholar]
- 3.Lindelof B, Hedblad MA. Accuracy in the clinical diagnosis and pattern of malignant melanoma at a dermatological clinic. J Dermatol. 1994;21:461–464. doi: 10.1111/j.1346-8138.1994.tb01775.x. [DOI] [PubMed] [Google Scholar]
- 4.Friedman RJ, Rigel DS, Kopf AW. Early detection of malignant melanoma: the role of physician examination and self-examination of the skin. Ca-A Cancer J Clinicians. 1985;35:130–151. doi: 10.3322/canjclin.35.3.130. [DOI] [PubMed] [Google Scholar]
- 5.Kopf A, Mintzis M, Bar R. Diagnostic accuracy in malignant melanoma. Arch Dermatol. 1975;111:1291–1292. [PubMed] [Google Scholar]
- 6.Marks R, Jolley D, McCormack C, Dorevitch AP. Who removes pigmented skin lesion? J Am Acad Dermatol. 1997;36:721–726. doi: 10.1016/s0190-9622(97)80324-6. [DOI] [PubMed] [Google Scholar]
- 7.Landau M, Matz H, Tur E, Dvir M, Brenner S. Computerized system to enhance the clinical diagnosis of pigmented cutaneous malignancies. Int J Dermatol. 1999;38:443–446. doi: 10.1046/j.1365-4362.1999.00629.x. [DOI] [PubMed] [Google Scholar]
- 8.Umbaugh SE, Moss RH, Stoecker WV. Automatic color segmentation of images with application to detection of variegated coloring in skin tumors. Eng Med Biol Mag. 1989;8:43–52. doi: 10.1109/51.45955. [DOI] [PubMed] [Google Scholar]
- 9.Ercal F, Chawla A, Stoecker WV, Lee HC, Moss RH. Neural network diagnosis of malignant melanoma from color images. IEEE Trans Biomed Eng. 1994;41:837–845. doi: 10.1109/10.312091. [DOI] [PubMed] [Google Scholar]
- 10.Ganster H, Pinz A, Rohrer R, Wilding E, Binder M, Kittler H. Automated melanoma recognition. IEEE Trans Med Imaging. 2001;20:233–238. doi: 10.1109/42.918473. [DOI] [PubMed] [Google Scholar]
- 11.Heckbert P. Color image quantization for frame buffer display. Comput Graph (Proc SIGGRAPH ′82) 1982;16:297–307. [Google Scholar]
- 12.Faziloglu Y, Stanley RJ, Moss RH, Stoecker WV, McLean RP. Color histogram analysis for melanoma discrimination in clinical images. Skin Res Technol. 2003;9:147–155. doi: 10.1034/j.1600-0846.2003.00030.x. [DOI] [PMC free article] [PubMed] [Google Scholar]
- 13.Chen J, Stanley R, Moss RH, Stoecker WV. Color analysis of skin lesion regions for melanoma discrimination in clinical images. Skin Res Technol. 2003;9:94–104. doi: 10.1034/j.1600-0846.2003.00024.x. [DOI] [PMC free article] [PubMed] [Google Scholar]
- 14.Stanley RJ, Moss RH, Stoecker WV, Aggarwal C. A fuzzy-based histogram analysis technique for skin lesion discrimination in dermatology clinical images. Comput Med Imaging Graph. 2003;27:387–396. doi: 10.1016/s0895-6111(03)00030-2. [DOI] [PMC free article] [PubMed] [Google Scholar]
- 15.Stanley RJ, Stoecker WV, Moss RH. A relative color approach to color discrimination for malignant melanoma detection in dermoscopy images. Skin Res Technol. 2007;13:62–72. doi: 10.1111/j.1600-0846.2007.00192.x. [DOI] [PMC free article] [PubMed] [Google Scholar]
- 16.Green A, Martin N, Pfitzner J, O'Rourke M, Knight N. Computer image analysis in the diagnosis of melanoma. J Am Acad Dermatol. 1994;31:958–964. doi: 10.1016/s0190-9622(94)70264-0. [DOI] [PubMed] [Google Scholar]
- 17.Seidenari S, Burroni M, Dell'Eva G, Pepe P, Belletti B. Computerized evaluation of pigmented skin lesion images recorded by a videomicroscope: comparison between polarizing mode observation and oil/slide mode observation. Skin Res Technol. 1995;1:187–191. doi: 10.1111/j.1600-0846.1995.tb00042.x. [DOI] [PubMed] [Google Scholar]
- 18.Aitken JF, Pfitzner J, Battistutta D, O'Rourke PK, Green AC, Martin NG. Reliability of computer image analysis of pigmented skin lesions of Australian adolescents. Cancer. 1996;78:252–257. doi: 10.1002/(SICI)1097-0142(19960715)78:2<252::AID-CNCR10>3.0.CO;2-V. [DOI] [PubMed] [Google Scholar]
- 19.Stoecker WV. Computer applications in dermatology. Appleton Lange Inc; New York: 1993. pp. 101–102. [Google Scholar]
- 20.Piper J, Granum E. On fully automatic feature measurement for banded chromosome classification. Cytometry. 1989;10:242–255. doi: 10.1002/cyto.990100303. [DOI] [PubMed] [Google Scholar]
- 21.Stanley RJ, Keller J, Gader P, Caldwell CW. Data-driven homologue matching for chromosome identification. IEEE Trans Med Imaging. 1998;17:451–462. doi: 10.1109/42.712134. [DOI] [PubMed] [Google Scholar]
- 22.Stanley RJ, Gader P, Ho D. Feature and decision level sensor fusion of electromagnetic induction and ground penetrating radar sensors for landmine detection with hand-held units. Information Fusion. 2002;3:215–223. [Google Scholar]
- 23.Argenziano G, Soyer HP, de Giorgi V, Piccolo D. Dermoscopy, an interactive atlas. EDRA Medical Publishing; Milan, Italy: 2000. [Google Scholar]
- 24.McLean RP. Master Thesis in Electrical and Computer Engineering Department, University of Missouri-Rolla. 1994. Skin lesion classification based on relative color analysis of melanoma and non-melanoma skin lesion images. [Google Scholar]
- 25.Stoecker WV, Li WW, Moss RH. Automatic detection of asymmetry in skin lesions. Comput Med Imaging Graph. 1992;16:191–197. doi: 10.1016/0895-6111(92)90073-i. [DOI] [PubMed] [Google Scholar]
- 26.Hance GA, Umbaugh SE, Moss RH, Stoecker WV. Un-supervised color image segmentation with application to skin tumor borders. IEEE Eng Med Biol Mag. 1996;15:104–111. [Google Scholar]