


Abstract
The DNA mismatch repair protein MutS recognizes mispaired bases in DNA and initiates repair in an ATP-dependent manner. Understanding of the allosteric coupling between DNA mismatch recognition and two asymmetric nucleotide binding sites at opposing sides of the MutS dimer requires identification of the relevant MutS.mmDNA.nucleotide species. Here, we use native mass spectrometry to detect simultaneous DNA mismatch binding and asymmetric nucleotide binding to Escherichia coli MutS. To resolve the small differences between macromolecular species bound to different nucleotides, we developed a likelihood based algorithm capable to deconvolute the observed spectra into individual peaks. The obtained mass resolution resolves simultaneous binding of ADP and AMP.PNP to this ABC ATPase in the absence of DNA. Mismatched DNA regulates the asymmetry in the ATPase sites; we observe a stable DNA-bound state containing a single AMP.PNP cofactor. This is the first direct evidence for such a postulated mismatch repair intermediate, and showcases the potential of native MS analysis in detecting mechanistically relevant reaction intermediates.
INTRODUCTION
DNA mismatch repair (MMR) is essential for maintaining genomic stability by removing base misincorporations and slippage errors that escape the proofreading activity of the replicative polymerase. In this way, mismatch repair lowers the mutation rate in replicating cells by two to three orders of magnitude. Consequently, functional loss of mismatch repair results in a mutator phenotype and, in humans, in hereditary predisposition to colon cancer (HNPCC) as well as in the occurrence of sporadic cancers (1,2).
The initial step in MMR is the recognition and binding of a mismatch by MutS in Escherichia coli or its homolog MutSα in eukaryotes (3). Binding of the mismatch involves sharp kinking of the DNA substrate at the site of the mismatch, insertion of a conserved phenylalanine residue next to the mismatched bases and formation of an essential hydrogen bond between one of the mismatched bases and a conserved glutamate residue (4,5). This results in the uptake of adenosine triphosphate (ATP) in the nucleotide binding sites located at the opposite end of the protein, recruitment of MutL (MutLα in eukaryotes) and initiation of the repair reaction (3).
The nucleotide binding sites of MutS and its eukaryotic homologs are of the ATP binding cassette (ABC) type. In addition to the well-known transmembrane ABC transporters (6), this super family also includes proteins that are involved in DNA repair and maintenance (MutS, Rad50 and structural maintenance of chromosomes (SMC) proteins (7,8)). ABC ATPases generally form composite active sites and the conformational changes induced by ATP binding are propagated toward other regions in the protein, resulting for example in channel opening in the transporters or modulation of DNA binding in MutS (8,9).
The ATPase sites of ABC proteins are formed by two identical subunits (such as homodimeric bacterial MutS and transporters), two different subunits (such as the eukaryotic MutSα heterodimer) or are part of a twin cassette protein containing both nucleotide binding sites on a single polypeptide chain (CFTR, P-glycoprotein). The nucleotide binding sites of twin cassette and heterodimeric ABC proteins are structurally but also functionally asymmetric. For example, in eukaryotic MutSα (human MSH2/MSH6 and yeast Msh2/Msh6), the two subunits play distinct roles during mismatch repair (10,11). Msh6 (directly interacting with the mismatched base pair) forms a high-affinity site for ATP and Msh2 forms a high-affinity site for adenosine diphosphate (ADP) (12–15). Homodimeric ABC proteins also have asymmetric ATPase sites (16–21). In the crystal structure of homodimeric E. coli MutS, a single ADP cofactor is binding to the mismatch-contacting subunit A while subunit B is empty (4). Indeed the E. coli and Thermus aquaticus MutS homodimers are functional heterodimers with a preference for simultaneous binding of ADP and ATP in the absence of DNA (19,22). This functional ATPase asymmetry is required for in vivo MMR (20).
The DNA and nucleotide binding sites in MutS and its homologs are coupled allosterically. Mismatched DNA increases the steady state ATPase activity of MutS and MutSα by accelerating the rate limiting step of ADP release (23,24). At the same time, mismatched DNA specifically inhibits pre-steady state ATP hydrolysis in one of the nucleotide binding sites (12,25,26). This inhibition indicates formation of a relatively stable state of ATP-bound MutS on a DNA mismatch (25,27), which is dependent on the formation of a hydrogen bond between the conserved glutamate in the mismatch binding domain and one of the mispaired bases, and that is important for efficient in vivo MMR (26). The nucleotide occupation of the ATPase sites in MutS and its homologs in the presence of a DNA mismatch and ATP has been studied by filter binding, surface plasmon resonance and nucleotide crosslinking (13,14,19,28). Interpretation of these data, however, is not conclusive because none of these assays allows monitoring of simultaneous mismatch binding and differential nucleotide binding within the same MutS/MutSα dimer.
In this study, we implemented native mass spectrometry (MS) to obtain direct evidence for relevant MutS.DNA.nucleotide states. Macromolecular native MS using electrospray ionization (ESI–MS) enables the analysis of intact non-covalent protein–protein or protein–ligand complexes (29–31). The gentle phase transfer of macromolecular samples, from aqueous solutions kept at neutral pH, to the gas phase, allows analysis of mass, composition and interactions of complexes with high mass resolution. We show that in native MS spectra, we can count the number of nucleotide cofactors in the ATPase sites of a mismatched DNA-bound MutS dimer. To achieve sufficient mass resolution to unambiguously differentiate between nucleoside diphosphate- and triphosphate-bound MutS oligomers (a few tens of Daltons in a ‘background’ of over 200000 Da), we developed an algorithm that allows deconvolution of the overlapping experimental peaks. We obtained a mass accuracy that conclusively allows distinction of ADP and AMP.PNP bound to different subunits of mismatch-associated MutS. This allowed for the first time, the direct detection of a MutS state that is simultaneously bound to a DNA mismatch and a nucleoside triphosphate. We discuss the importance of this MMR intermediate for faithful initiation of mismatch repair and its possible role in ABC proteins in general. This assay and algorithm may be useful to detect mechanistically relevant reaction intermediates of other allosteric nucleic acid interacting ATPases that cannot be addressed using classical techniques.
MATERIALS AND METHODS
DNA oligomers and proteins
Oligonucleotides (Sigma-Aldrich) for homoduplex and heteroduplex substrates were: 21- and 41-mer according to (26); 30-mer according to (4). Annealed products were purified by size exclusion chromatography on Superdex 75 in 25 mM HEPES pH 7.5, 100 mM NaCl. Concentrations were determined on a Nanodrop ND-1000 Spectrophotometer (Isogen Life Science, The Netherlands); sequence-based extinction coefficients for double-stranded DNA were calculated using the Biopolymer Calculator (http://paris.chem.yale.edu/cgi-bin/extinct.html) and corrected for hypochromicity. Full-length E. coli MutS from expression plasmid pMQ372 (32) was purified as described (4,33). MutS was depleted from endogenous ADP as described (34).
MS
For MS analysis, stock solutions of ATP, ADP, AMP.PNP and ATPγS (Sigma-Aldrich) were prepared in 250 mM ammonium acetate pH 7.5 (MS buffer) and pH was adjusted with ammonia. Buffer exchange of MutS and DNA substrates to MS buffer was performed using BioMax ultra-filtration devices with cut-off values of 10 and 3 kDa (Millipore, UK). MS measurements were performed in positive ion mode using a Micromass electrospray ionization time-of-flight instrument (LC-T; Waters, UK) or a modified Micromass electrospray ionization quadrupole time-of-flight instrument (Q-ToF; Waters, UK) equipped with a Z-spray nano-electrospray ionization source. Needles were made from borosilicate glass capillaries (Kwik-Fil, World Precision Instruments, USA) on a P-97 puller (Sutter Instruments, USA), coated with a thin gold layer by using an Edwards Scancoat (Edwards Laboratories, USA) six Pirani 501 sputter coater. To produce intact ions in vacuo from large complexes in solution, the ions were cooled by increasing the pressure in the first vacuum stages of the mass spectrometer (35,36). Efficient desolvation was required to sharpen the ion signals to determine the identity of the complexes from the mass spectrum. Using the LC-T source, pressure conditions were raised to 9.0 mbar, and capillary and cone voltages were set to 1200–1400 V and 150–180 V, respectively. Using the Q-ToF source, pressure conditions were raised to 10 mbar and capillary and cone voltages were set to 1400–1500 V and 150–175 V, respectively (37). The collision energy was set to 150 V in combination with an argon gas pressure of 0.8 mbar. All spectra were mass calibrated by using an aqueous solution of caesium iodide (50 mg/ml). Mass spectra were accumulated over 4 min, averaged, smoothed and centered, using the areas option in the software program MassLynx 4.0 or 3.5 (Waters). MutS (4 µM monomer) was incubated with 4–40 µM of ADP, AMP.PNP, ATPγS or ATP in the absence and presence of 50 µM of magnesium acetate and/or 2 µM 21-bp or 30-bp mismatched DNA at 21°C for 2 min prior to mass analysis.
Data analysis
When we consider the charge state envelop of the MutS dimer (Figure 2A) with or without DNA, three possible nucleotide states (0, 1 and 2) existed. These were fitted simultaneously to the overlapping peaks of the charge states within this envelope. For each ion the distribution of apparent mass, m, was modeled as the convolution of a Gaussian (centered on the mass of the ion, M, and having a spread s modeling random variation in ToF) with a decreasing exponential with constant k, representing the first order decay of the mass at the high m/z end of the distribution. Hence the theoretical expected spectra, that is the frequency with which a apparent mass of m is measured, for a single ion of mass M is  , given by the formula (using the characteristic function of
  ,
,  , which evaluates to 1 for any element of
  and 0 otherwise):
| (1) |
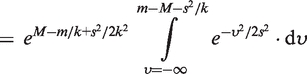 |
(2) |
Figure 2.

Native MS resolves asymmetric nucleotide binding by MutS dimers. (A) Mass spectra of 4 µM MutS containing endogenous ADP. Raw and smoothed data (gray and black, respectively) with superimposed onto this the estimated distributions (in blue) obtained from fitting a Gaussian convoluted with a single exponential decay for each separate peak (in red) in the charge state distribution. At the top the actual data is shown, at the bottom the residuals. Horizontal red bars depict the region where the fit is optimized. A close-up of the 28+ ion spectra is shown; the relative abundance of empty MutS and MutS with one or two nucleotide is indicated in blue numbers (calculated for 28+ ion). The mass differences between the first and second species (first nucleotide, 409 Da, ADP) and the second and third species (second nucleotide, 422 Da, ADP) are in red numbers (computed for complete spectrum, not solely 28+ ion). (B) Mass spectra of 4 µM MutS containing endogenous ADP (28+ ion) titrated with ADP (0–40 µM). The ‘0’, ‘1’ and ‘2’ indicate the number of nucleotides bound to a MutS dimer. The low occupancy of the second site indicates the presence of a high and a low binding site for ADP on the MutS dimer. (C) Mass spectra of 4 µM MutS containing endogenous ADP (28+ ion) titrated with increasing concentrations of AMP.PNP (0–8 μM). (D) Mass spectra of 4 μM MutS (28+ ion) titrated with 8 µM ADP, 2 µM mismatched DNA, 8 µM AMP.PNP, Mg2+ and extra incubation time. Mismatched DNA induces dissociation of ADP from one nucleotide binding site. Release of MutS from DNA upon AMP.PNP addition is further improved by Mg2+ and longer incubation. Note the change in m/z scale compared to panel B and C.
The complete mass-spectrum is considered to be the sum of the independent contributions of each ion, within a given charge range, (zmin to zmax) for each species. The most abundant species (among empty, 1 nt and 2 nt) is used as the reference species, with mass m0, while the other species are defined relative to this one (hence having mass of m0+δ1 and m0+δ2). For each charge, a small mass offset is allowed (δz) which is constrained to 0 for z = zmin. Furthermore, each individual ion has an independent abundance:
| (3) |
Then the model spectra, 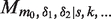 , in term of expected number of count at a given time of flight, t, is given by the summation:
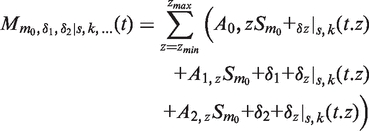 |
(4) |
This parameterization allows modeling of a complete spectrum with a very limited number of parameters: eight for the first charge state (m0, δ1, δ2, s, k, A0,zmin, A1,zmin A2,zmin), and four for each extra charge state (A0,z, A1,z, A2,z, δz).
The estimation of the parameters was performed through maximization of model likelihood given the observed data. For each time of flight, we assume a Poisson distribution since the measurement noise is dominated by the impact counting statistics. In practice, the opposite of the log likelihood was used to be able to use a standard minimizer and overcome the difficulty of multiplying a large set of numbers. If an observed spectrum is indicated by O(t), the parameters were estimated by minimizing the function using the L-BFGS-G algorithm:
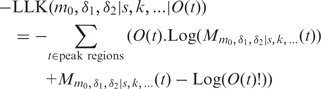 |
(5) |
To estimate the accuracy of the values obtained by maximum likelihood refinement, we generated a distribution of possible values using the bootstrap resampling technique: The fit was performed with values of t picked randomly in the original ensemble, in the peak regions. Hence, certain original values of t would be present multiple times in the summation, while others would be absent. For each spectrum, resampling was performed 1000 times to ensure sufficient statistics. This way we could both verify the stability of the fit (the parameters estimated from the original spectra are very close to the median and the mean of distribution obtained by resampling) and obtain confidence intervals for each estimated parameter.
Finally, given the fact the exact same shape is used for all ions (the random ToF variations s and the decreasing exponential k are kept identical), the relative abundance of each state can be directly estimated from the values of the A0,z, A1,z and A2,z.
For providing an estimate of the relative abundance of each nucleotide state we consistently used the 28+ ions since it is the most present in almost all the spectra.
RESULTS
Native MS resolves DNA mismatch binding by MutS
To study simultaneous DNA and nucleotide binding by MutS, we electrosprayed MutS in a volatile buffer at neutral pH into the mass spectrometer. MutS is fully functional under these conditions (Supplementary Table S1 and Supplementary Figure S1). In the absence of DNA, we observe three charge state distributions (envelopes) around mass-to-charge (m/z) values of 5000, 7000 and 9500 (Figure 1A). Individual peaks in each charge state envelope correspond to the same macromolecule carrying a different charge. The three envelopes correspond to monomeric, dimeric and tetrameric MutS, with masses of respectively 95183 ± 12 Da, 190324 ± 22 Da and 381572 ± 43 Da (Table 1). The oligomer distribution in the mass spectrum seems to be favoring the MutS monomer, likely because lower mass oligomers are ionized and/or detected more efficiently in native MS analysis (36).
Figure 1.

Native MS resolves DNA mismatch binding by MutS. (A) Mass spectra of 4 µM MutS without DNA. Charge state distributions around 5000, 7000 and 9500 m/z values indicate MutS monomers, dimers and tetramers, respectively. Charges of individual ions are indicated above the peaks in the envelopes. Inset: close-up of two of the tetramer charge states. (B) Mass spectra of 4 µM MutS with 2 µM 21-mer mismatched DNA. MutS monomers are no longer detected. Inset: tetrameric MutS bound to 0 (black), 1 (blue) and 2 (red) molecules of mismatched DNA. (C) Mass spectra of 4 µM MutS with 2 µM 30-mer homoduplex DNA. MutS monomers are still detected. Due to the higher molecular weight of the 30-mer DNA substrate the peaks belonging to DNA-bound MutS are at higher m/z values than in Figure 1B. The amount of DNA-bound MutS (green) does not exceed 7% of the total. (D) MutS tetramers bind two mismatched DNA molecules with apparent similar affinities. The 4 µM MutS, concentration calculated as monomer, was titrated with 0–2 µM 30-mer mismatched DNA. The amount of tetramers containing zero (black), 1 (blue) and 2 (red) mismatched 30-mer DNA molecules is plotted as a function of DNA concentration. Tetramers with two DNA substrates are already detected while a substantial portion of the tetramer still has two empty binding sites, indicating that there is no large difference between the affinities of the two binding sites.
Table 1.
Molecular masses of MutS complexes as measured by native MS in 250 mM ammonium acetate pH 7.5
| MutS species | Symbol | Mass (Da) | Theoretical (Da)a |
|---|---|---|---|
| MutS monomer | |||
| MutS | 95 183 ± 12 | 95 161 | |
| MutS dimer | |||
| MutS | 190 324 ± 22 | 190 322b | |
| MutS–DNA 21-bp |  |
203 229 ± 23 | 203 191b |
| MutS–DNA 30-bp |  |
208 716 ± 6 | 208 753b |
| MutS tetramer | |||
| MutS |  |
381 572 ± 43 | 380 644c |
| MutS–DNA 21-bp |  |
394 458 ± 60 | 393 513c |
| MutS–(DNA 21-bp)2 |  |
407 392 ± 51 | 406 380c |
Masses are determined from at least two independent measurements.
aN-terminal methionine is removed from MutS.
bThe reported masses here are only for the population of MutS dimers without nucleotide bound (that is the first peak within each dimer charge state envelope). The analysis of the masses of all three peaks, and therefore which nucleotide is bound to the two ATPase sites on the dimer, is shown in Figures 2 and 3.
c While we cannot resolve individual peaks of nucleotide binding within the MutS tetramer, the difference in mass between the observed and theoretical values (approximately 1 kDa) is in agreement with an expected average occupancy of two nucleotides per MutS tetramer.
When DNA containing a G.T mismatch is added to the MutS sample, we see shifts of the charge state envelopes toward higher m/z values, consistent with MutS binding to DNA (Figure 1B). The formation of this protein–DNA complex is mismatch specific under these conditions, because only 3–7% DNA binding is detected upon addition of the same concentration of homoduplex DNA (Figure 1C and Supplementary Figure S2). MutS has similar affinities for 30-bp DNA and its shortened 21-bp version carrying the GT mismatch within the same sequence (26), but because spectra with the 21-bp DNA were of higher quality, we subsequently worked with this shorter DNA substrate. Binding of this mismatched DNA stabilizes the quaternary structure of MutS; monomeric MutS ions effectively disappear and the dimer–tetramer equilibrium shifts toward the tetramer state upon DNA binding (Figure 1B). Because in solution MutS tetramer formation is specific (38,39) and because we do not observe additional higher molecular weight complexes on DNA, this stabilization of the tetramer is relevant rather than an artifact due to a specific charge neutralization during the MS analysis. We confirmed this by light scattering using MALLS in which the apparent Mw of MutS shifts from 317 to 360 kDa in the presence of DNA (Supplementary Figure S3). This agrees with previous observations of mismatch-induced tetramerization of E. coli MutS (40) but seems to differ from Taq MutS that has a considerably higher equilibrium constant for tetramer formation (41). While MutS dimers bind a single DNA molecule (mass of 203 229 ± 23 Da), the MutS tetramer is able to bind up to two mismatched DNA molecules (observed masses 394458 ± 60 and 407392 ± 51 Da) with no apparent indication for cooperativity (Figure 1B and D, Table 1; Supplementary Figure S4).
Native MS resolves asymmetric nucleotide binding by MutS dimers
Individual peaks within the MutS dimer envelope reveal fine splitting. Accurate mass assignment to these subspecies using the regular MS software was not directly feasible due to significant overlap between the peaks. To determine the masses accurately, we developed an algorithm that takes into account the existence of multiple charge states with three subspecies and fits them simultaneously. The algorithm assumes a Gaussian distribution for individual subspecies convoluted with an exponential decay to describe the tailing at the higher m/z ends, likely caused by small molecule/ion binding and incomplete desolvation of the electrosprayed protein ions. A typical example (Figure 2A) shows that this model fits the data very well.
The fitting algorithm performs a robust statistical analysis through bootstrap resampling and provides a distribution of likely fitting results. This analysis allows determination of the mass difference between the first and second subspecies and the mass difference between the second and third subspecies (Figures 2A and 3). The median values of these distributions reflect the average mass difference between dimer subspecies within a group of spectra, while the actual distribution provides the error estimate. The analysis also allows determination of the relative occupancies of each subspecies within the dimer charge state distribution. We observe a reproducible systematic variation of these relative occupancies depending on the charge state; the ions carrying a higher charge have more of the low mass subspecies and less of the high mass subspecies than ions carrying a lower charge. Within the envelope, the 28+ ion is always most abundant and represents a good average occupancy distribution for the complete envelope. So while mass differences are determined from all charge states simultaneously, we use the 28+ ion to display in figures and estimate occupancies of the subspecies in each experiment. The spectra are grouped based on assay conditions; i.e. in the absence or presence of DNA and/or with different nucleotides and/or Mg2+ (Figure 3). All the observed different nucleotide states are summarized in Table 2 and Figure 4.
Figure 3.

MutS stably binds to mismatched DNA when one nucleotide binding site is filled with nucleoside triphosphate. (A) Masses of the first nucleotide bound to the MutS dimer (difference in mass between the first and second peak of the dimer charge state species) grouped according to assay conditions in the absence (left panel) and presence of mismatched DNA (right panel). For each group, the box corresponds to the 50% confidence interval, the bold horizontal line corresponds to the estimation of the parameter by the median of the distribution obtained through resampling (this always overlap with the single estimation based on the non-resampled spectra). The box width is proportional to the square root of the number of experiment as the signal to noise ratio is generally increasing proportionally to the square root of the number of repetition of an experiment. As a result of differences in the extent of ATP hydrolysis, the spectra obtained with ATP fall into two groups, likely because of different amounts of traces of magnesium ions present in the samples as explained in the text. (B) Masses of the second nucleotide bound to the MutS dimer (difference in mass between the second and third peak in each dimer charge state species) as in (A). (C) Estimation of the relative abundance of each state (0, 1 or 2 nt bound) from the 28+ ion in each experiment. The width for each experiment is set such that the width of a given group is the same as for the top two figures. (D) The 2 nucleotide binding sites fill up faster with a mixture of nucleoside di- and triphosphate than with diphosphate alone. The percentage of MutS dimers with 2 nucleotide binding sites filled is plotted against nucleotide concentration for ADP, AMP.PNP and for any nucleotide in the presence of DNA.
Table 2.
Identity and estimated abundance of MutS nucleotide states upon addition of ATP and AMP.PNP in the absence and presence of mismatched DNA
| MutS without DNA |
MutS with mismatched DNA |
||||||
|---|---|---|---|---|---|---|---|
| ATP | AMP.PNP | AMP.PNP | ATP | AMP.PNP | |||
| 16 uM | 2 uM | 8 uM | 16 uM | 16 uM | |||
| Nucleotide state | State in Figure 4 | Abundance of this state (%) | State in Figure 4 | Abundance of this state (%) | |||
| Empty | Ia | 13 ± 6 | 10 | 2 | IIa | 20 ± 3 | 21 ± 6 |
| 1 ADP | Ib | 26 ± 4 | ~32a | 0 | IIb | 58 ± 3 | 0 |
| 2 ADP | Ic | 61 ± 9 | 0 | 0 | IIc | 22 ± 4 | 0 |
| Mixed | Id | 0 | 47 | 0 | IId | 0 | 17 ± 6 |
| 1 AMP.PNP | Ie | – | ~11a | 14 | IIe | – | 62 ± 4 |
| 2 AMP.PNP | If | – | 0 | 84 | IIf | – | 0 |
We considered different groups of spectra (16 µM ATP, 2 µM and 8 µM AMP.PNP added to MutS; 16 µm ATP and 16 µM AMP.PNP and mismatched DNA added to MutS) and report the abundances (in percentages) of the different states as in Figure 3C grouped by identity of the nucleotide. Reported numbers are derived from a single charge state (the 28+ ion) which gives a good approximation of the nucleotide abundances of the complete dimer envelop. States are numbered as in Figure 4. The mixed nucleotide state contains one ADP and one AMP.PNP cofactor simultaneously.
aThe species carrying a single nucleotide upon addition of 2 µM AMP.PNP has an abundance of 43% but is a mixture carrying either 1 ADP (state Ib, estimated abundance 32%) or 1 AMP.PNP (state Ie, estimated abundance 11%). (–) is not relevant in this experiment.
Figure 4.

Overview of observed DNA and nucleotide states of E. coli MutS in native MS analysis and model for ATP-induced activation on mismatched DNA. All dimeric E. coli MutS nucleotide states that are directly observed in our MS assay are depicted, with the exception of state IIf, which is the MutS sliding clamp that will diffuse off from the linear DNA before detection. The depicted states can be considered as isolated dimers, or as dimers within the MutS tetramer, because nucleotide asymmetry is regulated at the dimer level. The upper half of the figure shows the states in the absence of DNA, the lower half shows the states in the presence of DNA. Nucleotides binding to and releasing from MutS are indicated with blue balls (ADP) and red balls (ATP/AMP.PNP). Subunits A and B within the MutS dimer cannot be distinguished in our assay, therefore nucleotides are drawn at the interface between the subunits. The size of the arrows is an indication for the rate of the reaction step. Very fast steps have occurred before detection in our MS assay, fast steps can be observed as partial occupancy, and very slow steps are not observed in our assay. All states are numbered, explained in the main text and tabulated with abundances in Table 2. MutS activation occurs through pathway Ic-Ib-Id-IId-IIe-IIf if the protein encounters ATP before a DNA mismatch. MutS activation occurs through pathway Ic-IIc-IIb-IId (or IIa)-IIe-IIf if the protein encounters the DNA mismatch in the ADP state. In both instances, the formation of a relatively stable mismatched DNA-bound state containing a single ATP (state IIe) is crucial. This is the single AMP.PNP-bound state on DNA that we observe with high abundance in our MS analysis. It is this state that verifies that MutS is actually bound to a DNA mismatch (26). Subsequent ATP binding by subunit B then results in a double ATP state that undergoes a conformational change in which the mismatch binding domains rotate away and the protein forms a sliding clamp that will recruit MutL and initiate repair.
Without the addition of any ligand, the average mass differences between the first and second MutS dimer peaks and between the second and the third peak are both 410 Da (Figure 3A and B). These values are close to the theoretical mass of ADP (Mw 427.2 Da), suggesting that we observe MutS dimers bound to none, one or two nucleoside diphosphate molecules (states Ia, Ib and Ic in Figure 4). Indeed, if we deplete the nucleotide from MutS, we observe a shift in the relative abundance of the different subspecies from the higher to the lower m/z values (Supplementary Figure S5). Furthermore, titration of increasing concentrations of ADP shifts the subspecies distribution toward higher m/z values (Figure 2B). Efficient binding to the first site with limited binding to the second site is in agreement with the 2 nucleotide binding sites within the MutS dimer having different affinities for ADP (20,22). The difference between the observed and theoretical masses for ADP binding indicates that nucleotide binding may result in displacement of a small molecule or ion (maybe water, Mw 18 Da).
When both nucleoside diphosphate and triphosphate are present, the MutS dimer is expected to bind one of each (22). In agreement with this, we observe formation of a mixed nucleotide MutS species upon addition of increasing concentrations of AMP.PNP (Mw 506.2 Da) to MutS containing endogenous ADP (Figure 2C and Table 2). The second nucleotide binding site fills up at a lower total nucleotide concentration with a mixture of nucleotides than with ADP alone (Figure 3D). At AMP.PNP concentrations of 2 µM, only the second site binds nucleoside triphosphate; ADP remains bound to the first site (state Id). At AMP.PNP concentrations above 4 µM, the nucleotide in the first site is replaced and the dimer contains two nucleoside triphosphate cofactors (507 and 530 Da, Figure 3, state If in Figure 4 and Table 2).
When we add ATP (Mw 507.2 Da) in the presence of Mg2+, hydrolysis occurs and we observe dimers bound to ADP (average mass differences of 423 and 437 Da for the two binding sites, Figure 3A and B). The absence of Mg2+ does not completely prevent hydrolysis, most likely due to trace amounts of magnesium ions leaking from consumables or equipment. This results in a higher variation of mass differences between different samples and spectra can be assigned to two groups. The first group contains ADP in both nucleotide binding sites (average mass increases of 431 and 437 Da). In the second group, ATP hydrolysis occurred only in a subset of molecules, and we observe a mixture of ATP and ADP species (average mass increases of 470 and 439 Da). MutS containing endogenous ADP and ADP-depleted MutS have identical catalytic properties during steady state ATPase hydrolysis (Supplementary Table S1), and both display this variation between ATP spectra in the absence of magnesium.
Stable mismatched DNA binding by MutS with AMP.PNP in 1 nucleotide binding site
Now that we can count and identify nucleotides within MutS dimers, we addressed whether we would still be able to do this while MutS is bound to mismatched DNA. We first verified the nucleotide-dependent formation of the expected MutS–DNA complexes, using nucleotide concentrations in the low micromolar range to be able to observe different species within the same spectra. In the presence of ADP, MutS binds to mismatched DNA (Figure 2D). In agreement with previous studies, the addition of nucleoside triphosphate induces dissociation from the DNA (partial dissociation in a mixture of ADP and AMP.PNP is shown in Figure 2D). The ratio between DNA bound and free MutS changes with prolonged incubation times before spraying the complexes into the mass spectrometer, and this is different for ATP, ATPγS and AMP.PNP. Upon addition of Mg2+ to samples containing ATP+DNA+MutS, nucleotide hydrolysis results in reformation of DNA-bound complexes with time. Using ATPγS this reformation of protein–DNA complexes takes longer, probably because of slow ATPγS hydrolysis as described for the human homolog (10,13). With non-hydrolyzable AMP.PNP that induces the correct conformational change in MutS (Supplementary Figure S6), there is dissociation but no rebinding at longer incubation times. This confirms that MutS bound to the nucleoside triphosphate forms of the cofactor is unable to directly rebind to the DNA (23,42). When ADP and AMP.PNP are both present, mixed-nucleotide states of MutS are formed (see below for more detailed analysis) in which case full dissociation does not take place (Figure 4D). Summarizing, our assay allows detection of the relevant nucleotide and DNA-bound MutS species.
We therefore proceeded with analysis of the DNA bound MutS species in more detail. Remarkably, despite the spectra with DNA being a bit noisier, we are still able to identify and accurately determine the masses of the nucleotides bound to the protein–DNA complex. We observe that mismatch binding favors binding of only one ADP molecule per MutS dimer (state IIb in Figure 4) over the empty and double ADP-states (IIa and IIc in Figure 4 and Table 2; Figures 2D, 3C and 3D). This indicates that interaction with mismatched DNA increases the asymmetry of nucleotide binding within a MutS dimer. The observed mass of the first nucleotide (454 Da) is higher than the theoretical value for ADP, suggesting that binding of this nucleotide to DNA-bound MutS involves binding of an additional ion. This is true both for copurified ADP and added ADP. The observed mass for the second nucleotide in the small population of dimers containing two cofactor molecules corresponds to ADP (417 Da).
We next analyzed mismatch binding in the presence of ATP. The mass differences observed in the DNA-bound dimer species are very similar to those described above for ADP (453 and 417 Da for the two sites, Figure 3). Again the dimer species with a single nucleotide is most abundant (state IIb in Figure 4). Identical mass differences are observed with and without Mg2+, both using MutS containing endogenous ADP as well as nucleotide-depleted MutS. Changing the order of addition of different components during assembly of the protein–DNA complexes before spraying into the mass spectrometer, as well as minimizing the time between ATP addition and detection, did not influence the outcome of this analysis. This indicates that complete hydrolysis occurs in the DNA-bound MutS dimers before they can be detected in the mass spectrometer.
In the presence of AMP.PNP, the mass increase due to nucleotide binding in the first site (500 Da) is close to the theoretical value of AMP.PNP (506.2 Da). The second nucleotide (435 Da), which is present in a small population of the DNA-bound protein, is an ADP molecule. MutS is able to bind to mismatched DNA when it contains a single nucleoside triphosphate (state IIe in Figure 4), and also if it binds one di- and one triphosphate cofactor simultaneously (state IId in Figure 4). The order of addition of nucleotide and DNA to MutS is not important; we find MutS bound to DNA and one AMP.PNP molecule whether we add AMP.PNP before or after adding DNA to MutS.
In the absence of DNA, both nucleotide binding sites are filled at high nucleotide concentrations (Figure 3C and D). In the presence of DNA at all nucleotide concentrations, the DNA-bound dimer with one binding site filled is the most abundant species. Thus mismatched DNA increases the nucleotide asymmetry within the MutS homodimer. Upon addition of AMP.PNP, this observed single nucleotide is the triphosphate, indicating that the endogenous ADP has dissociated. In yeast MutSα, this ADP release from Msh2 is a result of ATP binding in Msh6 rather than a direct result of DNA binding (14). This is not the case in E. coli MutS, because we observe the mixed nucleotide state in the absence of DNA. This is further supported by a real time fluorescence-based nucleotide binding assay (Supplementary Figure S7). MANT-ADP release from MutS is accelerated more than 10-fold in the presence of mismatched DNA. However, rates are identical upon addition of ADP or ATP, both in the absence or presence of DNA. This indicates it is not the binding of ATP or ADP to the other subunit, but rather mismatched DNA itself (or the combined action of DNA and nucleotide in the other subunit) that enhances the dissociation rate of the bound ADP.
DISCUSSION
Native MS detects relevant protein–ligand reaction intermediates
MutS uses ATP to couple mismatch detection to correct initiation of repair. Relevant nucleotide states of MutS and its homologs in the absence and presence of mismatched DNA have been studied by monitoring either nucleotide binding in the absence or presence of DNA (14,19,28) or DNA binding in the presence of different nucleotides (13,42). However, because of allosteric coupling between the nucleotide and mismatch binding sites, assumptions on binding of a ligand that is not being monitored may be incorrect, and therefore identification of the relevant MutS–DNA–nucleotide states is so far inconclusive. Crosslinking assays have been used successfully to distinguish nucleotide binding to the Msh2 and Msh6 subunits (10,14). However, the observed nucleotides are not necessarily bound within the same heterodimer because different DNA- and nucleotide-bound populations may exist simultaneously during the crosslinking procedure.
We used macromolecular native MS to explicitly detect simultaneous DNA binding and nucleotide binding to two ATPase sites within the same E. coli MutS dimer. This analysis allows us to distinguish the different DNA-bound MutS oligomers with high mismatch discrimination and to observe how mismatch binding and release are controlled by binding and hydrolysis of ATP. Different nucleotide-filled and DNA-bound MutS dimers are detected and we do not only observe the relevant MutS nucleotide states but also their relevant distributions. We developed a fitting routine that allows deconvolution of the overlapping dimer charge state distributions. This method returns the real masses of the individual species with high accuracy. It avoids the underestimation of the mass difference between overlapping peaks. Importantly, this analysis allows us to differentiate between binding of nucleoside diphosphate and nucleoside triphosphate in the two composite ATPase sites of MutS. This is a difference of only one phosphate, i.e. only 80 Da, within a 200 000 nucleoprotein complex analyzed under soft ionization conditions. We conclude that native MS is a very suitable technique to study MutS–DNA–nucleotide complex formation, and that, with the exception of protein crystallography, it is the only technique that allows direct detection of one DNA molecule and two cofactor molecules binding to the same protein dimer. It is a powerful technique for identifying relevant reaction intermediates of other allosteric protein–nucleic acid complexes.
Nucleotide binding by MutS in the absence of DNA
The native MS spectra clearly resolve the established asymmetry of the prokaryotic MutS ATPase sites (4,19,20,22). In the absence of DNA, MutS binds the first ADP with high affinity (State Ib in Figure 4) but we observe low affinity for the second ADP (State Ia). So while the low-affinity ADP is easily released, dissociation of the high-affinity ADP will be very slow (Supplementary Figure S7) and the empty MutS state (state Ia) is not highly populated (Figure 3C and Table 2). It is likely that MutS will take up ATP before releasing the remaining ADP, and that a mixed nucleotide state (state Id) is formed efficiently as has been reported (19,22). Indeed, we observe preferential formation of this state upon incubating MutS containing endogenous ADP with non-hydrolysable AMP.PNP (Table 2 and Figure 3D). This mixed state has several options. If it encounters a DNA mismatch it will bind, kink the DNA and form a stable recognition complex (state IId in Figure 4, further discussed below). In the absence of a DNA mismatch, the ATP in the mixed state is hydrolyzed and the double ADP state is reformed (state Ic). Alternatively, in the absence of a DNA mismatch, the mixed state may release its remaining ADP, but again this process is slow and indeed we observe a minor amount of single AMP.PNP-bound state (state Ie) in the MS analysis. We do, however, observe the double nucleoside triphosphate state (state If) in the presence of an excess of AMP.PNP. This indicates MutS is able to bind simultaneously to two nucleoside triphosphate molecules, in accordance with reported data for prokaryotic (19,22) and eukaryotic homologs (12,14). However, under hydrolyzing conditions in vivo, because of slow rates of ADP release, we expect that mainly the double ADP state (Ic) and the mixed nucleotide state (Id) will be populated.
The resolution of the MS assay is insufficient to analyze nucleotide asymmetry within MutS tetramers. However, it has been shown that obligate dimer variants of MutS are only very modestly affected in in vivo mismatch repair (39). The tetramerization domain is separate from the DNA- and nucleotide binding domains and these functional regions do not interact with their dimer counterparts within the extended tetramer. Nucleotide asymmetry is regulated at the dimer level (20,22) and we therefore expect the dimers within the MutS tetramer to act independently concerning nucleotide regulation.
Nucleotide binding by MutS in the presence of mismatched DNA
Mismatched DNA further increases the asymmetry of nucleotide binding. If the double ADP state encounters a DNA mismatch (state IIc), one of these ADP molecules will very rapidly dissociate. We clearly see this in the mass spectra; DNA-bound MutS mainly carries a single ADP (state IIb is more populated than state IIc; Table 2) while at the same nucleotide concentration in the absence of DNA, a similar MutS majority contains two ADP nucleotides (state Ic is more populated than state Ib) (Figures 2D, 3C and D). Two options are available for this DNA-bound MutS containing a single ADP (state IIb). The first is to release the remaining ADP from the high-affinity site, and because we know from biochemical assays that this release is accelerated by mismatched DNA (24,34) (Supplementary Figure S7), the formation of a nucleotide-free state on DNA (state IIa) is possible. This MutS will rapidly bind nucleotide and form a single ATP-bound state on DNA (state IIe). Indeed, based on our MS analysis, this state is highly populated after mixing MutS containing endogenous ADP with mismatched DNA and AMP.PNP (Figure 3A and B). The second option for DNA-bound MutS containing a single ADP (state IIb) is to take up ATP before ADP is released and form the mixed nucleotide state on DNA (state IId). We observe as much mixed nucleotide MutS on the DNA as nucleotide-empty MutS on DNA (Figure 3C). Clearly DNA- and AMP.PNP-bound MutS has efficiently released the endogenous ADP.
In the presence of mismatched DNA fast hydrolysis of ATP in one subunit of the MutS dimer is inhibited (12,25,26).We find that the lifetime of this intermediate is too short for detection in the MS assay and we only detect ADP in mismatched-bound MutS (State IIb in Figure 4). However, upon addition of AMP.PNP, MutS containing a single nucleoside triphosphate remains stably bound to the mismatched DNA (state IIe). Our assay cannot distinguish to which subunit the nucleotide is binding. Nevertheless, this indicates that as long as MutS is bound to a single nucleoside triphosphate molecule that does not get hydrolyzed, it can form a stable complex with mismatched DNA. This stable complex formation may be the reason for the observed inhibition of pre-steady state ATP burst hydrolysis by mismatched DNA (19,25,26). We observe this state because we add nucleotide concentrations around the binding constant of the low-affinity nucleotide binding site. We do not observe DNA-bound MutS containing two AMP.PNP molecules (IIf), because this state is too short-lived due to formation of the sliding clamp that rapidly releases the linear DNA (state If, Supplementary Figure S6 (14,24,43)). Indeed, in most spectra containing DNA and AMP.PNP, we observe a mixture of MutS and DNA-bound MutS (Figure 2D).
The preferential formation of a mixed nucleotide state in the absence of DNA (state Id) and a single AMP.PNP-containing state when bound to DNA (state IIe) indicates that it is binding of mismatched DNA and not binding of nucleoside triphosphate (as reported for yeast but not for human MutSα (13,14)), which promotes ADP release from MutS. This is confirmed by nucleotide exchange kinetics (Supplementary Figure S7) that show that ADP dissociation is only increased upon addition of mismatched DNA, and to the same extent if the exchange is performed with ADP or ATP. An additional difference between the prokaryotic and eukaryotic homologs is the high-affinity site for ADP which, based on the available crystallographic data, does not reside in the same subunit (4,15). These intriguing differences in details of nucleotide binding may be a consequence of the different oligomeric composition that enforces preexisting asymmetry in the case of heterodimeric proteins, but allows alternating high-affinity sites within homodimeric MutS in the absence of DNA.
Implications for DNA mismatch repair
The nucleotide occupancy of E. coli MutS strongly depends on whether mismatched DNA is bound or not. One of the strengths of our MS assay is the ability to observe individual states rather than a bulk average. It is instructive to consider the different DNA- and nucleotide-bound species of MutS as a collection of allosteric states. The time MutS spends in each state depends on the stability of this state. Addition of the effector ligands (mismatched DNA and nucleotide) redistributes the abundances of the different states. More specifically, binding to mismatched DNA switches MutS from a collection of different ADP-containing states, all able to recognize DNA, toward the double ATP state that no longer has the capability to bind to a DNA mismatch, but can slide along the DNA in the ‘activated’ conformation. Upon mismatch binding, the abundance of the allosteric states shifts from upper left to lower right in the diagram (Figure 4). The key intermediate in this activating pathway is the single ATP containing state that is unstable in the absence of DNA (ATP will be rapidly hydrolyzed) but is stabilized by binding of the effector ligand (mismatched DNA inhibits ATP hydrolysis). Equilibrium binding of this nucleotide is not influenced by the DNA mismatch; we have previously shown that the equilibrium dissociation constant for nucleotide binding to the high-affinity site is identical in the absence and presence of DNA (34). In contrast to previously reported bulk studies, that proposed mixed MutS nucleotide state formation on mismatched DNA (19,22), our MS assay specifically allowed detection of the single nucleoside triphosphate state, from which the remaining ADP has released due to binding of mismatched DNA. Hydrolysis of this ATP is inhibited (19,25) and binding of the second ATP to subunit B induces the conformational change in which the mismatch binding subunits release the DNA and MutS forms a sliding clamp that travels along the DNA in a hydrolysis-independent manner and initiates repair. In the presence of perfectly paired homoduplex DNA, the single ATP-containing state on DNA is not stable (ATP hydrolysis is not inhibited (19,25)), resulting in release from the DNA before the conformational change towards the activated sliding clamp can be initiated. The allosteric ensemble returns to the states in the upper left of the diagram before the states in the lower right part can be reached. Thus by forming this stable ATP-bound state on mismatched DNA, MutS verifies that it is bound to a DNA mismatch, induces release of the remaining ADP followed by ATP binding and sliding clamp formation and as such mismatch repair is properly initiated.
Implications for asymmetric ATPases
The DNA repair and—maintenance ABC proteins share structural as well as mechanistic aspects with the ABC transporters (8). In the MutS and SMC/Rad50 family, interactions between the nucleotide binding domains and the substrate binding domains are mediated via the same motifs as in the BtuCD transporter (44), indicating a conserved mechanism for signal transduction. Both MutS/MutSα and the transporters have been compared to the GTPase switches in their use of ATP to switch between active and inactive states (9,23,24). Substrate binding (DNA by MutS, a drug by the transporter) induces a conformational change that allows ATP binding. This ATP binding induces a conformational change that results in transport of the substrate in the transporters and in modulation of DNA binding in MutS. In both cases, the substrates increase the steady state ATPase turnover by acceleration of the rate-limiting step of the basal (uncoupled) ATPase activity (23,24,45). At the same time, the ATPase asymmetry in MutS allows verification of mismatch binding. If by analogy, the ATPase asymmetry serves a similar role in the transporters, this could allow a putative regulatory NBD to verify if a proper substrate is bound before commitment toward transport has occurred.
Bacterial MutS is a clear example of functional asymmetry in a homodimeric ABC protein, even in the absence of DNA binding (20,22). Interestingly, the case of Thermus aquaticus MutS shows that functional asymmetry is not always apparent from high-resolution structural analysis (5,19). Therefore functional ATPase asymmetry in ABC transporters could be more widespread than is now apparent from available symmetric homodimeric and twin cassette ABC high-resolution structures (6).
SUPPLEMENTARY DATA
Supplementary Data are available at NAR Online.
FUNDING
The research leading to these results has received funding from the European Community's Seventh Framework Programme (FP7/2007-2013) under grant agreement n° [223545] ‘mismatch2model’; the Nederlandse Organisatie voor Wetenschappelijk Onderzoek (VENI 700.55.405 to S.C., VENI 700.54.402 to R.H., VENI 700.53.407 and VIDI 700.58.428 to J.L.); European Union (Marie Curie Fellowship HPMT-CT-2001-00389 to M.M.); Deutsche Forschungsgemeinschaft (GRK 1384 to P.F.); Center for Biomedical Genetics; Netherlands Proteomics Centre and the Dutch Cancer Society (Project 04-3084). Funding for open access charge: NWO, Nederlandse Organisatie voor Wetenschappelijk Onderzoek.
Conflict of interest statement. None declared.
Supplementary Material
ACKNOWLEDGEMENTS
We thank Michele Cristovao, Niels de Wind and Heinz Jacobs for critical reading of the manuscript. S.C. thanks Garib Murshudov for fruitful discussion on the application of bootstrap resampling. R.H., M.M., J.L. and T.S. designed MS experiments; M.M., A.B. and R.H. performed MS experiments; M.M, R.H., J.L. and T.S. analyzed and interpreted MS experiments; A.F., H.W., and J.L. performed biochemical experiments; A.F., P.F., T.S and J.L interpreted biochemical experiments; S.C. and A.P. designed the MS data model, fitting procedures and statistical analysis methods; S.C. and J.L. implemented MS analysis methods and analyzed data; S.C., A.P., T.S., P.F. and J.L. interpreted the quantitative MS analysis; M.M., A.H., S.C., T.S. and J.L. wrote the manuscript.
REFERENCES
- 1.Iyer RR, Pluciennik A, Burdett V, Modrich PL. DNA mismatch repair: functions and mechanisms. Chem. Rev. 2006;106:302–323. doi: 10.1021/cr0404794. [DOI] [PubMed] [Google Scholar]
- 2.Jiricny J. The multifaceted mismatch-repair system. Nat. Rev. Mol. Cell Biol. 2006;7:335–346. doi: 10.1038/nrm1907. [DOI] [PubMed] [Google Scholar]
- 3.Kunkel TA, Erie DA. DNA mismatch repair. Annu. Rev. Biochem. 2005;74:681–710. doi: 10.1146/annurev.biochem.74.082803.133243. [DOI] [PubMed] [Google Scholar]
- 4.Lamers MH, Perrakis A, Enzlin JH, Winterwerp HH, de Wind N, Sixma TK. The crystal structure of DNA mismatch repair protein MutS binding to a G x T mismatch. Nature. 2000;407:711–717. doi: 10.1038/35037523. [DOI] [PubMed] [Google Scholar]
- 5.Obmolova G, Ban C, Hsieh P, Yang W. Crystal structures of mismatch repair protein MutS and its complex with a substrate DNA. Nature. 2000;407:703–710. doi: 10.1038/35037509. [DOI] [PubMed] [Google Scholar]
- 6.Locher KP. Review. Structure and mechanism of ATP-binding cassette transporters. Philos. Trans. R. Soc. Lond. B Biol. Sci. 2009;364:239–245. doi: 10.1098/rstb.2008.0125. [DOI] [PMC free article] [PubMed] [Google Scholar]
- 7. Holland,I.B., Cole,S.P.C., Kuchler,K. andHiggins,C.F. (2003) ABC Proteins: From Bacteria to Man. Academic, London.
- 8.Hopfner KP, Tainer JA. Rad50/SMC proteins and ABC transporters: unifying concepts from high-resolution structures. Curr. Opin. Struct. Biol. 2003;13:249–255. doi: 10.1016/s0959-440x(03)00037-x. [DOI] [PubMed] [Google Scholar]
- 9.Higgins CF, Linton KJ. The ATP switch model for ABC transporters. Nat. Struct. Mol. Biol. 2004;11:918–926. doi: 10.1038/nsmb836. [DOI] [PubMed] [Google Scholar]
- 10.Iaccarino I, Marra G, Palombo F, Jiricny J. hMSH2 and hMSH6 play distinct roles in mismatch binding and contribute differently to the ATPase activity of hMutSalpha. EMBO J. 1998;17:2677–2686. doi: 10.1093/emboj/17.9.2677. [DOI] [PMC free article] [PubMed] [Google Scholar]
- 11.Studamire B, Quach T, Alani E. Saccharomyces cerevisiae Msh2p and Msh6p ATPase activities are both required during mismatch repair. Mol. Cell. Biol. 1998;18:7590–7601. doi: 10.1128/mcb.18.12.7590. [DOI] [PMC free article] [PubMed] [Google Scholar]
- 12.Antony E, Hingorani MM. Mismatch recognition-coupled stabilization of Msh2-Msh6 in an ATP-bound state at the initiation of DNA repair. Biochemistry. 2003;42:7682–7693. doi: 10.1021/bi034602h. [DOI] [PMC free article] [PubMed] [Google Scholar]
- 13.Martik D, Baitinger C, Modrich P. Differential specificities and simultaneous occupancy of human MutSalpha nucleotide binding sites. J. Biol. Chem. 2004;279:28402–28410. doi: 10.1074/jbc.M312108200. [DOI] [PubMed] [Google Scholar]
- 14.Mazur DJ, Mendillo ML, Kolodner RD. Inhibition of Msh6 ATPase activity by mispaired DNA induces a Msh2(ATP)-Msh6(ATP) state capable of hydrolysis-independent movement along DNA. Mol. Cell. 2006;22:39–49. doi: 10.1016/j.molcel.2006.02.010. [DOI] [PubMed] [Google Scholar]
- 15.Warren JJ, Pohlhaus TJ, Changela A, Iyer RR, Modrich PL, Beese LS. Structure of the human MutSalpha DNA lesion recognition complex. Mol. Cell. 2007;26:579–592. doi: 10.1016/j.molcel.2007.04.018. [DOI] [PubMed] [Google Scholar]
- 16.Carson MR, Travis SM, Welsh MJ. The two nucleotide-binding domains of cystic fibrosis transmembrane conductance regulator (CFTR) have distinct functions in controlling channel activity. J. Biol. Chem. 1995;270:1711–1717. doi: 10.1074/jbc.270.4.1711. [DOI] [PubMed] [Google Scholar]
- 17.Urbatsch IL, Sankaran B, Bhagat S, Senior AE. Both P-glycoprotein nucleotide-binding sites are catalytically active. J. Biol. Chem. 1995;270:26956–26961. doi: 10.1074/jbc.270.45.26956. [DOI] [PubMed] [Google Scholar]
- 18.Yang R, Cui L, Hou YX, Riordan JR, Chang XB. ATP binding to the first nucleotide binding domain of multidrug resistance-associated protein plays a regulatory role at low nucleotide concentration, whereas ATP hydrolysis at the second plays a dominant role in ATP-dependent leukotriene C4 transport. J. Biol. Chem. 2003;278:30764–30771. doi: 10.1074/jbc.M304118200. [DOI] [PubMed] [Google Scholar]
- 19.Antony E, Hingorani MM. Asymmetric ATP binding and hydrolysis activity of the Thermus aquaticus MutS dimer is key to modulation of its interactions with mismatched DNA. Biochemistry. 2004;43:13115–13128. doi: 10.1021/bi049010t. [DOI] [PMC free article] [PubMed] [Google Scholar]
- 20.Lamers MH, Winterwerp HH, Sixma TK. The alternating ATPase domains of MutS control DNA mismatch repair. EMBO J. 2003;22:746–756. doi: 10.1093/emboj/cdg064. [DOI] [PMC free article] [PubMed] [Google Scholar]
- 21.van Veen HW, Margolles A, Muller M, Higgins CF, Konings WN. The homodimeric ATP-binding cassette transporter LmrA mediates multidrug transport by an alternating two-site (two-cylinder engine) mechanism. EMBO J. 2000;19:2503–2514. doi: 10.1093/emboj/19.11.2503. [DOI] [PMC free article] [PubMed] [Google Scholar]
- 22.Bjornson KP, Modrich P. Differential and simultaneous adenosine di- and triphosphate binding by MutS. J. Biol. Chem. 2003;278:18557–18562. doi: 10.1074/jbc.M301101200. [DOI] [PubMed] [Google Scholar]
- 23.Gradia S, Acharya S, Fishel R. The human mismatch recognition complex hMSH2-hMSH6 functions as a novel molecular switch. Cell. 1997;91:995–1005. doi: 10.1016/s0092-8674(00)80490-0. [DOI] [PubMed] [Google Scholar]
- 24.Acharya S, Foster PL, Brooks P, Fishel R. The coordinated functions of the E. coli. MutS and MutL proteins in mismatch repair. Mol. Cell. 2003;12:233–246. doi: 10.1016/s1097-2765(03)00219-3. [DOI] [PubMed] [Google Scholar]
- 25.Bjornson KP, Allen DJ, Modrich P. Modulation of MutS ATP hydrolysis by DNA cofactors. Biochemistry. 2000;39:3176–3183. doi: 10.1021/bi992286u. [DOI] [PubMed] [Google Scholar]
- 26.Lebbink JH, Georgijevic D, Natrajan G, Fish A, Winterwerp HH, Sixma TK, de Wind N. Dual role of MutS glutamate 38 in DNA mismatch discrimination and in the authorization of repair. EMBO J. 2006;25:409–419. doi: 10.1038/sj.emboj.7600936. [DOI] [PMC free article] [PubMed] [Google Scholar]
- 27.Junop MS, Obmolova G, Rausch K, Hsieh P, Yang W. Composite active site of an ABC ATPase: MutS uses ATP to verify mismatch recognition and authorize DNA repair. Mol. Cell. 2001;7:1–12. doi: 10.1016/s1097-2765(01)00149-6. [DOI] [PubMed] [Google Scholar]
- 28.Owen BA, Lang WH, McMurray CT. The nucleotide binding dynamics of human MSH2-MSH3 are lesion dependent. Nat. Struct. Mol. Biol. 2009;16:550–557. doi: 10.1038/nsmb.1596. [DOI] [PMC free article] [PubMed] [Google Scholar]
- 29.Ruotolo BT, Robinson CV. Aspects of native proteins are retained in vacuum. Curr. Opin. Chem. Biol. 2006;10:402–408. doi: 10.1016/j.cbpa.2006.08.020. [DOI] [PubMed] [Google Scholar]
- 30.van den Heuvel RH, Heck AJ. Native protein mass spectrometry: from intact oligomers to functional machineries. Curr. Opin. Chem. Biol. 2004;8:519–526. doi: 10.1016/j.cbpa.2004.08.006. [DOI] [PubMed] [Google Scholar]
- 31.Heck AJ. Native mass spectrometry: a bridge between interactomics and structural biology. Nat. Methods. 2008;5:927–933. doi: 10.1038/nmeth.1265. [DOI] [PubMed] [Google Scholar]
- 32.Wu TH, Marinus MG. Deletion mutation analysis of the mutS gene in Escherichia coli. J. Biol. Chem. 1999;274:5948–5952. doi: 10.1074/jbc.274.9.5948. [DOI] [PubMed] [Google Scholar]
- 33.Natrajan G, Lamers MH, Enzlin JH, Winterwerp HH, Perrakis A, Sixma TK. Structures of Escherichia coli DNA mismatch repair enzyme MutS in complex with different mismatches: a common recognition mode for diverse substrates. Nucleic Acids Res. 2003;31:4814–4821. doi: 10.1093/nar/gkg677. [DOI] [PMC free article] [PubMed] [Google Scholar]
- 34.Lebbink JH, Fish A, Reumer A, Natrajan G, Winterwerp HH, Sixma TK. Magnesium coordination controls the molecular switch function of DNA mismatch repair protein MutS. J. Biol. Chem. 2010;285:13131–13141. doi: 10.1074/jbc.M109.066001. [DOI] [PMC free article] [PubMed] [Google Scholar]
- 35.Chernushevich IV, Thomson BA. Collisional cooling of large ions in electrospray mass spectrometry. Anal. Chem. 2004;76:1754–1760. doi: 10.1021/ac035406j. [DOI] [PubMed] [Google Scholar]
- 36.Tahallah N, Pinkse M, Maier CS, Heck AJ. The effect of the source pressure on the abundance of ions of noncovalent protein assemblies in an electrospray ionization orthogonal time-of-flight instrument. Rapid Commun. Mass Spectrom. 2001;15:596–601. doi: 10.1002/rcm.275. [DOI] [PubMed] [Google Scholar]
- 37.van den Heuvel RH, van Duijn E, Mazon H, Synowsky SA, Lorenzen K, Versluis C, Brouns SJ, Langridge D, van der Oost J, Hoyes J, et al. Improving the performance of a quadrupole time-of-flight instrument for macromolecular mass spectrometry. Anal. Chem. 2006;78:7473–7483. doi: 10.1021/ac061039a. [DOI] [PubMed] [Google Scholar]
- 38.Manelyte L, Urbanke C, Giron-Monzon L, Friedhoff P. Structural and functional analysis of the MutS C-terminal tetramerization domain. Nucleic Acids Res. 2006;34:5270–5279. doi: 10.1093/nar/gkl489. [DOI] [PMC free article] [PubMed] [Google Scholar]
- 39.Mendillo ML, Putnam CD, Kolodner RD. Escherichia coli MutS tetramerization domain structure reveals that stable dimers but not tetramers are essential for DNA mismatch repair in vivo. J. Biol. Chem. 2007;282:16345–16354. doi: 10.1074/jbc.M700858200. [DOI] [PubMed] [Google Scholar]
- 40.Bjornson KP, Blackwell LJ, Sage H, Baitinger C, Allen D, Modrich P. Assembly and molecular activities of the MutS tetramer. J. Biol. Chem. 2003;278:34667–34673. doi: 10.1074/jbc.M305513200. [DOI] [PubMed] [Google Scholar]
- 41.Biswas I, Ban C, Fleming KG, Qin J, Lary JW, Yphantis DA, Yang W, Hsieh P. Oligomerization of a MutS mismatch repair protein from Thermus aquaticus. J. Biol. Chem. 1999;274:23673–23678. doi: 10.1074/jbc.274.33.23673. [DOI] [PubMed] [Google Scholar]
- 42.Jacobs-Palmer E, Hingorani MM. The Effects of Nucleotides on MutS-DNA Binding Kinetics Clarify the Role of MutS ATPase Activity in Mismatch Repair. J. Mol. Biol. 2007;366:1087–1098. doi: 10.1016/j.jmb.2006.11.092. [DOI] [PMC free article] [PubMed] [Google Scholar]
- 43.Antony E, Khubchandani S, Chen S, Hingorani MM. Contribution of Msh2 and Msh6 subunits to the asymmetric ATPase and DNA mismatch binding activities of Saccharomyces cerevisiae Msh2-Msh6 mismatch repair protein. DNA Repair (Amst) 2006;5:153–162. doi: 10.1016/j.dnarep.2005.08.016. [DOI] [PMC free article] [PubMed] [Google Scholar]
- 44.Lebbink JH, Sixma TK. Variations on the ABC. Structure. 2005;13:498–500. doi: 10.1016/j.str.2005.03.003. [DOI] [PubMed] [Google Scholar]
- 45.Al-Shawi MK, Polar MK, Omote H, Figler RA. Transition state analysis of the coupling of drug transport to ATP hydrolysis by P-glycoprotein. J. Biol. Chem. 2003;278:52629–52640. doi: 10.1074/jbc.M308175200. [DOI] [PubMed] [Google Scholar]
Associated Data
This section collects any data citations, data availability statements, or supplementary materials included in this article.