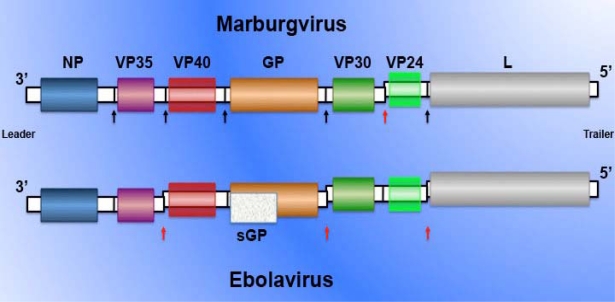
Figure 1.
MARV and EBOV genome organization. Black and red arrows indicate intergenic regions. Red arrows depict stop transcription site of an upstream gene (genomic sense) overlapping the start transcription site of a downstream gene. sGP: Non-structural soluble glycoprotein, product of a non-edited GP gene transcript in EBOV species. Adapted from reference [1].

