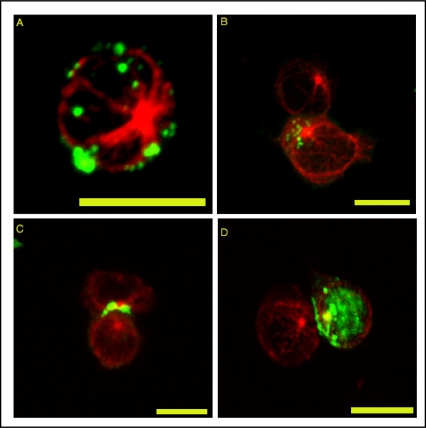
Figure 1.
Polarization of HTLV-1 proteins and the microtubules network toward the VS formed between autologous CD4+ cells naturally infected with HTLV-1. (A–C) HTLV-1 Gag protein. (D) HTLV-1 Tax protein. (A) Isolated cell. (C–D) autologous CD4+ conjugates. Scale bars = 10μm. Originally published in Journal of Biological Chemistry [35].

