Abstract
The organic anion–transporting polypeptide 1b family (Oatp1b2 in rodents and OATP1B1/1B3 in humans) is liver-specific and transports various chemicals into the liver. However, the role of the Oatp1b family in the hepatic uptake of bile acids (BAs) into the liver is unknown. Therefore, in Oatp1b2-null mice, the concentrations of BAs in plasma, liver, and bile were compared with wild-type (WT) mice. It was first determined that livers of the Oatp1b2-null mice were not compensated by altered expression of other hepatic transporters. However, the messenger RNA of Cyp7a1 was 70% lower in the Oatp1b2-null mice. Increased expression of fibroblast growth factor 15 in intestines of Oatp1b2-null mice might be responsible for decreased hepatic expression of Cyp7a1 in Oatp1b2-null mice. The hepatic concentration and biliary excretion of conjugated and unconjugated BAs were essentially the same in Oatp1b2-null and WT mice. The serum concentration of taurine-conjugated BAs was essentially the same in the two genotypes. In contrast, the serum concentrations of unconjugated BAs were 3–45 times higher in Oatp1b2-null than WT mice. After intravenous administration of cholate to Oatp1b2-null mice, its clearance was 50% lower than in WT mice, but the clearance of taurocholate was similar in the two genotypes.
Conclusion
This study indicates that Oatp1b2 has a major role in the hepatic uptake of unconjugated BAs.
The liver orchestrates several different vital functions, including carbohydrate, amino acid, and lipid metabolism; plasma protein and coagulation factor synthesis; and endobiotic and xenobiotic biotransformation. The liver participates in the elimination of endobiotics and xenobiotics not only through biotransformation but also through biliary excretion. Biliary excretion is a vital process in that it allows elimination of endobiotics and xenobiotics >325 ± 50 Da.1 For effective biliary excretion, the liver has to maintain bile flow, which is driven primarily by canalicular bile acid (BA) secretion.2 The BAs are amphiphilic biological detergents and are synthesized by several enzymes from cholesterol. In humans, approximately 800 mg of cholesterol is synthesized daily, half of which is biotransformed to BAs, the major pathway for cholesterol elimination.3 In the intestine, BAs are required for efficient absorption of dietary fat and fat-soluble vitamins by increasing the surface area of lipid droplets in the small intestine, providing optimal conditions for pancreatic lipase.4
More than 90% of secreted BAs are reabsorbed from the intestine. After their reabsorption, bile acids are taken up by hepatocytes from the portal blood by way of sodium taurocholate cotransporting polypeptide (Ntcp) and sodium-independent organic anion–transporting polypeptides (Oatps). The basolateral membrane of hepatocytes has several Oatp transporters, which have overlapping substrates. In mouse liver, Oatp1a1, Oatp1a4, Oatp1b2, and Oatp2b1 transporters are highly expressed. Oatp1b2 (human orthologs are OATP1B1 and OATP1B3) is expressed almost exclusively in the liver and is considered the major liver-specific uptake transporter for drugs and other xenobiotics.5 To determine the roles of Oatp1b2, our laboratory engineered an Oatp1b2-null mouse and showed that Oatp1b2 is crucial in transporting phalloidin and microcystin-LR into the liver.6 It is known from in vitro studies that Oatp1b2 can transport several endogenous compounds, including BAs,7 but very little is known about the function of Oatp1b2 in vivo. Therefore, the purpose of this study was to determine the in vivo role of Oatp1b2 in bile acid homeostasis.
Materials and Methods
Chemicals
BA standards were purchased either from Steraloids, Inc. (Newport, RI) or from Sigma-Aldrich (St. Louis, MO). All other chemicals were purchased from Sigma-Aldrich unless noted otherwise.
Animals
Seven-week-old male C57BL/6 wild-type (WT) mice were purchased from Charles River Laboratories, Inc. (Wilmington, MA). Oatp1b2-null mice were engineered in our laboratory.6 Oatp1b2-null mice were back-crossed into a C57BL/6 background, and >99% congenicity was confirmed by the speed congenics group at Jackson Laboratories (Bar Harbor, ME). WT mice were acclimated for at least 1 week in an American Animal Associations Laboratory Animal Care accredited facility under a standard temperature-, light-, and humidity-controlled environment. Mice had free access to Laboratory Rodent Chow 8604 (Harlan, Madison, WI) and drinking water. Studies were approved by the University of Kansas Medical Center Institutional Animal Care and Use Committee.
Tissue Collection
Blood was collected from the suborbital veins of 8-week-old WT and Oatp1b2-null mice anesthetized with 50 mg/kg pentobarbitol (n = 6), and the livers and ilea were removed. Serum samples were separated using Microtainer separating tubes (BD Biosciences, San Jose, CA). Liver and ileum samples were frozen in liquid nitrogen and stored at −80°C until further analysis.
Bile Collection
Separate groups of 8-week-old WT and Oatp1b2-null mice (n = 6) were anesthetized intraperitoneally with a ketamine/midazolam mixture (100 and 5 mg/kg, respectively), and the common bile duct of each mouse was cannulated through a high abdominal incision with the shaft of a 30-gauge needle attached to PE-10 tubing. After collection of 10-minute pre-bile, bile samples were collected for two 15-minute periods in preweighed 0.6-mL microcentrifuge tubes on ice. The volumes of bile were determined gravimetrically, using 1.0 for specific gravity.
Plasma Elimination Studies
The plasma elimination of BAs was performed on 28- to 38-g, 9- to 12-month-old, age-matched Oatp1b2-null and WT mice (n = 6). The mice were anesthetized intraperitoneally with ketamine/midazolam (100 and 5 mg/kg, respectively), and the body temperature of each mouse was maintained at 37°C with a heating pad. Subsequently, the right carotid artery was cannulated with PE-10 tubing. To avoid possible renal elimination of BAs, the renal pedicles were ligated through a median abdominal incision. To prevent the enterohepatic recirculation of BAs, the common bile duct was cannulated as described above. After stabilizing bile flow with 10-minute bile collection, each mouse was injected intravenously with one of the BAs (50 µmol/kg)—sodium cholate or sodium taurocholate in saline (10 mL/kg)—through the left saphenous vein. Blood samples (≈30–40 µL) were collected at 2, 5, 11, 21, 31, and 41 minutes after BA administration into heparinized tubes.
RNA Extraction
Total tissue RNA was extracted using RNA-Bee reagent (Tel-Test, Inc., Friendswood, TX) according to the manufacturer’s protocol. Each RNA pellet was redissolved in 0.2 mL of diethyl pyrocarbonate-treated water. RNA concentrations were quantified by way of ultraviolet absorbance at 260 nm. RNA integrity was confirmed by way of agarose gel electrophoresis of 5 µg of total RNA and visualization of the intact 18S and 28S bands by way of ethidium bromide staining.
Messenger RNA Quantification
The messenger RNA (mRNA) expression of genes in liver and ileum samples was determined using Quantigene Plex 2.0 (Panomics/Affymetix, Inc., Fremont, CA). Individual bead-based oligonucleotide probe sets, specific for each gene examined, were developed by Panomics/Affymetix, Inc. Genes and accession numbers are freely available at http://www.panomics.com (sets #21021 and #21151). Samples were analyzed using a Bio-Plex 200 System Array reader with Luminex 100 xMAP, and data were acquired using Bio-Plex Data Manager version 5.0 (Bio-Rad, Hercules, CA). Assays were performed according to each manufacturers’ protocol. All data were standardized to the internal control glyceraldehyde 3-phosphate dehydrogenase. The mRNA of farnesoid X receptor (FXR) and small heterodimer partner (SHP) was quantified with QuantiGene 1.0 (Panomics) as described.8 The probe set for SHP has also been described.9 Probe sets for FXR (Supporting Information Table 1) were designed using ProbeDesigner 1.0 (Bayer Corp., Emeryville, CA) and synthesized by Integrated DNA Technologies, Inc. (Coralville, IA).
Bile Acid Analysis
Sample Preparation for Bile Acid Analysis
Internal standards, as well as bile, plasma, and liver samples, were prepared for bile-acid speciation as described by Alnouti et al.10 with modifications.11 Briefly, plasma samples were deproteinized with ice-cold acetonitrile containing internal standards (d4-G-CDCA, d4-CDCA). The supernatants were removed, dried under vacuum, and reconstituted in 50% methanol. For extraction of bile acids from liver, 100–110 mg of livers were homogenized in 500 µL water, and an additional 1 volume of 50% methanol. The liver homogenates (600 µL) were transferred to a new tube and 10 µL of internal standard, and 3 mL of ice-cold acetonitrile was added. The mixtures were shaken vigorously for 1 hour and centrifuged at 11,000g for 10 minutes. The supernatants were transferred to a glass tube. The pellets were re-extracted with another 1 mL of methanol. Resultant supernatants from two extractions were combined, evaporated under vacuum for 3 hours at 50°C, and reconstituted in 100 µL of 50% methanol. The bile samples were diluted 100-fold with deionized water, mixed with internal standards, and loaded onto Oasis-HLB SPE cartridges preconditioned with methanol and water (Waters, Milford, MA). The loaded cartridges were washed with water and eluted with methanol. The eluates were evaporated under vacuum and reconstituted in 50% methanol.
Quantification of Individual BAs by Way of Ultraperformance Liquid Chromatography–Mass Spectrometry
BAs were speciated and quantified by reverse-phase ultraperformance liquid chromatography–mass spectrometry. The equipment used and the conditions of the ultraperformance liquid chromatography–mass spectrometry have been described.10,11 Quantification of the various bile acids was based on peak areas of samples and authentic standards (unconjugated bile acids: α and β muricholic acids [MCAs], cholic acid [CA], ursodeoxycholic acid [UDCA], chenodeoxycholic acid [CDCA], deoxycholic acid [DCA], hyodeoxycholic acid [HDCA], murideoxycholic acid [MDCA], lithocholic acid [LCA]; glycine [G] conjugates: G-CA, G-UDCA, G-CDCA, G-DCA, G-LCA; and taurine [T] conjugates: T-MCA, T-CA, T-UDCA, T-CDCA, T-DCA, and T-LCA).
Pharmacokinetics
The plasma concentrations (Cp) of CA and T-CA after intravenous administration were found to fit an open two-compartment pharmacokinetic model described by the following biexponential equation:
where A and α are, respectively, the y intercept and the elimination rate constant of the distributive phase, and B and β hybrid constants, respectively, represent the y intercept and elimination rate constant of the terminal phase. The data were fit to the exponential components of the equation through a method of least squares with the coefficient of correlation used as the indicator of data fit. This curve fitting was performed using SigmaPlot 10.0 (Systat Software, Inc., San Jose, CA). The model describes the distribution of CA and T-CA between a central compartment, Vdcent (plasma and plasma-like tissue), and a peripheral compartment (Vdperiph − all other tissues that behave kinetically differently from plasma). D is the administered dose. The distribution half-life time (T1/2 dist), elimination half-life time (T1/2 el), the apparent volume of distribution at steady state (Vapp) for the central compartment (Vcent) and the peripheral compartment (Vperiph), and total body clearance (Cl) were calculated based on the following equations:
Statistical Analysis
The individual values were log-transformed to obtain normal distribution before performing the t test. The differences between Oatp1b2-null and WT mice were determined by way of Student t test, with significance set at P < 0.05.
Results
Serum Concentrations of BAs in WT and Oatp1b2-Null Mice
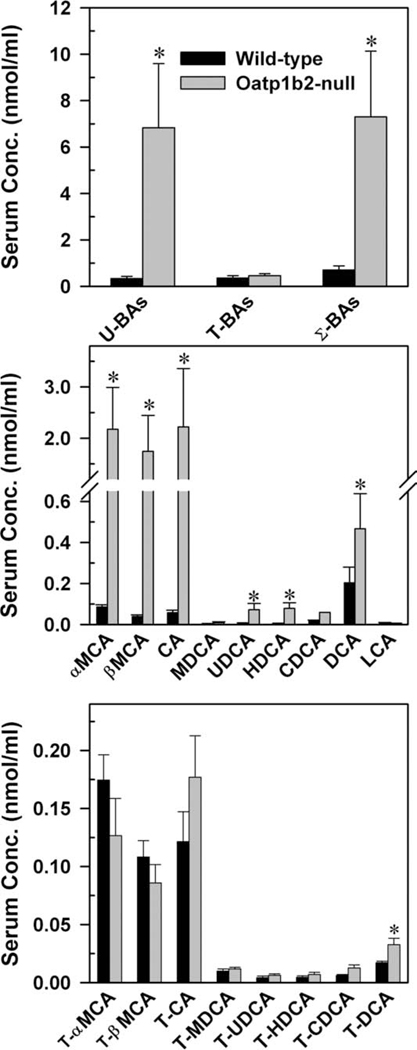
Concentrations of BAs in the serum of 8-week-old WT and Oatp1b2-null mice are depicted in Fig. 1. In WT mice, the total amount of BAs is relatively low (≈1 nmol/mL). The total serum BAs in WT mice comprised approximately equal concentrations of unconjugated- and T-conjugated BAs, with very small amounts of G-conjugated BAs (<1%, data not shown). The unconjugated BAs in the plasma of Oatp1b2-null mice were 3- to 45-fold higher than in WT mice, except for MDCA and LCA (middle panel). BAs that were increased the most in Oatp1b2-null mice were βMCA (45-fold), CA (38-fold), and αMCA (25-fold). There was an intermediate increase in the plasma concentrations of HDCA (15-fold) and UDCA (11-fold) and less of an increase in DCA (2.3-fold) and CDCA (three-fold) in Oatp1b2-null mice.
Fig. 1.
Serum concentration of total bile acids (top), individual unconjugated bile acids (middle), and individual T-conjugated bile acids (bottom) in 2-month-old male WT and Oatp1b2-null mice. Bars represent the mean ± SE of 6 mice. *Statistically significant difference (P < 0.05) from the respective value of WT mice. Σ-BAs, total bile acids; T-BAs, T-conjugated bile acids; U-BAs, unconjugated bile acids.
Absence of the Oatp1b2 transporter did not influence the serum concentrations of either G-conjugated (data not shown) or T-conjugated BAs, with the exception of T-DCA, which almost doubled in Oatp1b2-null mice. In conclusion, the concentration of unconjugated BAs was approximately 20-fold higher in Oatp1b2-null mice, resulting in a 10-fold increase in total serum BAs relative to WT mice.
Hepatic Concentrations of BAs in WT and Oatp1b2-Null Mice
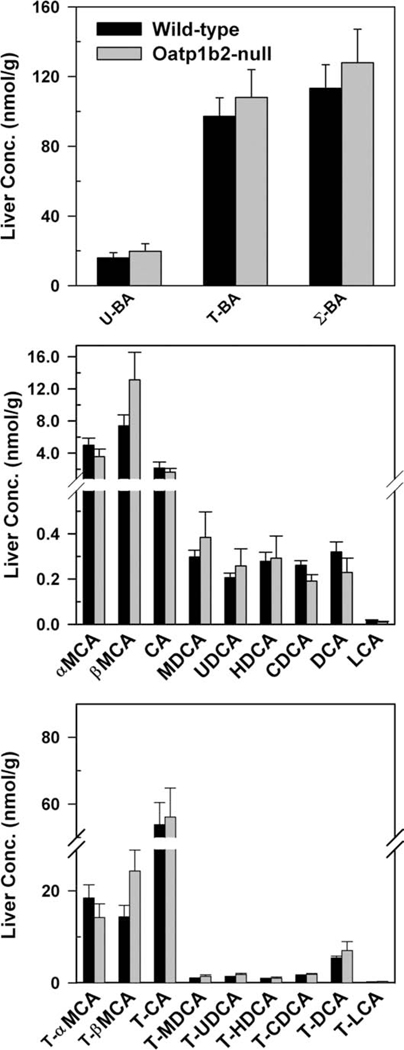
Fig. 2 demonstrates the concentrations of BAs in livers of WT and Oatp1b2-null mice. In mouse liver, similar to plasma, the concentrations of G-conjugated BAs were low (<0.1%, data not shown). There were no differences in the hepatic concentration of either unconjugated or conjugated (T and G) BAs between Oatp1b2-null and WT mice.
Fig. 2.
Hepatic concentration of total bile acids (top), individual unconjugated bile acids (middle), and individual T-conjugated bile acids (bottom) in 2-month-old male WT and Oatp1b2-null mice. Bars represent the mean ± SE of 6 mice. *Statistically significant difference (P < 0.05) from the respective value of WT mice. Σ-BAs, total bile acids; T-BAs, T-conjugated bile acids; U-BAs, unconjugated bile acids.
Biliary Excretion of BAs in WT and Oatp1b2-Null Mice
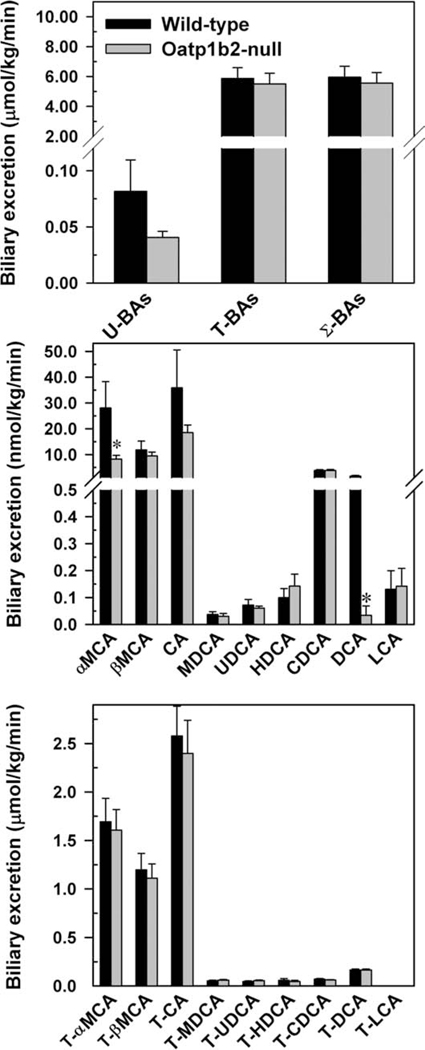
In this experiment, bile samples were collected for two 15-minute periods, but because there were no significant differences in the biliary excretion of BAs between the two 15-minute collection periods, the average biliary excretion rates were used. Similar to plasma and liver, the biliary excretion of G-conjugated BAs is negligible (data not shown). The total biliary excretion of unconjugated BAs tended to be lower in the Oatp1b2-null mice, but it was not statistically significant (Fig. 3). There were no differences in the total biliary excretion of conjugated and total BA excretion between the two genotypes. There were no differences in the biliary excretion of unconjugated BAs, except for αMCA and DCA, which were 71% and 98% lower, respectively, in the Oatp1b2-null mice (middle panel). Lack of the Oatp1b2 transporter did not influence the biliary excretion of T-conjugated (bottom panel) or G-conjugated BAs (data not shown).
Fig. 3.
Biliary excretion of total bile acids (top), individual unconjugated bile acids (middle), and individual T-conjugated bile acids (bottom) in 2-month-old male WT and Oatp1b2-null mice. Bars represent the mean ± SE of 6 mice. *Statistically significant difference (P < 0.05) from the respective value of the WT mice. Σ-BAs, total bile acids; T-BAs, T-conjugated bile acids; U-BAs, unconjugated bile acids.
Plasma Elimination of CA and T-CA in WT and Oatp1b2-Null Mice
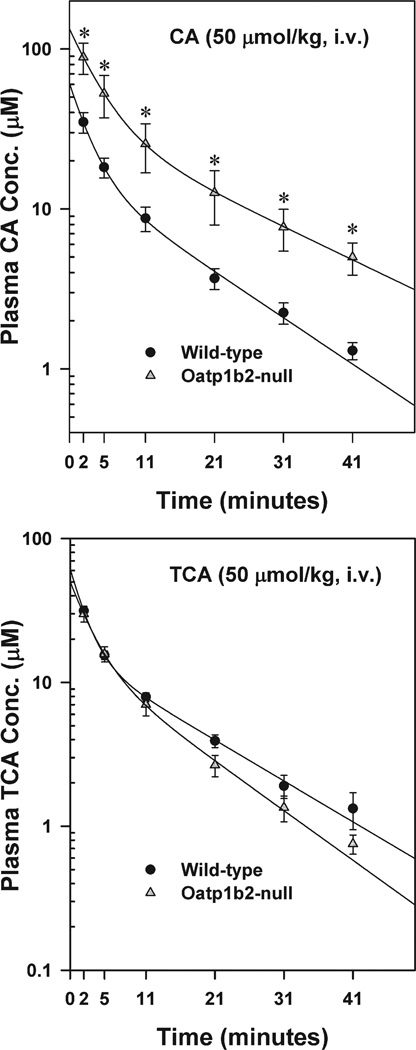
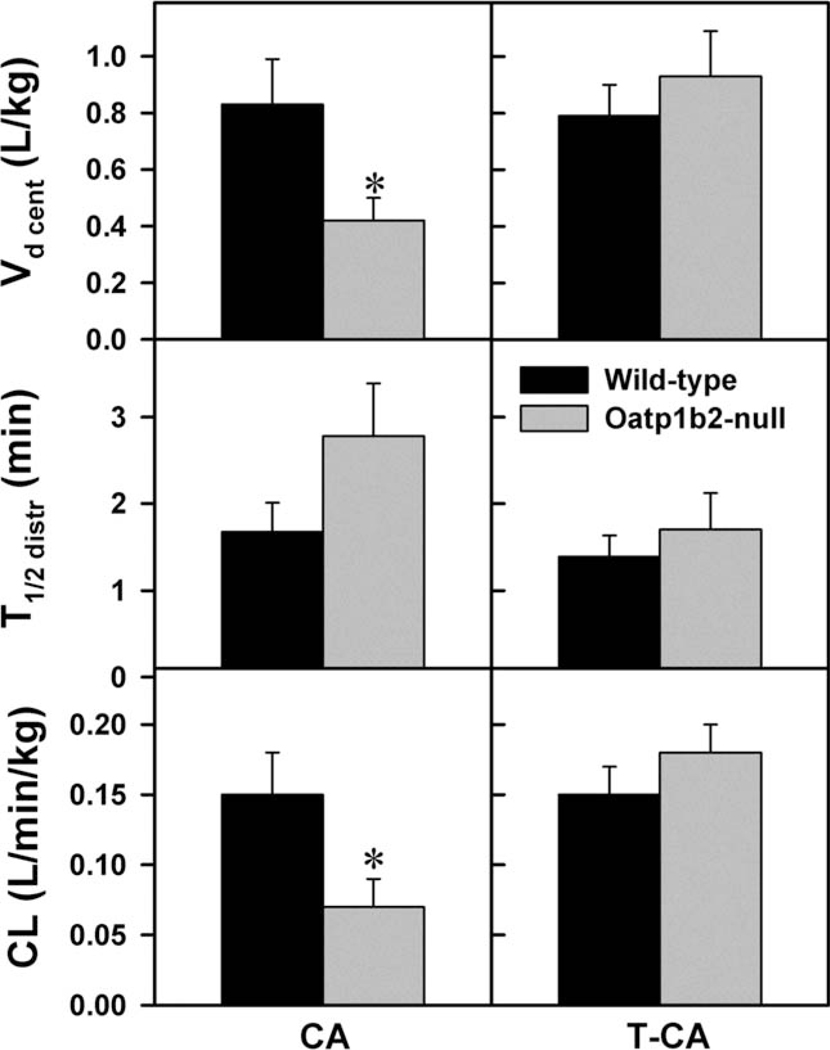
Fig. 4 illustrates the plasma elimination of an intravenous dose of CA (50 µmol/kg) or T-CA (50 µmol/kg). This dose was chosen for both BAs, because in preliminary studies, this dose did not cause hemolysis or signs of cardiac or respiratory toxicity. The plasma disappearance curves indicate that both CA and T-CA can be described by a two-compartment open model of elimination. The major pharmacokinetic parameters were calculated as described in the Materials and Methods. After CA administration, the plasma concentration of CA was 2.5–3.8 fold higher in Oatp1b2-null mice than WT mice (Fig. 4). There were no significant differences in the T1/2 distr (Fig. 5) and T1/2 el (12.84 ± 2.81 versus 18.25 ± 3.62 minutes), Vd periph (4.35 ± 1.28 versus 2.98 ± 0.90 L/kg) and Vd app (2.74 ± 0.69 versus 1.62 ± 0.45 L/kg) of CA in Oatp1b2-null and WT mice; however, the central Vd and Cl were approximately 50% lower in Oatp1b2-null mice compared with WT mice (Fig. 5). In contrast, after administration of T-CA, there were no differences between its plasma concentrations and pharmacokinetic parameters in Oatp1b2-null and WT mice.
Fig. 4.
Plasma disappearance of cholic acid (CA, 50 µmol/kg, intravenous) and taurocholic acid (T-CA, 50 µmol/kg, intravenous) in WT and Oatp1b2-null mice. Symbols represent the mean ± SE of 6 animals. *Statistically significant difference (P < 0.05) from the respective value of WT mice.
Fig. 5.
Vd cent, T1/2 distr, and CL of cholate and taurocholate administered intravenously to WT and Oatp1b2-null mice (50 µmol/kg). Bars represent the mean ± SE of 6 mice. *Statistically significant difference (P < 0.05) from the respective values of WT mice. The calculation of the pharmacokinetic parameters are described in the Materials and Methods.
mRNA Expression of Major Hepatic Sinusoidal Uptake, Efflux, and Canalicular Transporters in WT and Oatp1b2-Null Mice
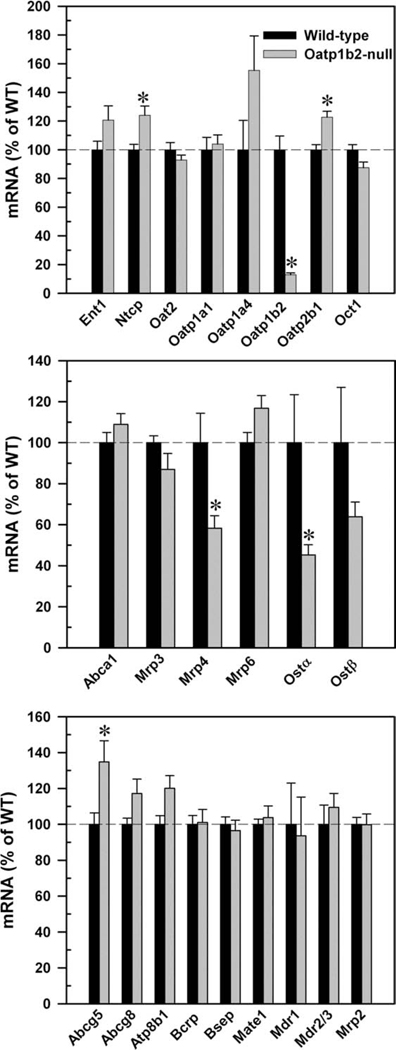
The top panel of Fig. 6 demonstrates that the expression of other uptake transporters was not altered markedly in livers of Oatp1b2-null mice. Obviously, the mRNA expression of Oatp1b2 was nearly abolished in the Oatp1b2-null mice. Ntcp and Oatp2b1 mRNA were approximately 20% higher in the Oatp1b2-null mice than in WT mice. Oatp1a4 also tended to be higher in Oatp1b2-null mice, but it was not statistically significant.
Fig. 6.
mRNA expression of basolateral uptake (top), efflux (middle), and canalicular (bottom) transporters in 2-month-old WT and Oatp1b2-null mouse livers. Bars represent the relative percentage mRNA expression ± SE of 6 mice compared with WT mice values. *Statistically significant difference (P < 0.05) from the respective values of WT mice.
The middle panel of Fig. 6 shows that there were no changes in the expression of basolateral efflux transporters Abca1, multidrug resistance–associated protein (Mrp) 3, or Mrp6, but the mRNA expression of Mrp4 and organic solute transporter (Ost) α was about 40%–50% lower in the Oatp1b2-null mice. As the bottom panel of Fig. 6 indicates, there were no differences in mRNA expression of canalicular transporters in the two genotypes, except Abcg5, which was 35% higher in Oatp1b2-null mice.
mRNA Expression of Major BA Synthesizing Enzymes and the Major Regulating Factors of Cyp7a1 in WT and Oatp1b2-Null Mice
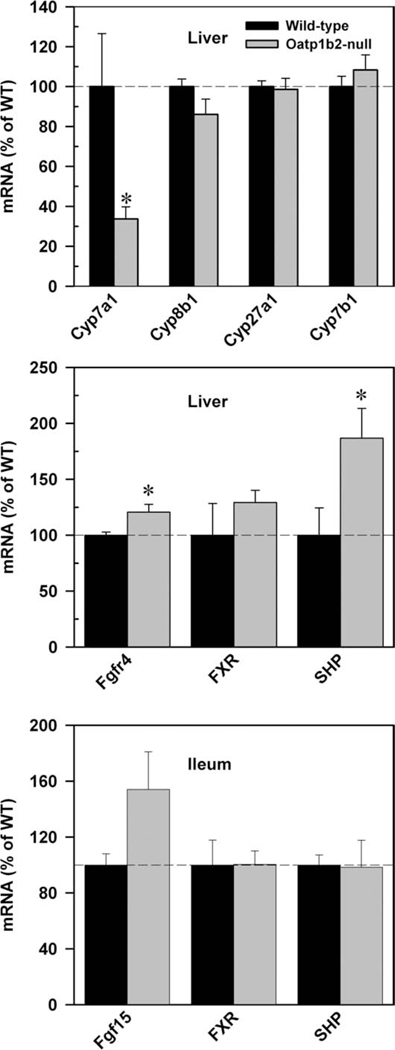
Because there were changes in the disposition of unconjugated BAs, we quantified the mRNA expression of major BA synthetic enzymes in both the classical and alternative pathways. Surprisingly, the mRNA expression of Cyp7a1, the rate-limiting enzyme in the classical pathway, was 70% lower in Oatp1b2-null mice. The alternative pathway of bile acid synthesis was not altered in Oatp1b2-null mice (Fig. 7, top panel).
Fig. 7.
mRNA expression of major bile acid synthetic enzymes (Cyp7a1, 8b1, 27a1, 7b1; top) in the liver, and major Cyp7a1-regulatory factors in livers (middle), and ilea (bottom) of 2-month-old WT and Oatp1b2-null mice. Bars represent the relative percentage mRNA expression ± SE of 6 mice compared with WT mice values. *Statistically significant difference (P < 0.05) from the respective values of WT mice.
To better understand the decrease of Cyp7a1 expression in Oatp1b2-null mice, the mRNA expression of Cyp7a1 regulatory factors was quantified in the liver and ileum. As shown in the middle and bottom panels of Fig. 7, the mRNAs of fibroblast growth factor receptor 4 (Fgfr4, 20%) and SHP (86%) were higher in the livers of Oatp1b2-null mice than in WT mice. The mRNA expression of fibroblast growth factor 15 (Fgf15) in the ileum tended to be higher in Oatp1b2-null mice.
Discussion
The last decade has seen a resurgence of BA research. BAs not only participate in the elimination of cholesterol, activation of pancreatic enzymes, and emulsification of lipid droplets, they are also important signaling molecules that help to control cholesterol, glucose, lipid, and energy homeostasis. BAs also regulate their own homeostasis.12 With regard to BA homeostasis, the body is economic, in that the enterocytes effectively take up most of the luminal BAs and transport them back into the blood, and only 5% of biliary excreted BAs vanish with the feces each day.13,14
It is important to properly regulate the synthesis and enterohepatic recirculation of BAs because of their detergent properties and signaling roles. BA homeostasis is regulated by the orchestration of BA synthesis in the liver, and the uptake and efflux transporters in the liver and terminal ileum. In the intestinal lumen, the conjugated BAs are deconjugated and a portion is metabolized to secondary BAs (e.g., DCA, LCA) by intestinal bacteria. The unconjugated and conjugated BAs are reabsorbed in the terminal ileum mainly by apical sodium-dependent bile acid transporter (Asbt) and delivered to the liver through the portal vein.15 The basolateral uptake transporters in the liver are responsible for lowering BA concentrations in the systemic circulation. Ntcp has a high capacity for transporting T- and G-conjugated bile acids,16,17 whereas hydrophobic bile acids are thought to pass the cell membrane by passive diffusion.18,19 Oatp1a1, Oatp1a4, and Oatp1b2 are all able to transport in vitro both conjugated and unconjugated BAs.16 In Oatp1b2-null mice, the hepatic expression of Oatp1a1 remains unchanged, whereas that of Ntcp, Oatp1a4, and Oatp2b1 tends to be higher (Fig. 5), similar to previous studies.6,20 Thus, the marked accumulation of unconjugated BAs in the plasma of Oatp1b2-null mice is unlikely due to secondary changes in other BA transporters.
Decrease of BA-conjugating enzymes could also contribute to the observed elevation of serum-unconjugated BAs. However, the possibility of decreased activity of conjugating enzymes is very low, because there are no significant differences in either mRNA expression of bile acid–coenzyme A ligase and bile acid coenzyme A:amino acid:N-acyltransferase (Supporting Information Fig. 1) or the concentrations of conjugated and unconjugated BAs in livers of WT and Oatp1b2-null mice. The concentration of total serum BAs is approximately seven-fold higher in Oatp1b2-null mice than in WT mice, which is due to the marked accumulation (10- to 45-fold) of αMCA, βMCA, CA, HDCA, and UDCA in plasma of Oatp1b2-null mice. However, absence of the Oatp1b2 transporter does not increase the plasma concentration of conjugated bile acids, except for T-DCA. This indicates that Oatp1b2 is essential for the hepatic uptake of unconjugated hydrophilic bile acids.
Recently, Xiang et al.21 reported that humans carrying low-activity OATP1B1 polymorphisms have higher blood levels of BAs. Therefore, concentrations of BAs in 12-month-old male Oatp1b2-null, heterozygous, and WT mice were quantified. The 12-month-old Oatp1b2-heterozygous mice have blood levels of α-MCA, β-MCA, and CA that are intermediate between WT and Oatp1b2-null mice (Supporting Information Fig. 2). The clear gene-dosage effects of Oatp1b2 on blood levels of BAs is consistent with the many changes in the pharmacokinetics of drugs and blood levels of endogenous molecules found in humans with low-activity OATP1B1 polymorphisms.22–24
Surprisingly, the increase in plasma concentrations of BAs in Oatp1b2-null mice is not reflected by decreases in hepatic concentrations of BAs. Interestingly, in livers of Oatp1b2-null mice, the mRNA expression of the basolateral efflux transporters, Mrp4 and Ost-α, is 40% and 50% lower, respectively, which might help to retain the BAs in the liver.
The biliary excretion of BAs by Oatp1b2-null mice is about the same as in WT mice, except for less αMCA and DCA in the null mice. In Oatp1b2-null mice, there are no changes in the mRNA expression of canalicular efflux transporters, which are responsible for maintaining bile flow and the biliary excretion of BAs. Because there are no decreases in the hepatic concentrations of αMCA and DCA, the lower rate of excretion of αMCA and DCA might be necessary for maintaining their hepatic concentrations. Therefore, the hepatic uptake of αMCA and DCA might be an important determining factor in the excretion of these BAs, especially for DCA, which originates from the bacterial activity in the intestine. Studies in rats indicate that rodent liver has high capacity of conversion of CDCA to βMCA, but not to αMCA.25,26 Thus, the selective decrease of biliary excretion of αMCA, but not βMCA, is likely due to their differences in hepatic synthesis in Oatp1b2-null mice.
For further characterization of the in vivo role of Oatp1b2 in BA transport, WT and Oatp1b2-null mice were injected with CA or T-CA (Fig. 4). The plasma concentration of CA is approximately 3 fold higher in Oatp1b2-null mice after the intravenous administration of CA (Fig. 4). In CA-injected mice, the Vd of the central compartment is approximately 50% smaller in Oatp1b2-null than in WT mice. The smaller Vd central results in a 55% lower hepatic clearance in Oatp1b2-null mice (Fig. 5). In contrast to CA, T-CA concentrations are similar in Oatp1b2-null and WT mice after intravenous administration of T-CA. This finding confirmed the key role of Oatp1b2 in the hepatic uptake of unconjugated BAs.
It can be assumed that the reabsorption of BAs by the ileum is not altered in the Oatp1b2-null mice, because there are no changes in either the BA levels in small intestine content (Supporting Information Fig. 3) or in the mRNA/protein expression of the BA transporters in the ileum (Asbt and Ostα/β, data not shown) in Oatp1b2-null mice compared with WT mice. Therefore, application of a pharmacokinetic equation after intravenous infusion () is consistent with the constant high concentrations of unconjugated BAs in Oatp1b2-null mice, where Css is the steady-state concentration, DR is the dose rate (in this case the intestinal absorption of BAs), and Cl is clearance. In Oatp1b2-null mice, the Css is higher than in WT mice, because of the decreased hepatic clearance of unconjugated BAs.
The homeostasis of hepatic BAs is regulated not only by transporters but also by the de novo biosynthesis of BAs from cholesterol. Because the disposition of unconjugated BAs is altered in Oatp1b2-null mice, the gene expression of BA synthetic enzymes was examined. Surprisingly, the mRNA expression of Cyp7a1, the rate-limiting enzyme of BA synthesis,27 is 70% lower in Oatp1b2-null mice (Fig. 7). The absence of Oatp1b2 does not influence other key enzymes either in the classical or in the alternative BA synthetic pathway (Fig. 7). The regulation of Cyp7a1 is complex. Cyp7a1 is a target gene of liver X receptor α (LXRα) in rodents.28 A high cholesterol diet increases bile acid synthesis in WT but not in LXRα-null mice, which results in high levels of cholesterol in livers of LXRα-null mice.29 Serum total cholesterol is higher in Oatp1b2-null than in WT mice.6 It is possible that cholesterol uptake into the Oatp1b2-null liver is compromised. The current study confirms 30% higher serum concentration of cholesterol, but did not detect any changes in hepatic cholesterol content in Oatp1b2-null mice (Supporting Information Fig. 4). Based on these findings, decreased LXR activation is probably not the reason for lower Cyp7a1 gene expression in Oatp1b2-null mice.
FXR is a major BA sensor that regulates BA homeostasis by way of Cyp7a1. In the liver, FXR inhibits Cyp7a1 through induction of SHP.27,30 In intestine, FXR induces Fgf15 in mice (FGF19 in humans) which activates the hepatic Fgfr4 to inhibit Cyp7a1 gene expression.27 In Oatp1b2-null mice, the mRNA expression of Cyp7a1 might be down-regulated because of the high expression of SHP (Fig. 7). However, it is not clear why there is an increase in SHP, because there is not an increase in BAs in livers of Oatp1b2-null mice (Fig. 2). Increased expression of Fgf15 in the intestines and Fgfr4 in the livers of Oatp1b2-null mice are likely responsible for the decreased expression of Cyp7a1 in the livers of Oatp1b2-null mice (Fig. 7). Fgf15 was 50% higher in 2-month-old Oatp1b2-null mice (but was not statistically significant) and four-fold higher in 1-year-old Oatp1b2-null mice (Supporting Information Fig. 5), which suggests that the Fgf15 pathway might be responsible for the decreased expression of Cyp7a1.
The reason why the Fgf15/Fgfr4 pathway is increased in Oatp1b2-null mice is not obvious, because the biliary excretion of BAs in the two genotypes is similar, thus the concentrations of BAs in the ileal contents are also similar (Supporting Information Fig. 3). The ileum might be responding to higher concentrations of unconjugated BAs in the blood.
In conclusion, the current study indicates that Oatp1b2 has an important role in hepatic uptake of unconjugated BAs. The hepatic clearance of CA is 55% lower in Oatp1b2-null mice. Surprisingly, Oatp1b2 appears to play an indirect role in the hepatic expression of Cyp7a1.
Acknowledgment
We thank Xiaohong Lei for help with the animal experiments, Dr. Rachel Chennault for technical help with bead-plex array, and the postdoctoral fellows and graduate students of Dr. Klaassen’s laboratory for critical review of the manuscript.
Supported by National Institutes of Health Grants ES09649, ES09716, ES013714, and RR021940.
Abbreviations
- BA
bile acid
- CA
cholic acid
- CDCA
chenodeoxycholic acid
- DCA
deoxycholic acid
- Fgf15
fibroblast growth factor 15
- Fgfr4
fibroblast growth factor receptor 4
- FXR
farnesoid X receptor
- G
glycine
- HDCA
hyodeoxycholic acid
- LCA
lithocholic acid
- LXRα
liver X receptor α
- MCA
muricholic acid
- MDCA
murideoxycholic acid
- mRNA
messenger RNA
- Mrp
multidrug resistance–associated protein
- Ntcp
sodium taurocholate cotransporting polypeptide
- Oatp
organic anion–transporting polypeptide
- SHP
small heterodimer partner
- T
taurine
- UDCA
ursodeoxycholic acid
- WT
wild-type
Footnotes
This work was presented in part as a lecture at the Liver Meeting (November 1, 2009, Boston MA).
Potential conflict of interest: Nothing to report.
Additional Supporting Information may be found in the online version of this article.
References
- 1.Millburn P, Smith RL, Williams RT. Biliary excretion of foreign compounds. Biphenyl, stilboestrol and phenolphthalein in the rat: molecular weight, polarity and metabolism as factors in biliary excretion. Biochem J. 1967;105:1275–1281. doi: 10.1042/bj1051275. [DOI] [PMC free article] [PubMed] [Google Scholar]
- 2.Strange RC. Hepatic bile flow. Physiol Rev. 1984;64:1055–1102. doi: 10.1152/physrev.1984.64.4.1055. [DOI] [PubMed] [Google Scholar]
- 3.Turley SD, Dietschy JM. The intestinal absorption of biliary and dietary cholesterol as a drug target for lowering the plasma cholesterol level. Prev Cardiol. 2003;6:29–33. 64. doi: 10.1111/j.1520-037x.2003.01691.x. [DOI] [PubMed] [Google Scholar]
- 4.Lowe ME. The triglyceride lipases of the pancreas. J Lipid Res. 2002;43:2007–2016. doi: 10.1194/jlr.r200012-jlr200. [DOI] [PubMed] [Google Scholar]
- 5.Cheng X, Maher J, Chen C, Klaassen CD. Tissue distribution and ontogeny of mouse organic anion transporting polypeptides (Oatps) Drug Metab Dispos. 2005;33:1062–1073. doi: 10.1124/dmd.105.003640. [DOI] [PubMed] [Google Scholar]
- 6.Lu H, Choudhuri S, Ogura K, Csanaky IL, Lei X, Cheng X, et al. Characterization of organic anion transporting polypeptide 1b2-null mice: essential role in hepatic uptake/toxicity of phalloidin and microcystin-LR. Toxicol Sci. 2008;103:35–45. doi: 10.1093/toxsci/kfn038. [DOI] [PMC free article] [PubMed] [Google Scholar]
- 7.Cattori V, Hagenbuch B, Hagenbuch N, Stieger B, Ha R, Winterhalter KE, et al. Identification of organic anion transporting polypeptide 4 (Oatp4) as a major full-length isoform of the liver-specific transporter-1 (rlst-1) in rat liver. FEBS Lett. 2000;474:242–245. doi: 10.1016/s0014-5793(00)01596-9. [DOI] [PubMed] [Google Scholar]
- 8.Leazer TM, Klaassen CD. The presence of xenobiotic transporters in rat placenta. Drug Metab Dispos. 2003;31:153–167. doi: 10.1124/dmd.31.2.153. [DOI] [PubMed] [Google Scholar]
- 9.Cui YJ, Aleksunes LM, Tanaka Y, Goedken MJ, Klaassen CD. Compensatory induction of liver efflux transporters in response to ANIT-induced liver injury is impaired in FXR-null mice. Toxicol Sci. 2009;110:47–60. doi: 10.1093/toxsci/kfp094. [DOI] [PMC free article] [PubMed] [Google Scholar]
- 10.Alnouti Y, Csanaky IL, Klaassen CD. Quantitative-profiling of bile acids and their conjugates in mouse liver, bile, plasma, and urine using LC-MS/MS. J Chromatogr B Analyt Technol Biomed Life Sci. 2008;873:209–217. doi: 10.1016/j.jchromb.2008.08.018. [DOI] [PMC free article] [PubMed] [Google Scholar]
- 11.Zhang Y, Klaassen CD. Effects of feeding bile acids and a bile acid sequestrant on hepatic bile acid composition in mice. J Lipid Res. 2010 doi: 10.1194/jlr.M007641. [DOI] [PMC free article] [PubMed] [Google Scholar]
- 12.Hylemon PB, Zhou H, Pandak WM, Ren S, Gil G, Dent P. Bile acids as regulatory molecules. J Lipid Res. 2009;50:1509–1520. doi: 10.1194/jlr.R900007-JLR200. [DOI] [PMC free article] [PubMed] [Google Scholar]
- 13.Hofmann AF. The continuing importance of bile acids in liver and intestinal disease. Arch Intern Med. 1999;159:2647–2658. doi: 10.1001/archinte.159.22.2647. [DOI] [PubMed] [Google Scholar]
- 14.Craddock AL, Love MW, Daniel RW, Kirby LC, Walters HC, Wong MH, et al. Expression and transport properties of the human ileal and renal sodium-dependent bile acid transporter. Am J Physiol. 1998;274:G157–G169. doi: 10.1152/ajpgi.1998.274.1.G157. [DOI] [PubMed] [Google Scholar]
- 15.Hagenbuch B, Dawson P. The sodium bile salt cotransport family SLC10. Pflugers Arch. 2004;447:566–570. doi: 10.1007/s00424-003-1130-z. [DOI] [PubMed] [Google Scholar]
- 16.Meier PJ, Stieger B. Bile salt transporters. Annu Rev Physiol. 2002;64:635–661. doi: 10.1146/annurev.physiol.64.082201.100300. [DOI] [PubMed] [Google Scholar]
- 17.Alrefai WA, Gill RK. Bile acid transporters: structure, function, regulation and pathophysiological implications. Pharm Res. 2007;24:1803–1823. doi: 10.1007/s11095-007-9289-1. [DOI] [PubMed] [Google Scholar]
- 18.Hofmann M, Zgouras D, Samaras P, Schumann C, Henzel K, Zimmer G, et al. Small and large unilamellar vesicle membranes as model system for bile acid diffusion in hepatocytes. Arch Biochem Biophys. 1999;368:198–206. doi: 10.1006/abbi.1999.1295. [DOI] [PubMed] [Google Scholar]
- 19.Aldini R, Roda A, Lenzi PL, Ussia G, Vaccari MC, Mazzella G, et al. Bile acid active and passive ileal transport in the rabbit: effect of luminal stirring. Eur J Clin Invest. 1992;22:744–750. doi: 10.1111/j.1365-2362.1992.tb01439.x. [DOI] [PubMed] [Google Scholar]
- 20.Zaher H, zu Schwabedissen HE, Tirona RG, Cox ML, Obert LA, Agrawal N, et al. Targeted disruption of murine organic anion-transporting polypeptide 1b2 (Oatp1b2/Slco1b2) significantly alters disposition of prototypical drug substrates pravastatin and rifampin. Mol Pharmacol. 2008;74:320–329. doi: 10.1124/mol.108.046458. [DOI] [PMC free article] [PubMed] [Google Scholar]
- 21.Xiang X, Han Y, Neuvonen M, Pasanen MK, Kalliokoski A, Backman JT, et al. Effect of SLCO1B1 polymorphism on the plasma concentrations of bile acids and bile acid synthesis marker in humans. Pharmacogenet Genomics. 2009;19:447–457. doi: 10.1097/FPC.0b013e32832bcf7b. [DOI] [PubMed] [Google Scholar]
- 22.Hartkoorn RC, Kwan WS, Shallcross V, Chaikan A, Liptrott N, Egan D, et al. HIV protease inhibitors are substrates for OATP1A2, OATP1B1 and OATP1B3 and lopinavir plasma concentrations are influenced by SLCO1B1 polymorphisms. Pharmacogenet Genomics. 2010;20:112–120. doi: 10.1097/FPC.0b013e328335b02d. [DOI] [PMC free article] [PubMed] [Google Scholar]
- 23.Romaine SP, Bailey KM, Hall AS, Balmforth AJ. The influence of SLCO1B1 (OATP1B1) gene polymorphisms on response to statin therapy. Pharmacogenomics J. 2010;10:1–11. doi: 10.1038/tpj.2009.54. [DOI] [PubMed] [Google Scholar]
- 24.Ieiri I, Higuchi S, Sugiyama Y. Genetic polymorphisms of uptake (OATP1B1, 1B3) and efflux (MRP2, BCRP) transporters: implications for inter-individual differences in the pharmacokinetics and pharmacodynamics of statins and other clinically relevant drugs. Expert Opin Drug Metab Toxicol. 2009;5:703–729. doi: 10.1517/17425250902976854. [DOI] [PubMed] [Google Scholar]
- 25.Yousef IM, Fisher MM. Bile acid metabolism in mammals: IX. Conversion of chenodeoxycholic acid to cholic acid by isolated perfused rat liver. Lipids. 1975;10:571–573. doi: 10.1007/BF02532365. [DOI] [PubMed] [Google Scholar]
- 26.Yousef IM, Magnusson R, Price VM, Fisher MM. Bile acid metabolism in mammals. V. Studies on the sex difference in the response of the isolated perfused rat liver to chenodeoxycholic acid. Can J Physiol Pharmacol. 1973;51:418–423. doi: 10.1139/y73-062. [DOI] [PubMed] [Google Scholar]
- 27.Chiang JY. Bile acids: regulation of synthesis. J Lipid Res. 2009;50:1955–1966. doi: 10.1194/jlr.R900010-JLR200. [DOI] [PMC free article] [PubMed] [Google Scholar]
- 28.Janowski BA, Willy PJ, Devi TR, Falck JR, Mangelsdorf DJ. An oxysterol signalling pathway mediated by the nuclear receptor LXR alpha. Nature. 1996;383:728–731. doi: 10.1038/383728a0. [DOI] [PubMed] [Google Scholar]
- 29.Peet DJ, Turley SD, Ma W, Janowski BA, Lobaccaro JM, Hammer RE, et al. Cholesterol and bile acid metabolism are impaired in mice lacking the nuclear oxysterol receptor LXR alpha. Cell. 1998;93:693–704. doi: 10.1016/s0092-8674(00)81432-4. [DOI] [PubMed] [Google Scholar]
- 30.Russell DW. The enzymes, regulation, and genetics of bile acid synthesis. Annu Rev Biochem. 2003;72:137–174. doi: 10.1146/annurev.biochem.72.121801.161712. [DOI] [PubMed] [Google Scholar]


