

Abstract
DNA methylation, histone modifications, and nucleosomal occupancy collaborate to cause silencing of tumor-related genes in cancer. The development of drugs that target these processes is therefore important for cancer therapy. Inhibitors of DNA methylation and histone deacetylation have been approved by the Food and Drug Administration for treatment of hematologic malignancies. However, drugs that target other mechanisms still need to be developed. Recently, 3-deazaneplanocin A (DZNep) was reported to selectively inhibit trimethylation of lysine 27 on histone H3 (H3K27me3) and lysine 20 on histone H4 (H4K20me3) as well as reactivate silenced genes in cancer cells. This finding opens the door to the pharmacologic inhibition of histone methylation. We therefore wanted to further study the mechanism of action of DZNep in cancer cells. Western blot analysis shows that DZNep globally inhibits histone methylation and is not selective. Two other drugs, sinefungin and adenosine dialdehyde, have similar effects as DZNep on H3K27me3. Intriguingly, chromatin immunoprecipitation of various histone modifications and microarray analysis show that DZNep acts through a different pathway than 5-aza-2′-deoxycytidine, a DNA methyltransferase inhibitor. These observations give us interesting insight into how chromatin structure affects gene expression. We also determined the kinetics of gene activation to understand if the induced changes were somatically heritable. We found that upon removal of DZNep, gene expression is reduced to its original state. This suggests that there is a homeostatic mechanism that returns the histone modifications to their “ground state” after DZNep treatment. Our data show the strong need for further development of histone methylation inhibitors
Keywords: Histone methylation, EZH2, epigenetics, Polycomb, DZNep
INTRODUCTION
Chromatin modifications regulate genetic expression patterns and are necessary for the proper development and function of mammals. DNA methylation and covalent and noncovalent modifications of histones are all mechanisms that work together to control gene expression and stabilize the genome. Errors in any of these processes can contribute to tumorigenesis and result in cancer (1).
New therapeutic approaches have been developed with the goal of reversing the epigenetic marks that lead to gene silencing (2). Three such drugs have already been approved by the Food and Drug Administration for the treatment of cancer. Inhibitors of DNA methylation 5-aza-2′-deoxycytidine (5-Aza-CdR) and 5-azacytidine (5-Aza-CR) have been approved for the treatment of myelodysplastic syndromes. In addition, suberoylanilide hydroxamic acid, a general deacetylase inhibitor, has been approved for the use in treatment of cutaneous T-cell lymphoma. These three drugs have been shown to act on the same genes and to have synergistic effects when used together (3, 4).
Two separate epigenetic pathways have been shown to be dysregulated in cancer. The first is the well-known silencing of genes by DNA methylation (5) and the second is the silencing of genes mediated by the Polycomb repressor complex 2, which is often independent of DNA methylation (6, 7). The Polycomb repressor complex 2 plays an important role during development and the methyltransferase component, enhancer of zeste homologue 2 (EZH2), is responsible for the trimethylation of histone H3K27 (H3K27me3), which is a repressive chromatin mark (8). Overexpression of EZH2 has been associated with a number of cancers, including melanoma, lymphoma, and breast and prostate cancers (9–12). Because the Polycomb system and DNA methylation can work through different pathways, a combination treatment using an inhibitor to the Polycomb repressor complex 2 as well as an inhibitor of DNA methylation could target both sets of genes silenced by the two mechanisms. This would allow for a simultaneous reactivation of genes by epigenetic therapy.
Recently, 3-deazaneplanocin A (DZNep) was discovered to selectively inhibit H3K27me3 and H4K20me3 (trimethylation of histone H4 at lysine 20) as well as to induce apoptosis in cancer cells (13). This makes DZNep a possible candidate as an epigenetic therapeutic for the treatment of cancer. However, DZNep is a known S-adenosylhomocysteine (AdoHcy) hydrolase inhibitor, which leads to the indirect inhibition of S-adenosyl-methionine (AdoMet)–dependent reactions, including those carried out by many methyltransferases (Fig. 1B; refs. 14, 15). Therefore, it is surprising that the effects of DZNep on cancer cells were found to be relatively specific to EZH2.
Figure 1. Methyltransferase inhibitors.

A) Chemical structures of DZNep (3-deazaneplanocin), Adox (adenosine-dialdehyde), Sinefungin, and 5-Aza-CdR (5-Aza-2′-deoxycytidine). The enzyme(s) inhibited by each chemical is indicated below the structures in parenthesis. B) Schematic of AdoMet (S-adenosylmethionine) metabolism and its inhibition. AdoMet is the methyl donor for methylation reactions. AdoMet is metabolized to AdoHcy (adenosylhomocysteine) by methyltransferases. AdoHcy is then converted into adenosine and homocysteine by AdoHcy hydrolase. DZNep and Adox inhibit AdoHcy hydrolase causing an increase in AdoHcy levels. AdoHcy in turn inhibits the methyltransferases. Sinefungin directly inhibits methyltransferases.
To better understand how DZNep affects gene expression and chromatin structure and to test its potential as an epigenetic therapeutic, we further explored the mechanism by which DZNep inhibits the methylation of H3K27 and determined whether it affects other histone methylation marks. In addition, we compared the mechanisms by which DZNep and 5-Aza-CdR affect gene expression. We found that DZNep affects multiple histone methyltransferases and can epigenetically reactivate a different cohort of genes than those by 5-Aza-CdR. In addition, we have used DZNep to study how chromatin structure affects gene expression using the KRT7 gene, which is part of the keratin gene family. The KRT7 gene codes for a subunit of the type II cytokeratins that aid in cytoplasmic structure and protein binding. We also studied if the changes induced by DZNep were somatically heritable. Taken together, our data give useful insight into how chromatin structure affects gene expression and support the use of methyltransferase inhibitors for epigenetic therapy.
MATERIALS AND METHODS
Cells and drug treatments
MCF7 and T24 were purchased from the American Type Culture Collection (ATCC) and cultured according to their recommendations. The immortalized keratinocyte HaCaT cell line was obtained as described previously (16) and was grown in modified MEM supplemented with 10% FCS. For drug treatments, cells were seeded the day before the drugs were added. Cells were seeded at 700,000 cells per 10 cm dish. Cells were then treated with 1–5 μM DZNep (17), 10–100 μM Adox (Sigma, St. Louis, MO), 50–150 μM Sinefungin (Sigma), and 1–3 μM 5-Aza-CdR (Sigma) for 72 h.
Western Blots
Cells were harvested by treatment with trypsin and resuspended in RIPA buffer. The resuspended cells were lysed by 2 cycles of sonication for 15 sec. Equal amounts of protein (20–50 μg) were separated on SDS–polyacrylamide gels and transferred to PVDF membranes. The blots were probed with antibodies against EZH2, SUZ12, DNMT1, PCNA, histone H3 and the following histone modifications: H3K27me3 (Upstate, Waltham, MA), H3K9me2, H3K79me3, H4K20me3, H3K9me3, H3K4me3, H3K9me1, H3K36me3, H3R2me2.
Rapid amplification of cDNA ends (5′-RACE)
Total RNA was extracted using TRIzol (Invitrogen, Carlsbad, CA) from MCF7 cells treated with either 5 μM DZNep or 1 μM 5-Aza-CdR for 72 h. The 5′ ends of mRNA were determined using the RLM-RACE Kit (Ambion, Austin, TX) according to the manufacturer’s instructions. The 5′ to 3′ sequences of gene-specific primers were: KRT7 P1 outer: 5′-TGCAGTGCCTCAAGCTGA-3′; KRT7 P1 inner: 5′-GGAGGCAAACTTGTTGTTGAGGGT-3′; KRT7 P2 outer: 5′-ATTGAGGGTCCTGAGGAAGTTGAT-3′; KRT7 P2 inner: 5′-CTTCAGCACCACAAACTCATTCTCAG-3′. Universal outer and inner primers were provided with the kit. The 5′-RACE reaction products were cloned using the TOPO-TA cloning kit (Invitrogen) and were sequenced.
Quantitative real-time PCR
Total RNA was isolated from cell lines using Trizol (Invitrogen) or the RNAeasy Mini Kit (Qiagen, Valencia, CA). Reverse transcription using MMLV-RT (Invitrogen) was done according to the manufacturer’s instructions. Quantitative real-time PCR was performed using TaqMan probes (Applied Biosystems, Foster City, CA). Expression of KRT7 was normalized to GAPDH. Primers and probe for KRT7 P1: sense primer, 5′-AGCAGATCAAGACCCTCAA-3′, and antisense primer 5′-GGCCTCAAAGATGTCTGG-3′; KRT7 P2: sense primer, 5′-GGGAGTCCAGGGAAGGAGTA-3′, and antisense primer 5′-AGGTCAAGAGGGTGCACAGA-3′, probe, 5′-CTGCTCAGGGAGTTCCGA-3′. PCR conditions were as follows: 95°C for 10 minutes, followed by 40 cycles of 95°C for 15 seconds and 60°C for 1 minute.
Quantitation of DNA methylation by pyrosequencing
Pyrosequencing analysis was performed on bisulfite-converted DNA, prepared as described previously (18, 19). Briefly, the promoter regions of interest were first amplified by PCR using biotinylated anti-sense primers. Next, the 10μl of the PCR product was used for individual sequencing. Strepavidin-Sepharose beads (Amersham Biosciences, Piscataway, NJ) and a Vacuum Prep Tool (Biotage AB) were used to purify the single-stranded biotinylated PCR products according to manufacturer’s recommendation. The primers used for amplification of promoter regions were: KRT7 P1, sense 5′-TTGTTTGGATTGAAAGTTTGGGTTT-3′, antisense 5′-Biotin-ACTAAACTTCCACAAATAAAA-3′; KRT7 P2 sense 5′-GTAGGGAAGGTGTGGGGTTA-3′; antisense 5′-Biotin-CCATACCCTCAAAATTACACTCCCT-3′.
The appropriate sequencing primer was annealed to the purified PCR product. Pyrosequencing reactions were performed in a 96-well plate format using the PSQ 96HS system (Biotage). The sequencing primers were KRT7 P1 S1:5′-TTGTTTG GATTGAAAGTTTGGGTTT-3′; and KRT7 P2, S1:5′-GTTATTATTTAGTTTTTGTTGTTAGGATTAA-3′. Raw data were analyzed using the allele quantitation algorithm using the provided software.
Chromatin Immunoprecipitation
ChIP analyses were done as described previously (20) except that 25 μg of DNA was used for each chromatin immunoprecipitation. Antibodies used are as follows: anti-histone H3 (Abcam, Cambridge, MA), anti-histone H3K27me3 (Upstate), anti-acetyl histone H3 (Abcam), anti-histone H3K9me2 (Abcam), anti-histone H3K4me3 (Abcam), and anti-IgG (Upstate) as a negative control. Real time qPCR was used to quantify each histone mark found within the KRT7 P1 and KRT7 P2 region. Sequences for primer and probes are as follows: KRT7 P1: sense primer, 5′-AAGCCTTCCCTCACTGAGTCC-3′ and antisense primer 5′-TTCAGTCCAAGCAGGGATGG-3′, probe, 5′-ATGGGCTGGAACTGCGGTCCC-3; KRT7 P2: sense primer, 5′-GTACAGGGAGGGTCCCTGTGT-3′ and antisense primer 5′-AGCCAGGTCAAGAGGGTGC-3′, probe, 5′-CAGCTGCTCAGGGAGTTCCGATCTG-3′. PCR conditions were as follows: 95°C for 10 minutes, followed by 40 cycles of 95°C for 15 seconds and 60°C for 1 minute.
Microarray Analysis
Cells were treated with either 5 μM DZNep or 1 μM 5-Aza-CdR for 72 h. Total RNA was isolated from MCF7 cells with the RNAeasy Mini Kit. To look at global gene expression, RNA was hybridized to the human 6 v2 Expression BeadChip (Illumina, San Diego, CA) and data analysis was performed using Illumina microbead studio software.
RESULTS
DZNep inhibits global histone methylation through an indirect mechanism
To decipher the mechanism by which DZNep inhibits EZH2, we compared its effects on EZH2 to that of a DNA methylation inhibitor (5-Aza-CdR), another AdoHcy hydrolase inhibitor (adenosine dialdehyde), and a global methyltransferase inhibitor (sinefungin; Fig. 1A and B; refs. 21, 22). The MCF7 breast cancer and T24 bladder cancer cell lines were treated for 72 hours with each compound and harvested for Western blot analysis (Fig. 2A). We found that 5-Aza-CdR had no effect on EZH2 protein levels or on the global amount of H3K27me3 in either cell line. Sinefungin, a global and direct inhibitor of methyltransferases, caused a decrease in EZH2 and a decrease in H3K27me3 levels in T24 cells. However, the same decrease in EZH2 protein levels was not observed in MCF7 cells upon treatment with sinefungin. The differences observed between the two cell lines may have been due to the differences in the metabolism of sinefungin or in its cellular uptake. Next, we found that another AdoHcy hydrolase inhibitor, adenosine dialdehyde, caused a decrease in EZH2 protein levels and a global decrease in H3K27me3 in both cell types, similar to what has been shown with DZNep (13). This implied that the degradation of EZH2 and subsequently the decrease in H3K27me3 levels were not specific to DZNep and that DZNep was probably not directly inhibiting EZH2. Other studies have shown that it is AdoHcy that inhibits methyltransferases upon treatment of cells with adenosine dialdehyde (21). Therefore, the inhibition of EZH2 observed in cells treated with DZNep was most likely due to an increase in AdoHcy levels, which then directly inhibited EZH2. Taken together, these data imply that DZNep can act indirectly to inhibit EZH2 and subsequently cause a decrease in H3K27me3, similar to other compounds.
Figure 2. The effects of methyltransferase inhibitors on global histone methylation.

A) MCF7 breast cancer cells and T24 bladder cancer cells were treated with either 1 μM 5-Aza-CdR, 5 or 10 μM DZNep, 150 μM Sinefungin or 50 μM Adox for 72 h. Cells were harvested and DNMT1, EZH2 and H3K27me3 levels were measured by western blot analysis. B) MCF-7 cells were treated with either 1 μM or 5 μM DZNep for 72 h. Cells were harvested and global histone methylation levels were determined by western blot analysis.
Next, we investigated whether the effect of DZNep was selective for H3K27me3 or if it also affected other histone methylation marks. To keep our study consistent with the previous study, MCF7 cells were treated for 72 hours with either 1 or 5 μmol/L DZNep (13). Protein extracts were analyzed by Western blot analysis for EZH2 and several other histone marks (Fig. 2B; Supplementary Fig. S1). We found that 1 μmol/L DZNep had no effect on EZH2 levels whereas 5 μmol/L DZNep caused a slight reduction. We discovered that in addition to H3K27me3 and H4K20me3, DZNep also caused a global decrease in most histone modifications that were examined, except for H3K9me3 and H3K36me3. It should be noted that these experiments were repeated three times biologically and although the degree of inhibition varied from experiment to experiment the trend remained the same. These data showed that DZNep acts as a global inhibitor of histone methylation and is not selective to H3K27me3 and H4K20me3 as was previously reported (13).
Although we have clearly shown that DZNep acts globally and can inhibit both activating and repressive histone marks, DZNep may still be clinically useful. It is well known that the histone deacetylase (HDAC) inhibitors are also global inhibitors that affect the deacetylation of other proteins as well as histones, but are still successfully used in the treatment of cancer (23, 24). We therefore decided that further investigation of the potential of DZNep as an epigenetic therapeutic was warranted, in addition to using DZNep to further elucidate how chromatin structure affects gene expression.
Two distinct mechanisms are involved in the silencing of a single gene
It was previously suggested that DZNep, but not 5-Aza-CdR, could cause reexpression of genes silenced by DNA methylation in the absence of DNA demethylation (13). Because it is atypical for a transcript initiated from a methylated CpG island in its promoter to be reexpressed without demethylation of the CpG sites, we decided to further explore this concept. We focused our studies on KRT7 (NM_005556), which is one of the genes shown to contain a methylated CpG island in its promoter yet was seemingly activated by DZNep without DNA demethylation (13).
We first did a 5′-RACE on mRNA isolated from MCF7 cells that had been treated with either 5-Aza-CdR or DZNep for 72 hours and identified two alternate transcripts of KRT7 (Fig. 3A). The downstream transcript, which was identified in cells treated with DZNep, had not been previously described. We therefore designed primers that were specific for each transcript and we found that 5-Aza-CdR could induce the expression of the transcript generated from the promoter containing the methylated CpG island (P1; Fig. 3B). In contrast, DZNep was able only to induce the expression of the second transcript generated from a downstream promoter located in a CpG-poor region (P2; Fig. 3B). Thus, the increase in expression upon DZNep treatment that was previously shown to be from a methylated promoter (P1) likely reflects this novel transcript (P2).
Figure 3. The effects of 5-Aza-CdR and DZNep on KRT7 expression.
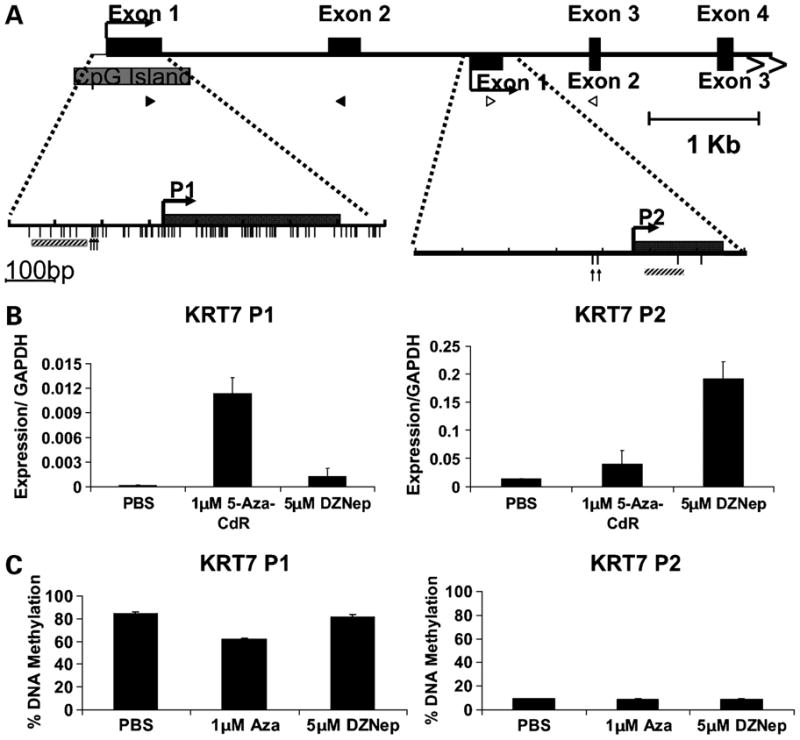
A) 5′ RACE was performed on RNA purified from MCF7 cells treated with either 1 μM 5-Aza-CdR or 5 μM DZNep for 72h. The 5′ RACE results found that 5-Aza-CdR and DZNep turned on different transcripts as depicted in the figure. P1, promoter 1; P2, promoter 2; black boxes, exons; gray box, CpG Island; vertical lines, CpG sites; bent arrows, transcriptional start sites determined by 5′ RACE; vertical arrows, CpG sites analyzed by pyrosequencing; gray hatched squares, ChIP PCR products B) Specific primers were designed toward each transcript. Primer sites are indicated in part A. Black triangles represent the binding sites for the primers specific to the promoter 1 (P1) transcript whereas the white triangles indicate the binding sites for the primers specific to the promoter 2 (P2) transcript. Real time qPCR was used to verify the activation of the different promoters by 5-Aza-CdR and DZNep. Error bars represent the range from two biological repeats. C) MCF7 cells were treated with either 1 μM 5-Aza-CdR or 5 μM DZNep for 72 h. Pyrosequencing was used to analyze the affects within the KRT7 P1 promoter or the KRT7 P2 promoter. Error bars represent the range from two (P1) or three (P2) analyzed sites.
We sought to determine if the second promoter we found occurs naturally or if we were activating a cryptic promoter with DZNep. We found that the KRT7 P2 transcript occurs in the immortalized keratinocyte HaCaT cell line and other cancer cell lines (Supplementary Fig. S2). This suggests that KRT7 P2 becomes silenced in some epithelial cancers, but can be reexpressed upon DZNep treatment.
These results show that there are two mechanisms for silencing the KRT7 gene and that DZNep did not turn on transcription from this methylated promoter. Our study also highlights the importance of locating the exact start site of the transcript being studied when analyzing epigenetic modifications.
We then looked at the effects of DZNep on DNA methylation. Pyrosequencing showed that the treatment of MCF7 cells with 5 μmol/L DZNep did not affect the levels of DNA methylation within either the KRT7 P1 or P2 promoters (Fig. 3C), confirming previous studies (13). Treatment of MCF7 cells with 10 μmol/L DZNep for 72 hours caused a slight reduction (6%) in CpG methylation, but we found that this treatment was not enough to cause expression of the P1 transcript (data not shown). However, 5-Aza-CdR caused a 27% decrease in CpG methylation in the KRT7 P1 promoter (Fig. 3C), which is consistent with its increased expression after treatment with 5-Aza-CdR. This confirms, by an alternative methodology, that CpG methylation is the primary mechanism through which expression of the P1 transcript, but not the P2 transcript, is controlled.
Decrease in H3K27me3 is correlated with an increase in the expression of the KRT7 P2 transcript
We studied the local changes in histone modifications after treatment of MCF7 cells with either 5-Aza-CdR or DZNep (Fig. 4) using ChIP. We found that both promoters contained H3K27me3 methylation. This is somewhat surprising because it has been shown that H3K27me3 most often exists independent of DNA methylation. However, there are exceptions to the rule, which we confirm here with the KRT7 P1 promoter (6), whereas treatment with 5-Aza-CdR did not affect the H3K27me3 levels at either the P1 or P2 promoter. However, treatment with DZNep resulted in an 50% decrease in H3K27me3 at both promoters. This result suggests that a decrease in H3K27me3 levels occurs as the KRT7 P2 promoter is activated. Although DZNep also affected H3K27me3 levels at KRT7 P1, this decrease alone did not cause activation of the P1 transcript, suggesting that the DNA methylation must be removed for the P1 transcript to be expressed.
Figure 4. KRT7 P1 and P2 ChIP analyses.

ChIP analysis of the KRT7 P1 and P2 locus after treatment of MCF7 cells with either 1μM 5-Aza-CdR or 5μM DZNep for 72h. ChIP analysis for histone H3K27me3, H3K4me3, and acetyl H3. IP’s are normalized to H3 to account for any variation in nucleosome positioning due to the drug treatments. Error bars represent the range between duplicate ChIPs. Figure is a representative of two biological repeats. Each repeat gave similar results.
Additionally, we found that the treatment of MCF7 cells with 5-Aza-CdR generated an increase in H3K4me3 in the P1 promoter whereas treatment with DZNep resulted in no change in the relative enrichment of this mark. This suggests that although H3K4me3 may contribute to the expression of KRT7 P1, the KRT7 P2 promoter does not require H3K4me3 to be expressed. No change was observed in the levels of acetylated H3; however, this mark was already present in the P2 promoter.
DZNep and 5-Aza-CdR activate different sets of genes
Next, we did a comparison between genes that can be activated by 5-Aza-CdR and genes that can be activated by DZNep. RNA extracted from MCF7 cells treated with either 1 μmol/L 5-Aza-CdR or 5 μmol/L DZNep for 72 hours was subjected to microarray analysis (Supplementary Fig. S3A and B). These data have been deposited in the Gene Expression Omnibus of the National Center for Biotechnology Information (NCBI; ref. 25) and are accessible through GEO Series accession number GSE15200. Three genes found to be up-regulated by DZNep were validated by quantitative PCR (Fig. 3B and Supplementary Fig. S4). Scatter plots show that treatment with DZNep resulted in the activation of 154 genes, whereas 5-Aza-CdR resulted in the activation of only 68 genes by >2-fold (Fig. 5A). The Venn diagram (Fig. 5B) shows that few genes were commonly activated by both drugs. Only seven genes were up-regulated by both drugs in MCF7 cells. Further analysis is necessary to determine whether some of the commonly regulated genes are generated as different transcripts as we showed for KRT7. In addition, DZNep also caused a reduction in the expression of many genes. This may be the result of the ability of DZNep to reduce H3K4me3 levels (Fig. 4).
Figure 5. Illumina expression arrays.

A) Scatter plots showing genes that are upregulate or downregulated more than two-fold upon treatment of MCF7 cells treated with either 1 μM 5-Aza-CdR (top) or 5 μM DZNep (bottom) for 72 h when compared to untreated MCF7 cells. Green dots indicate upregulated genes whereas red dot indicate down regulated genes. B) Venn diagram showing the overlap of genes upregulated in MCF7 cells treated with 5-Aza-CdR or DZNep. MCF7 cells were treated with either 1 μM 5-Aza-CdR or 5 μM DZNep for 72 h. Gene expression was analyzed using Illumina human 6 microbead array. C) EASE analysis showing the categories of genes turned on by DZNep or 5-Aza-CdR. The Bonferroni score of less than 1 was determined to be significant.
To determine if 5-Aza-CdR and DZNep turned on genes involved in different cellular processes, an EASE analysis was done. We found that 5-Aza-CdR turned on genes mostly involved in defense responses to parasites and wounding, whereas DZNep activated genes involved in organogenesis and epidermal and ectoderm development (Fig. 5C). Because MCF7 is an epithelial cancer cell line, it is not surprising that DZNep turns on epidermal and ectoderm genes that have been silenced in cancer. It will be interesting to see whether DZNep treatment induces expression of genes that are specific to blood cells in lymphomas or causes genes that are specific to muscle development to become activated in muscle cancer cells.
Kinetics of mRNA induction by DZNep
We next did a time course to determine the kinetics of gene activation and heritability of gene expression after 24-hour treatment with 10 μmol/L DZNep or 1 μmol/L 5-Aza-CdR. We chose 24-hour treatments instead of 72 hours as we had done in the initial experiments so that our data would be comparable with previous heritability studies using 5-Aza-CdR (26). Because we were only doing a 24-hour treatment, we also used 10 μmol/L DZNep instead of 5 μmol/L to try and increase the effects of the drug during the shorter incubation period (Fig. 6A). We found as before (Fig. 3A) that although DZNep did not activate the KRT7 P1 transcript, the P2 transcript was robustly expressed on day 1 and that expression from the KRT7 P2 was lost a further day after drug removal. When the cells were treated with 5-Aza-CdR, the KRT7 P1 transcript was gradually turned on, peaking on day 7 and then gradually turned off again. Western blot analysis showed that EZH2 protein levels were decreased on day 1 but increased to normal levels by day 2 (Fig. 6B), consistent with the expression data.
Figure 6. Comparison of the heritability of gene expression upon treatment of MCF7 cells with either 5-Aza-CdR or DZNep.

MCF7 cells were treated with either 1 μM 5-Aza-CdR or 10 μM DZNep for 24 h. Cells were harvested for RNA extraction or for cellular extracts every day for 14 days beginning 24 hr after drug removal (day 1). A) Real time qPCR showing the heritability of KRT7 P1 transcript and KRT7 P2 transcript following drug treatments. B) Western blot showing how the levels of EZH2 change upon drug removal. Bots were analyzed using Fluor-S Multi-ImagerMAX instrument (Bio-Rad, Hercules, CA). C) Genes that were upregulated more than 2-fold by either drug treatment were determined by Illumina microarray. The graph shows the number of genes upregulated on day 1 and day 7 by the indicated drug treatments.
We then examined the global changes in gene expression by microarray analysis on days 1 and 7 after treatment of MCF7 cells with either DZNep or 5-Aza-CdR (Fig. 6C) and found that no heritable changes in expression were induced by DZNep. This suggests that a homeostatic mechanism returns the histone modifications to their pretreatment levels or “ground state” after DZNep treatment. In contrast, most of the genes turned on by 5-Aza-CdR were observed at day 7, whereas only a handful of genes were induced 2-fold or more by day 1. These data have been deposited in the Gene Expression Omnibus of NCBI (25) and are accessible through GEO Series accession number GSE1373.
DISCUSSION
DZNep was previously reported to be a selective inhibitor of H3K27 and H4K20 trimethylation (13). However, that study focused only on the methylation of H3K27, H3K9, and H4K20, whereas we have expanded the study to include other histone methylation modifications. Our extended study shows that DZNep is not a selective inhibitor of H3K27me3 and H4K20me3 as previously reported (13). Instead DZNep was found to globally inhibit both repressive and active histone methylation marks. In addition, we tested other AdoHcy hydrolase and global methyltransferase inhibitors and found that EZH2 inhibition is not specific to DZNep. However, DZNep may have more clinical potential than many of these other inhibitors due to the known limitations of other AdoHcy hydrolase inhibitors. For example, adenosine dialdehyde, which is less potent than DZNep, may not metabolically survive because of the two labile aldehyde groups. In addition, other AdoHcy inhibitors such as neplanocin A are toxic because neplanocin A is converted into 5′-triphosphate whereas other compounds such as asysteromycin are less potent (27).
It had been previously reported that DZNep could turn on genes, such as KRT7, which contain a methylated CpG island within their promoter, without demethylation of 5-methylcytosine, whereas 5-Aza-CdR was incapable of turning on these genes (13). This finding was surprising in view of our current understanding of epigenetic therapy; therefore, we further studied the effects DZNep had on DNA methylation and gene expression of the KRT7 gene. We found that DZNep activates a novel transcript that is located further downstream from the promoter containing a CpG island. 5-Aza-CdR, but not DZNep, activates the transcript from the promoter containing the methylated CpG island. This activation by 5-Aza-CdR was accompanied by a 27% decrease in DNA methylation of KRT7 P1 as measured by pyrosequencing. This finding is contrary to the previous study (13). The reason for this discrepancy is not clear but may be due to the use of 5-Aza-CR, instead of 5-Aza-CdR, by the previous authors (13, 26). Overall, these studies stress the need for the identification of the exact start site of the transcripts being analyzed when conducting epigenetic studies.
We have also shown that although repressive histone marks can be reversed by DZNep treatment, a transcript cannot be reexpressed if it contains a methylated CpG island. Our studies have found that both the KRT7 P1 and P2 promoters contain H3K27me3 at their promoter. However, when this mark is decreased upon treatment of cells with DZNep, only the P2 promoter, which is unmethylated, is activated. This is in accordance with the data where knockdowns of the H3K9me2 methyltransferase or EZH2 failed to cause a reexpression of genes that were methylated at CpG sites (28, 29). In addition, we have shown that one gene, KRT7 P2, does not need H3K4me3 to become active (Fig. 4) and only the repressive marks have to be removed. It is possible that we would see a greater increase in expression of this transcript if the active mark was also not inhibited; however, initial activation of the KRT7 P2 transcript is not dependent on H3K4me3.
We also studied the kinetics of gene activation and the heritability of the somatic changes induced by DZNep. We found that changes induced by DZNep were not heritable and that the cell returned to its “ground” state within 24 hours after drug removal. Demethylation induced by 5-Aza-CdR was also not completely stable and genes became resilenced following removal of the drug, although it took approximately 7 more days than cells treated with DZNep for the cell to return to its previous state. This suggests that the cell has mechanisms in place that allow for homeostasis that cannot be permanently reversed by individual epigenetic drugs. A previous study addressed the heritability of epigenetic marks in bladder cancer cells treated with 5-Aza-CdR followed by continuous exposure to 4-phenylbuturic acid. This study showed that this regimen was not able to inhibit remethylation of the p16 promoter (4). We think it would be interesting to study the kinetics of gene expression of cells treated with DZNep and 5-Aza-CdR or DZNep and a HDAC inhibitor to determine if the resilencing of genes can be blocked using these combination therapies.
A compound such as DZNep that inhibits multiple repressive marks may be useful in epigenetic therapy. It has been shown that H3K9 methyltransferases (SUV39H1 and G9a) are required to perpetuate the malignant phenotype seen in prostate cancer cells (PC3) and that targeting these histone methyltransferases may be of therapeutic benefit (28). Therefore, having a single drug that decreases both H3K27me3 and H3K9me2 could be powerful. However, we show that DZNep can also inhibit the active histone mark H3K4me3. Although we find induction of transcription even upon the inhibition of H3K4me3, it is likely that a drug that was able to inhibit the repressive marks alone and did not affect the active histone marks would be more clinically valuable. It is therefore useful to continue looking for inhibitors to specific histone methyltransferases. Regardless, DZNep may be a useful tool in studying chromatin structure because it can inhibit multiple histone marks.
Because there are multiple epigenetic mechanisms that silence genes during carcinogenesis, it is important to develop combination therapies targeting these pathways. HDAC inhibitors have been shown to act synergistically with both 5-Aza-CdR and DZNep (3, 4, 30). It is possible that DZNep and H3K4 demethylase inhibitors could work together to provide a more powerful epigenetic therapy, but more research is needed (31, 32). It is also necessary to develop therapies that simultaneously target DNA methyltransferases and EZH2. In addition to providing helpful insights into how chromatin modifications affect gene expression, our data also suggest that combination treatment with both 5-Aza-CdR and DZNep may be beneficial for cancer treatment.
Supplementary Material
RNA was isolated from HaCaT cells and T24 cancer cells. Real time qPCR was used to verify the presence of both the KRT7 P1 and P2 transcript in these cells.
Real time qPCR was used to validate the expression of KRT17(NM_000422) and LAMB3(NM_000228) in MCF7 cells treated with 5 μM DZNep for 72 h.
A) A list of all genes that were upregulated 2-fold or more upon treatment of MCF7 cells with 5 μM DZNep. B) A list of all genes that were upregulated 2-fold or more upon treatment of MCF7 cells with 1 μM 5-Aza-CdR.
Acknowledgments
Financial support
PAJ is supported by NIH grant CA82422. TBM is supported by the American Cancer Society Postdoctoral Fellowship.
We would like to thank Steve Clarke for helpful discussions, Kim Siegmund for advice on the microarray analysis, and Phillippa Taberlay and Erika Wolff for proofreading of the manuscript. This research was supported in part by the Intramural Research Program of the NIH, Center for Cancer Research, NCI-Frederick
Abbreviations
- AdoHcy
S-adenosylhomocysteine
- AdoMet
S-adenosylmethionine
- Adox
adenosine-dialdehyde
- 5-Aza-CdR
5-Aza-2′-deoxycytidine
- 5-Aza-CR
5-Azacytidine
- DZNep
3-deazaneplanocin A
- EZH2
enhancer of zeste homolog 2
- PRC2
Polycomb repressor complex 2
- SAHA
suberoylanilide hydroxamic acid
References
- 1.Jones PA, Baylin SB. The epigenomics of cancer. Cell. 2007;128:683–92. doi: 10.1016/j.cell.2007.01.029. [DOI] [PMC free article] [PubMed] [Google Scholar]
- 2.Yoo CB, Jones PA. Epigenetic therapy of cancer: past, present, and future. Nat Rev Drug Discov. 2006;5:37–50. doi: 10.1038/nrd1930. [DOI] [PubMed] [Google Scholar]
- 3.Cameron EE, Bachman KE, Myohanen S, Herman JG, Baylin SB. Synergy of demethylation and histone deacetylase inhibition in the re-expressing of genes silenced in cancer. Nat Genet. 1999;21:103–7. doi: 10.1038/5047. [DOI] [PubMed] [Google Scholar]
- 4.Egger G, Aparicio AM, Escobar SG, Jones PA. Inhibition of histone deacetylation does not block resilencing of p16 after 5-aza-2′-deoxycytidine treatments. Cancer Res. 2007;67:346–53. doi: 10.1158/0008-5472.CAN-06-2845. [DOI] [PubMed] [Google Scholar]
- 5.Miranda TB, Jones PA. DNA methylation: the nuts and bolts of repression. J Cell Physiol. 2007;213:384–90. doi: 10.1002/jcp.21224. [DOI] [PubMed] [Google Scholar]
- 6.Kondo Y, Shen L, Cheng AS, et al. Gene silencing in cancer by histone H3 lysine 27trimethylation independent of promoter DNA methylation. Nat Genet. 2008;40:741–50. doi: 10.1038/ng.159. [DOI] [PubMed] [Google Scholar]
- 7.Gal-Yam EN, Egger G, Iniguez L, et al. Frequent switching of Polycomb repressive marks and DNA hypermethylation in the PC3 prostate cancer cell line. Proc Natl Acad Sci U S A. 2008;105:12979–84. doi: 10.1073/pnas.0806437105. [DOI] [PMC free article] [PubMed] [Google Scholar]
- 8.Cao R, Zhang Y. The functions of E(Z)/EZH2-mediated methylation of lysine 27 in histone H3. Curr Opin Genet Dev. 2004;14:155–164. doi: 10.1016/j.gde.2004.02.001. [DOI] [PubMed] [Google Scholar]
- 9.Braken AP, Pasini D, Capra M, Prosperini E, Colli E, Helin K. EZH2 is downstream of the pRB-E2F pathway, essential for proliferation and amplified in cancer. EMBO J. 2003;22:5323–35. doi: 10.1093/emboj/cdg542. [DOI] [PMC free article] [PubMed] [Google Scholar]
- 10.Varambally S, Dhanasekaran SM, Zhou M, et al. The polycomb group protein EZH2 is involved in progression of prostate cancer. Nature. 2002;419:624–9. doi: 10.1038/nature01075. [DOI] [PubMed] [Google Scholar]
- 11.Visser HP, Gunster MJ, Kluin-Nelemans HC, et al. The Polycomb group protein EZH2 is upregulated in proliferating, cultured human mantle cell lymphoma. Br J Haematol. 2001;112:950–58. doi: 10.1046/j.1365-2141.2001.02641.x. [DOI] [PubMed] [Google Scholar]
- 12.Yu J, Cao Q, Mehra R, et al. Integrative genomics analysis reveals silencing of beta-adrenergic signaling by Polycomb in prostate cancer. Cancer Cell. 2007;12:419–31. doi: 10.1016/j.ccr.2007.10.016. [DOI] [PubMed] [Google Scholar]
- 13.Tan J, Yang X, Zhuang L, et al. Pharmacologic disruption of Polycomb-repressive complex 2-mediated gene repression selectively induces apoptosis in cancer cells. Genes Dev. 2007;21:1050–63. doi: 10.1101/gad.1524107. [DOI] [PMC free article] [PubMed] [Google Scholar]
- 14.Borchardt RT, Keller BT, Patel-Thombre U, Neplanocin A. A potent inhibitor of S-adenosylhomocysteine hydrolase and of vaccinia virus multiplication in mouse L929 cells. J Biol Chem. 1984;259:4353–4358. [PubMed] [Google Scholar]
- 15.Chiang PK. Biological effects of inhibitors of S-adenosylhomocysteine hydrolase. Pharmacol Ther. 1998;77:115–34. doi: 10.1016/s0163-7258(97)00089-2. [DOI] [PubMed] [Google Scholar]
- 16.Boukamp P, Petrussevska RT, Breitkreutz D, Hornung J, Markham A, Fusenig NE. Normal keratinization in a spontaneously immortalized aneuploid human keratinocyte cell line. J Cell Biol. 1988;106:761–71. doi: 10.1083/jcb.106.3.761. [DOI] [PMC free article] [PubMed] [Google Scholar]
- 17.Glazer RI, Knode MC, Tseng CK, Haines DR, Marquez VE. 3-Deazaneplanocin A: a new inhibitor of S-adenosylhomocysteine synthesis and its effects in human colon carcinoma cells. Biochem Pharmacol. 1986;35:4523–7. doi: 10.1016/0006-2952(86)90774-4. [DOI] [PubMed] [Google Scholar]
- 18.Frommer M, McDonald LE, Millar DS, et al. A genomic sequencing protocol that yields a positive display of 5-methylcytosine residues in individual DNA strands. Proc Natl Acad Sci U S A. 1992;89:1827–31. doi: 10.1073/pnas.89.5.1827. [DOI] [PMC free article] [PubMed] [Google Scholar]
- 19.Yang AS, Estecio MR, Doshi K, Kondo Y, Tajara EH, Issa JP. A simple method for estimating global DNA methylation using bisulfite PCR of repetitive DNA elements. Nucleic Acids Res. 2004;32:e38. doi: 10.1093/nar/gnh032. [DOI] [PMC free article] [PubMed] [Google Scholar]
- 20.Liang G, Lin JC, Wei V, et al. Distinct localization of histone H3 acetylation and H3-4 methylation to the transcription start sites in the human genome. Proc Natl Acad Sci U S A. 2004;101:7357–62. doi: 10.1073/pnas.0401866101. [DOI] [PMC free article] [PubMed] [Google Scholar]
- 21.Bartel RL, Borchardt RT. Effects of adenosine dialdehyde on S-adenosylhomocysteine hydrolase and S-adenosylmethionine-dependent transmethylations in mouse L929 cells. Mol Pharmacol. 1984;25:418–24. [PubMed] [Google Scholar]
- 22.Vedel M, Lawrence F, Robert-Gero M, Lederer E. The antifungal antibiotic sinefungin as a very active inhibitor of methyltransferases and of the transformation of chick embryo fibroblasts by Rous sarcoma virus. Biochem Biophys Res Commun. 1978;85:371–6. doi: 10.1016/s0006-291x(78)80052-7. [DOI] [PubMed] [Google Scholar]
- 23.Xu WS, Parmigiani RB, Marks PA. Histone deacetylase inhibitors: molecular mechanisms of action. Oncogene. 2007;26:5541–52. doi: 10.1038/sj.onc.1210620. [DOI] [PubMed] [Google Scholar]
- 24.Su H, Altucci L, You Q. Competitive or noncompetitive, that’s the question: research toward histone deacetylase inhibitors. Mol Cancer Ther. 2008;7:1007–12. doi: 10.1158/1535-7163.MCT-07-2289. [DOI] [PubMed] [Google Scholar]
- 25.Cheng JC, Weisenberger DJ, Gonzales FA, et al. Continuous zebularine treatment effectively sustains demethylation in human bladder cancer cells. Mol Cell Biol. 2004;24:1270–8. doi: 10.1128/MCB.24.3.1270-1278.2004. [DOI] [PMC free article] [PubMed] [Google Scholar]
- 26.Montgomery JA, Clayton SJ, Thomas HJ, et al. Carbocyclic analogue of 3-deazaadenosine: a novel antiviral agent using S-adenosylhomocysteine hydrolase as a pharmacological target. J Med Chem. 1982;25:626–9. doi: 10.1021/jm00348a004. [DOI] [PubMed] [Google Scholar]
- 27.Kondo Y, Shen L, Ahmed S, et al. Downregulation of histone H3 lysine 9 methyltransferase G9a induces centrosome disruption and chromosome instability in cancer cells. PLoS ONE. 2008;3:e2037. doi: 10.1371/journal.pone.0002037. [DOI] [PMC free article] [PubMed] [Google Scholar]
- 28.McGarvey KM, Greene E, Fahrner JA, Jenuwein T, Baylin SB. DNA methylation and complete transcriptional silencing of cancer genes persist after depletion of EZH2. Cancer Res. 2007;67:5097–102. doi: 10.1158/0008-5472.CAN-06-2029. [DOI] [PubMed] [Google Scholar]
- 29.Jiang X, Tan J, Li J, et al. DACT3 is an epigenetic regulator of Wnt/beta-catenin signaling in colorectal cancer and is a therapeutic target of histone modifications. Cancer Cell. 2008;13:529–41. doi: 10.1016/j.ccr.2008.04.019. [DOI] [PMC free article] [PubMed] [Google Scholar]
- 30.Lee MG, Wynder C, Schmidt DM, McCafferty DG, Shiekhattar R. Histone H3 lysine 4 demethylation is a target of nonselective antidepressive medications. Chem Biol. 2006;13:563–7. doi: 10.1016/j.chembiol.2006.05.004. [DOI] [PubMed] [Google Scholar]
- 31.Szewczuk LM, Culhane JC, Yang M, Majumdar A, Yu H, Cole PA. Mechanistic analysis of a suicide inactivator of histone demethylase LSD1. Biochemistry. 2007;46:6892–6902. doi: 10.1021/bi700414b. [DOI] [PMC free article] [PubMed] [Google Scholar]
Associated Data
This section collects any data citations, data availability statements, or supplementary materials included in this article.
Supplementary Materials
RNA was isolated from HaCaT cells and T24 cancer cells. Real time qPCR was used to verify the presence of both the KRT7 P1 and P2 transcript in these cells.
Real time qPCR was used to validate the expression of KRT17(NM_000422) and LAMB3(NM_000228) in MCF7 cells treated with 5 μM DZNep for 72 h.
A) A list of all genes that were upregulated 2-fold or more upon treatment of MCF7 cells with 5 μM DZNep. B) A list of all genes that were upregulated 2-fold or more upon treatment of MCF7 cells with 1 μM 5-Aza-CdR.