Abstract
Mechanisms whereby acid reflux may accelerate the progression from Barrett's esophagus (BE) to esophageal adenocarcinoma (EA) are not fully understood. We have previously shown that NADPH oxidase NOX5-S generates reactive oxygen species (ROS) when Barrett's metaplastic cells are exposed to acid. Besides metaplastic cells, other H2O2-producing cells (e.g., inflammatory cells) present in BE mucosa may produce additional ROS, which may also affect metaplastic cells contributing to esophageal tumorigenesis. In this study, we investigate whether exogenous H2O2 stimulates cell proliferation by increasing NOX5-S expression. Low dose (10−13 M) of H2O2 significantly increased thymidine incorporation, NOX5-S mRNA, and protein expression in a Barrett's EA cell line FLO. H2O2-induced increase in NOX5-S expression was significantly inhibited by knockdown of nuclear factor (NF)-κB1 p50 with p50 small interfering RNA (siRNA) in EA cell lines FLO and OE33. H2O2 significantly increased p65 phosphorylation and the luciferase activity in FLO cells transfected with a NF-κB activation reporter plasmid pNF-κB-Luc. H2O2-induced increase in luciferase activity in FLO cells was significantly decreased by knockdown of extracellular signal-regulated kinase 2 (ERK2) mitogen-activated protein kinase (MAPK). Overexpression of p50 and p65 remarkably increased the luciferase activity in FLO cells transfected with a NOX5-S reporter plasmid NOX5-LP. In addition, H2O2-induced thymidine incorporation in FLO cells was significantly decreased by the MAPK kinase 1/2 inhibitor 2′-amino-3′methoxyflavone (PD98059) and ERK2 siRNA but not by ERK1 siRNA. Likewise, H2O2-induced increase in NOX5-S expression was significantly decreased by ERK2 siRNA in FLO and OE33 cells. We conclude that a low dose of H2O2 increases cell proliferation. H2O2-induced increase in cell proliferation may depend on sequential activation of ERK2 MAPK, NF-κB1 p50, and NOX5-S.
Introduction
Esophageal adenocarcinoma has increased in incidence at a rate exceeding that of any other cancers (Blot and McLaughlin, 1999; Howe et al., 2001; Pohl and Welch, 2005). The major risk factor for esophageal adenocarcinoma is gastroesophageal reflux disease complicated by Barrett's esophagus (BE) (Lagergren et al., 1999). Approximately 10% of gastroesophageal reflux disease patients develop BE where esophageal squamous epithelium damaged by acid reflux is replaced by a metaplastic, intestinal-type epithelium. The specialized intestinal metaplasia of BE is associated with a 30- to 125-fold increased risk for the development of esophageal adenocarcinoma (Haggitt, 1994; Kim et al., 1997; Wild and Hardie, 2003). However, mechanisms of the progression from metaplasia (BE) to adenocarcinoma are not fully understood.
Reactive oxygen species (ROS) may be an important factor mediating this progression because 1) high levels of ROS are present in BE (Olyaee et al., 1995; Wetscher et al., 1997) and in esophageal adenocarcinoma (Farhadi et al., 2002; Sihvo et al., 2003) and 2) ROS may damage DNA, RNA, lipids, and proteins, leading to increased mutation and altered functions of enzymes and proteins (e.g., activation of oncogene products and/or inhibition of tumor suppressor proteins) (Farhadi et al., 2002; Ohshima et al., 2003). Besides metaplastic cells, other cells (e.g., inflammatory cells) in BE mucosa may also produce ROS and affect metaplastic cells.
Lower levels of ROS, seen in nonphagocytic cells, were thought to be byproducts of aerobic metabolism. More recently, superoxide-generating homologs of phagocytic NADPH oxidase-catalytic subunit gp91phox (NOX1, NOX3–NOX5, DUOX1, and DUOX2) and homologs of other subunits (p41phox or NOXO1, p51phox, or NOXA1) have been found in several cell types (Suh et al., 1999; Bánfi et al., 2000; Lambeth, 2004), suggesting that ROS generated in these cells may have distinctive cellular functions. We have shown that NOX5-S is the major isoform of NADPH oxidase in FLO EA cells (Hong et al., 2010b) and that the expression of NOX5-S is significantly higher in BE with high-grade dysplasia than in BE without dysplasia (Fu et al., 2006). The expression of NOX5-S is also significantly higher in FLO cells than in esophageal squamous epithelial cells (Hong et al., 2011). We have also shown that acid-induced H2O2 production is mediated by the NADPH oxidase NOX5-S (Hong et al., 2010c). Overproduction of ROS, derived from up-regulation of NOX5-S, increases cycloxygenase-2-derived prostaglandin E2 production (Fu et al., 2006) and down-regulates a tumor suppressor gene p16 (Hong et al., 2010c), thus increasing cell proliferation and decreasing apoptosis. These changes may contribute to progression from BE to dysplasia and to adenocarcinoma. However, whether exogenous ROS increase cell proliferation via up-regulation of NOX5-S in EA cells is not known. In the present study, we find that H2O2 increases cell proliferation by sequential activation of mitogen-activated protein kinase (MAPK), NF-κB, and NOX5-S.
Materials and Methods
Cell Culture and H2O2 Treatment.
Human Barrett's adenocarcinoma cell line FLO was derived from human Barrett's esophageal adenocarcinoma (Hughes et al., 1997) and generously provided by Dr. David Beer (University of Michigan, Ann Arbor, MI). These cells were cultured in DMEM containing 10% fetal bovine serum and antibiotics at 37°C in a 5% CO2 humidified atmosphere. Human EA cell line OE33 was purchased from Sigma-Aldrich (St. Louis, MO) and cultured in DMEM containing 10% fetal bovine serum and antibiotics. The cell lines were cultured at 37°C in a 5% CO2-humidified atmosphere.
For H2O2 treatment, FLO cells were incubated with different concentrations of H2O2 (10−5, 10−7, 10−9, 10−11, 10−13, 10−14, and 10−15M) for 48 h. For inhibitor treatment, FLO cells were exposed to DMEM plus H2O2 (10−13 M) in the absence or presence of MEK1 kinase inhibitor PD98059 (2′-amino-3′-methoxyflavone, 10−5 M) or cell-permeable NF-κB inhibitor SN50 (AAVALLPAVLLALLAPVQRKRQKLMP, 10−5 M) for 24 h. The culture medium and cells were then collected for measurement of H2O2 and NOX5-S mRNA level.
Small Interfering RNA and Plasmid Transfection.
For small interfering RNA (siRNA) transfection, at 40 to 50% confluence, cells were trypsinized and diluted 1:5 with fresh medium without antibiotics (1–3 × 10⁵ cells/ml) and transferred to 12-well plates (1 ml/well). Transfection of siRNAs was carried out with Lipofectamine 2000 (Invitrogen, Carlsbad, CA) according to the manufacturer's protocol. For each well, 60 pmol of siRNA duplex of NOX5, p50, ERK2, ERK1, or control siRNAs formulated into liposomes were applied; the final volume was 1.2 ml/well. Twenty-four hours later, the transfectants were exposed to H2O2 (10−13 M) in fresh medium for an additional 48 h. Finally, the culture medium and the transfectants were collected for measuring NOX5-S mRNA and protein level. Transfection efficiencies were determined by fluorescence microscopy after transfection of Block-it fluorescent oligo (Invitrogen) and were approximately 90% at 48 h. Control siRNA is a scrambled sequence that will not lead to the specific degradation of any known cellular mRNA. For plasmid transfection, 0.5-μg plasmids (NOX5-LP, pNF-κB-Luc, or pCDNA3.0) or 0.1-μg Renilla reniformis luciferase plasmid formulated into liposomes were applied. All other procedures were similar to those described above.
RT-PCR.
Total RNA was extracted by TRIzol reagent (Invitrogen) according to the protocol of the manufacturer, and 1.0 μg of total RNAs were reversely transcribed by use of the kit SUPERSCRIPT First-Strand Synthesis System for RT-PCR (Invitrogen).
Quantitative Real-Time PCR.
Gene expression and regulation were measured using real-time PCR analysis. Random hexamers were used for real-time PCR analysis performed in a 15-μl reaction on a 96-well clear plate using Power SYBR Green RT-PCR reagents kit (Applied Biosystems). The primers used were as follows: NOX5-S sense (5′-AAGACTCCATCACGGGGCTGCA-3′), NOX5-S antisense (5′-CCTTCAGCACCTTGGCCAGA-3′), 18S sense (5′-CGGACAGGATTGACAGATTGATAGC-3′), and 18S antisense (5′-TGCCAGAGTCTCGTTCGTTATCG-3′). Reactions were carried out in an Applied Biosystems StepOnePlus real-time PCR system for one cycle at 94°C for 5 min; 40 cycles at 94°C for 30 s, 59°C for 30 s, and 72°C for 30 s; 1 cycle at 94°C for 1 min; and 1 cycle at 55°C for 30 s. Fluorescence values of SYBR Green I dye, representing the amount of product amplified at that point in the reaction, were recorded in real time at both the annealing step and the extension step of each cycle. The Ct, defined as the point at which the fluorescence signal was statistically significant above background, was calculated for each amplicon in each experimental sample using a StepOne software. This value was then used to determine the relative amount of amplification in each sample by interpolating from the standard curve. The transcript level of each specific gene was normalized to 18S amplification.
Luciferase Assay.
FLO EA cells were seeded in 12-well plates for 24 h. R. reniformis luciferase (0.1 μg) and 0.5 μg of pCDNA3.0 (control) or NOX5-S luciferase reporter plasmid NOX5-LP containing the NOX5-S promoter fragment (−2501 to −1 from ATG) (Si et al., 2007) or pNF-κB-Luc plasmid were transfected by using Lipofectamine 2000 (Invitrogen). Luciferase activity was assayed 24 h after transfection. Cell extracts were prepared by lysing the cells with lysis buffer (Promega, Madison, WI). The lysate was centrifuged at 13,000 rpm for 10 min to pellet the cell debris. The luciferase activities in the cell lysates were measured by using a Packard TopCount-NXT microplate scintillation and luminescence counter (PerkinElmer Life and Analytical Sciences, Waltham, MA) according to the protocol (Promega) and normalized to R. reniformis luciferase. The number of experiments was indicated in figure legends, and each experiment was performed in triplicate.
Western Blot Analysis.
Cells was lysed in Triton X-100 lysis buffer containing 50 mM Tris-HCl, pH 7.5, 100 mM NaCl, 50 mM NaF, 5 mM EDTA, 1% (v/v) Triton X-100, 40 mM β-glycerol phosphate, 40 mM p-nitrophenylphosphate, 200 μM sodium orthovanadate, 100 μM phenylmethylsulfonyl fluoride, 1 μg/ml leupeptin, 1 μg/ml pepstatin A, and 1 μg/ml aprotinin. The suspension was centrifuged at 15,000g for 5 min, and the protein concentration in the supernatant was determined. Western blot was done as described previously (Cao et al., 2003; Fu et al., 2006). In brief, after these supernatants were subjected to SDS-polyacrylamide gel electrophoresis, the separated proteins were electrophoretically transferred to a nitrocellulose membrane at 30 V overnight. The nitrocellulose membranes were blocked in 5% nonfat dry milk and then incubated with appropriate primary antibodies followed by a 60-min incubation in horseradish peroxidase-conjugated secondary antibody (Santa Cruz Biotechnologies, Santa Cruz, CA). Detection was achieved with an enhanced chemiluminescence agent (GE Healthcare, Chalfont St. Giles, Buckinghamshire, UK).
Primary antibodies used were human glyceraldehyde 3-phosphate dehydrogenase (GAPDH) antibody (1:1000), NOX5-S antibody (1:1000), p-ERK1/2 antibody (1:1000), ERK2 antibody (1:1000), p-p65 antibody (1:1000), and p65 antibody (1:1000). NOX5 antibody against a unique NOX5 peptide (NH2-CLQTRTQPGRPDWSKV-COOH) was prepared by Sigma-Genosys (The Woodlands, TX) and used at a dilution of 1:1000.
Protein Measurement.
The amount of protein was determined by colorimetric analysis using the protein assay kit from Bio-Rad Laboratories (Hercules, CA) according to the Bradford method (Bradford, 1976).
[3H]Thymidine Incorporation.
For PD98059 treatment, cells were preincubated with PD98059 10−5 M for 1 h and then treated without (control) or with H2O2 (10−13 M) in the absence (control) or presence of PD98059 for 48 h. For siRNA transfection 24 h after siRNAs of NOX5, p50, ERK2, ERK1, or control was introduced, cells were treated without or with H2O2 (10−13 M) for 48 h, and then incubated with methyl-[3H]thymidine (0.05 μCi/ml) for 4 h. After being washed three times with phosphate-buffered saline to remove unincorporated radioactivity, cells were collected and homogenized with a lysis buffer containing 50 mM HEPES, 50 mM NaCl, 1% Triton X-100, 1% Nonidet P-40, 0.1 mM phenylmethylsulfonyl fluoride, and 1 mM dithiothreitol, pH 7.4. [methyl-3H]Thymidine uptake was measured in a TopCount-NXT microplate scintillation and luminescence counter (Packard Bioscience Company). The level of protein in the homogenates was also determined, and the level of [methyl-3H]thymidine incorporation was normalized to protein content.
Amplex Red Hydrogen Peroxide Fluorescent Assay.
Levels of H2O2 in culture medium were determined by the Amplex Red H2O2 assay kit (Invitrogen), according to the manufacturer's instruction. This assay uses the Amplex Red reagent (10-acetyl-3,7-dihydroxyphenoxazine) to detect H2O2. In the presence of peroxidase, the Amplex Red reagent reacts with H2O2 in a 1:1 stoichiometry to produce the red-fluorescent oxidation product resorufin. Fluorescence is then measured with a fluorescence microplate reader with an excitation at 540 nm and emission detection at 590 nm.
Materials.
Human NOX5 siRNA was purchased from Applied Biosystems (Foster City, CA). PD98059 and SN50 were bought from Calbiochem (San Diego, CA); ERK2 antibody, GAPDH antibody, control siRNA, ERK2 siRNA, ERK1 siRNA, and p50 siRNA were from Santa Cruz Biotechnology; and phosphorylated MAPK antibody, phosphorylated p65 antibody, and p65 antibody were from Cell Signaling Technology (Danvers, MA). pNF-κB-Luc vector was purchased from Clontech Laboratories, Inc. (Mountain View, CA). P50 plasmid (Ballard et al., 1992) was from Addgene (Cambridge, MA). Triton X-100, phenylmethylsulfonyl fluoride, DMEM, antibiotics, and other reagents were purchased from Sigma-Aldrich.
Statistical Analysis.
Data were expressed as means ± S.E. Statistical differences between two groups were determined by Student's t test. Differences among multiple groups were tested by ANOVA and checked for significance by Fisher's protected least significant difference test.
Results
H2O2 Up-regulates NOX5-S Expression.
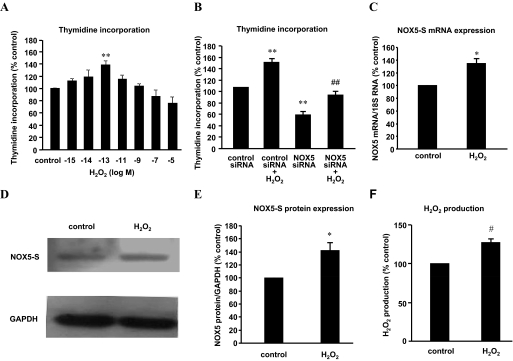
To investigate whether H2O2 affects cell proliferation, we obtained a H2O2 dose-response curve. Figure 1A shows that 10−13 M H2O2 significantly increased thymidine incorporation by 39.3 ± 6.6% in FLO cells, whereas higher doses (10−5 and 10−7 M) slightly decreased thymidine incorporation. The data suggest that low dose of H2O2 may increase cell proliferation in FLO cells.
Fig. 1.
H2O2 up-regulates NOX5-S expression in FLO cells. A, FLO cells were incubated with different concentrations of H2O2 (10−5, 10−7, 10−9, 10−11, 10−13, 10−14, 10−15 M) for 48 h and then incubated with methyl-[3H]thymidine (0.05 μCi/ml) for 4 h. H2O2 (10−13 M) significantly increased thymidine incorporation, whereas higher doses (10−5 and 10−7 M) slightly decreased thymidine incorporation. B, FLO cells were treated with H2O2 (10−13 M, 48 h) 24 h after NOX5 siRNA and control siRNA were introduced into FLO cells by Lipofectamine 2000. Knockdown of NOX5-S significantly decreased thymidine incorporation at basal condition and in response to H2O2 treatment. C, FLO cells were treated with 10−13 M H2O2 for 48 h, and then NOX5-S mRNA levels were measured by real-time PCR. H2O2 (10−13 M) significantly increased NOX5-S mRNA levels. D and E, a typical image of three Western blot analyses (D) and summarized data (E) show that 10−13 M H2O2 significantly increased NOX5-S protein level. FLO cells were treated with 10−13 M H2O2 for 48 h. F, FLO cells were treated with 10−13 M H2O2 for 48 h, washed, and cultured for an additional 24 h. H2O2 levels in culture medium were measured by using an Amplex Red H2O2 assay kit. A 48-h H2O2 treatment significantly increased H2O2 production (n = 3). t test, *, P < 0.05, #, P < 0.01; ANOVA, **, P < 0.01, compared with control or control siRNA group; ANOVA, ##, P < 0.01, compared with control siRNA plus H2O2 group.
We have shown that NOX5-S mediates acid-induced increase in cell proliferation. Therefore, we studied whether NOX5-S mediates exogenous H2O2-induced increase in cell proliferation. We found that knockdown of NOX5-S with NOX5 siRNA, which has been shown by us to effectively knock down NOX5-S (Fu et al., 2006), significantly decreased thymidine incorporation at basal condition as well as in response to H2O2 treatment in FLO cells (Fig. 1B), suggesting that NOX5-S may mediate H2O2-induced increase in cell proliferation.
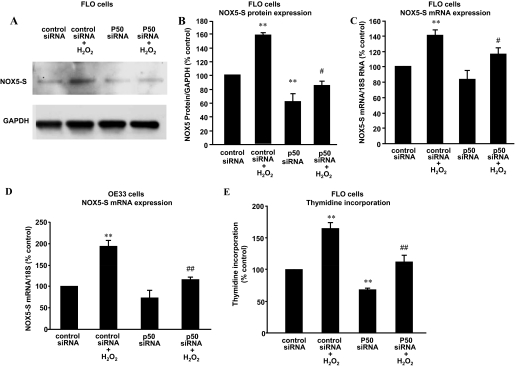
Next, we examined whether H2O2 up-regulates NOX5-S. NOX5-S mRNA was measured by real-time PCR. H2O2 (10−13 M; 48-h treatment) significantly increased NOX5-S mRNA level by 34.9 ± 7.8% (ANOVA, P < 0.05; Fig. 1C) and protein level by 42.5 ± 11.6% (ANOVA, P < 0.05; Fig. 1, D–E) in FLO cells. Likewise, H2O2 significantly increased the NOX5-S mRNA level by 93.9 ± 13.5% in an EA cell line OE33 (ANOVA, P < 0.01; Fig. 2D). To examine whether up-regulation of NOX5-S enhances H2O2 production, FLO cells were incubated with 10−13 M H2O2 for 48 h, washed, and then cultured in regular culture medium for additional 24 h. Culture medium was collected for measurement. Forty-eight-hour treatment of H2O2 significantly increased H2O2 production by 27.6 ± 4.9% (t test, P < 0.01; Fig. 1F).
Fig. 2.
Role of NF-κB in H2O2-induced NOX5-S expression. Transfection of p50 siRNA and control siRNA was carried out with Lipofectamine 2000. After a 4-h transfection, the transfection medium was replaced with regular medium. Twenty-four hours later, the transfectants were exposed to H2O2 (10−13 M) in fresh medium for an additional 48 h. A and B, a typical image of three Western blot analyses (A) and summarized data (B) show that knockdown of p50 significantly decreased NOX5-S protein expression at basal condition and in response to H2O2 treatment in FLO cells. C, knockdown of p50 significantly decreased NOX5 mRNA levels in response to H2O2 treatment in FLO cells. D, knockdown of p50 significantly decreased NOX5 mRNA levels in response to H2O2 treatment in OE33 cells. E, knockdown of p50 significantly decreased not only thymidine incorporation at basal condition but also H2O2-induced increase in thymidine incorporation in FLO cells. The data suggest that p50 mediates H2O2-induced increase in NOX5-S expression and in cell proliferation. n = 3, ANOVA, *, P < 0.05, **, P < 0.01, compared with control siRNA group; ANOVA. #, P < 0.05, compared with control siRNA + H2O2 group; ##, P < 0.01, compared with control siRNA group plus H2O2 group.
Role of NF-κB in H2O2 Induced NOX5-S Expression.
To examine the role of NF-κB in H2O2-induced NOX5-S expression, we used p50 siRNA, which has been shown by us to effectively knock down p50 (Hong et al., 2010a). Figure 2, A, B, and C, shows that knockdown of p50 significantly decreased NOX5-S mRNA levels from 140.7 ± 6.8 to 116.6 ± 7.2% (ANOVA, P < 0.05) and NOX5-S protein expression from 158.0 ± 2.2 to 85.0 ± 5.8% (ANOVA, P < 0.05) in response to H2O2 treatment in FLO cells. Likewise, the knockdown of p50 significantly decreased NOX5-S mRNA levels from 193.9 ± 13.5 to 116.6 ± 6.4% in OE33 cells (ANOVA, P < 0.01; Fig. 2D). In addition, knockdown of p50 significantly decreased H2O2-induced thymidine incorporation from 164.9 ± 8.42 to 112.3 ± 9.2% (ANOVA, P < 0.05; Fig. 2E).
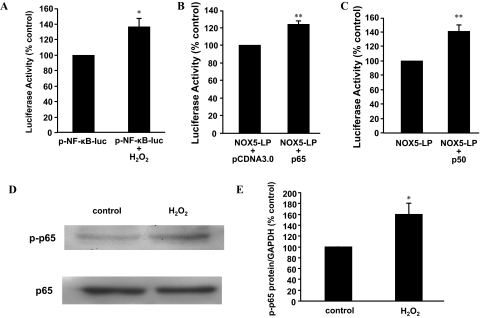
The data suggest that NF-κB1 p50 may be involved in H2O2-induced NOX5-S expression. To further confirm this result, we transfected FLO cells with a NF-κB reporter plasmid pNF-κB-Luc. H2O2 (10−13 M) significantly increased the luciferase activity by 36.0 ± 10.0% (t test, P < 0.05; Fig. 3A). In addition, 10−13 M H2O2 (48-h treatment) significantly increased p65 phosphorylation by 59.4 ± 19.6% (ANOVA, P < 0.05; Fig. 3, D and E). These data suggest that H2O2 may activate NF-κB.
Fig. 3.
NF-κB1 p50 may be involved in H2O2-induced NOX5-S. A, twenty-four hours after transfection with pNF-κB-Luc plasmid and R. reniformis luciferase plasmid, FLO cells were treated with 10−13 M H2O2 for 48 h, and then luciferase activity was measured. H2O2 (10−13 M) significantly increased the luciferase activity in FLO cells, suggesting that H2O2 may activate NF-κB. B, twenty-four hours after transfection with NOX5-LP and R. reniformis luciferase plasmid plus p65 or pCDNA3.0 (control), luciferase activity was measured. Transfection with p65 expression plasmid significantly increased luciferase activity, suggesting that p65 may activate NOX5-S promoter. C, twenty-four hours after transfection with NOX5-LP and R. reniformis luciferase plasmid plus p50 or pCMV4 (control), luciferase activity was measured. Transfection with p50 expression plasmid significantly increased luciferase activity, suggesting that p50 may activate NOX5-S promoter. D and E, a typical image of three Western blot analyses (D) and summarized data (E) show that 10−13 M H2O2 significantly increased p65 phosphorylation. FLO cells were treated with 10−13 M H2O2 for 48 h. n = 3, t test, *, P < 0.05, compared with pNF-κB-Luc group or NOX5-LP plus pCDNA3.0 group; **, P < 0.01, compared with NOX5-LP or NOX5-LP + pCDNA3.0.
To examine whether NF-κB activates NOX5-S promoter, we transfected FLO cells with a NOX5-S reporter plasmid, NOX5LP. Transfection with p65 or p50 expression plasmid significantly increased luciferase activity to 124.1 ± 3.6% (Fig. 3B) and to 140.2 ± 8.3% (Fig. 3C), respectively, suggesting that NF-κB may activate NOX5-S promoter.
Role of MAPK in H2O2-Induced NOX5-S Expression.
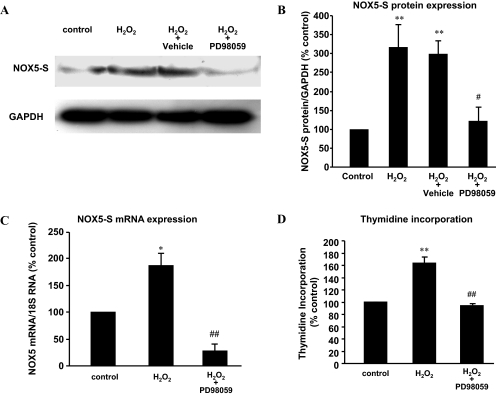
To examine the role of MAPK in H2O2-induced NOX5-S expression, we used the MAPK kinase 1 (MEK1) inhibitor PD98059. Figure 4, A–C, shows that PD98059 significantly decreased H2O2-induced NOX5 protein levels from 298.2 ± 33.4 to 122.2 ± 35.83% (ANOVA, P < 0.05; Fig. 4, A and B) and NOX5 mRNA levels from 186.5 ± 26.8 to 28.3 ± 12.2% control (ANOVA, P < 0.05; Fig. 4C). In addition, PD98059 significantly reduced thymidine incorporation from 163 ± 9.9 to 94.7 ± 2.1% control (ANOVA, P < 0.01; Fig. 4D).
Fig. 4.
Role of MAPK in H2O2-induced NOX5-S expression. A and B, a typical image of three Western blot analyses (A) and summarized data (B) show that H2O2 significantly increased NOX5-S protein expression in FLO cells, an increase that was significantly decreased by PD98059. C, H2O2 significantly increased NOX5-S mRNA levels in FLO cells, an increase that was significantly decreased by PD98059, suggesting that MAPK may be involved in H2O2-induced NOX5-S expression. D, H2O2 significantly increased thymidine incorporation in FLO cells, an increase that was significantly decreased by PD98059, suggesting that MAPK may be involved in H2O2-induced increase in cell proliferation. n = 3, ANOVA, *, P < 0.05, **, P < 0.01, compared with control group; #, P < 0.05, compared with H2O2 + vehicle group; ##, P < 0.01, compared with H2O2 group.
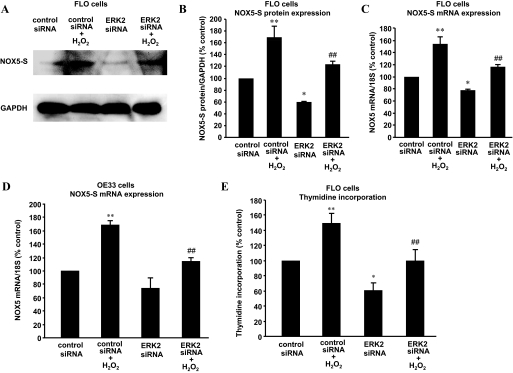
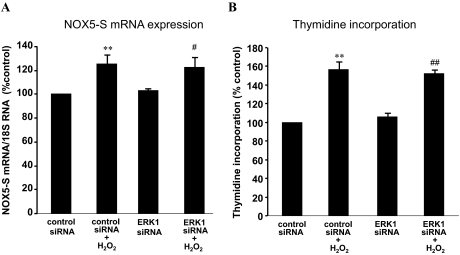
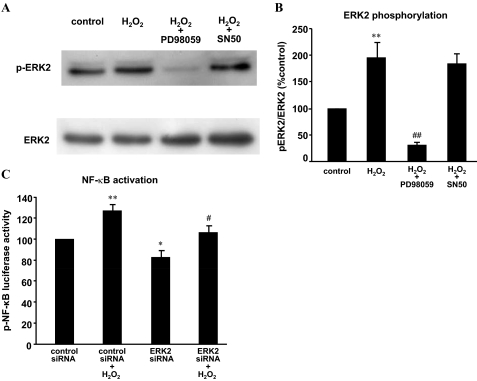
To determine which MAPKs mediate H2O2-induced NOX5-S expression, we used ERK1 and ERK2 siRNAs that have been shown by us to effectively knock down ERK1 and ERK2 (Hong et al., 2010a), respectively. Figure 5, A–C, shows that knockdown of ERK2 with ERK2 siRNA significantly decreased NOX5 protein expression from 160.1 ± 19.4 to 122.9 ± 5.2% control (ANOVA, P < 0.01; Fig. 5, A and B) and NOX5 mRNA levels from 153.9 ± 12 to 116.2 ± 3.5% control (ANOVA P < 0.01; Fig. 5C) in FLO cells. Likewise, in OE33 cells knockdown of ERK2 significantly reduced NOX5 mRNA levels from 169.4 ± 5.7 to 114.3 ± 4.6% control (ANOVA P < 0.01; Fig. 5D). In addition, the knockdown of ERK2 significantly reduced thymidine incorporation from 149.3 ± 12.4 to 99.8 ± 14.9% control in FLO cells (ANOVA, P < 0.01; Fig. 5E). In contrast, the knockdown of ERK1 with ERK1 siRNA had no significant effect on NOX5 mRNA levels (Fig. 6A) and thymidine incorporation (Fig. 6B) in FLO cells. The data suggest that ERK2 MAPK may be involved in H2O2-induced NOX5-S expression. To investigate whether H2O2 activates ERK2 MAPK, we studied ERK2 MAPK phosphorylation. Figure 7, A and B, shows that H2O2 significantly increased ERK2 MAPK phosphorylation, suggesting that H2O2 may activate ERK2 MAPK. PD98059 significantly decreased ERK2 phosphorylation, suggesting that PD98059 effectively blocks MAPK pathway. However, NF-κB inhibitor SN50 had no significant effect on ERK2 phosphorylation. The knockdown of ERK2 with ERK2 siRNA significantly reduced H2O2-induced increase in luciferase activity in FLO cells transfected with pNF-κB-Luc (Fig. 7C), suggesting that ERK2 MAPK may mediate H2O2-induced activation of NF-κB.
Fig. 5.
ERK2 MAPK may be involved in H2O2-induced NOX5-S expression. Transfection of ERK2 siRNA and control siRNA was carried out with Lipofectamine 2000. After a 4-h transfection, the transfection medium was replaced with regular medium. Twenty-four hours later, the transfectants were exposed to H2O2 (10−3 M) in fresh medium for an additional 48 h. A and B, a typical image of three Western blot analyses (A) and summarized data (B) show that knockdown of ERK2 significantly decreased NOX5-S protein expression at basal condition and in response to H2O2 treatment in FLO cells. C, knockdown of ERK2 significantly decreased NOX5 mRNA levels at basal condition and in response to H2O2 treatment in FLO cells. D, knockdown of ERK2 significantly decreased NOX5 mRNA levels in response to H2O2 treatment in OE33 cells. E, knockdown of ERK2 significantly decreased thymidine incorporation at basal condition and in response to H2O2 treatment in FLO cells. The data suggest that ERK2 may mediate H2O2-induced increase in NOX5-S expression and in cell proliferation. n = 3, ANOVA, *, P < 0.05, **, P < 0.01, compared with control siRNA group; #, P < 0.05, ##, P < 0.01, compared with control siRNA plus H2O2 group.
Fig. 6.
ERK1 MAPK may be not involved in H2O2-induced NOX5-S expression. Transfection of ERK1 siRNA and control siRNA was carried out with Lipofectamine 2000. After a 4-h transfection, the transfection medium was replaced with regular medium. Twenty-four hours later, the transfectants were exposed to H2O2 (10−13 M) in fresh medium for an additional 48 h. A, knockdown of ERK1 had no effect on H2O2-induced NOX5 mRNA levels. B, knockdown of ERK1 had no effect on H2O2-induced increase in thymidine incorporation. The data suggest that ERK1 may not be involved in H2O2-induced increase in NOX5-S expression and in cell proliferation. n = 3, ANOVA, **, P < 0.01, compared with control siRNA group; #, P < 0.05, ##, P < 0.01, compared with control siRNA plus H2O2 group.
Fig. 7.
H2O2 may activate ERK2 MAPK. A and B, a typical image of three Western blot analyses (A) and summarized data (B) show that H2O2 significantly increased ERK2 phosphorylation, an increase that was significantly decreased by PD98059 (10−5 M) but not by SN50 (10−5 M). FLO cells were exposed to 10−5 M H2O2 for 15 min in the absence or presence of PD98059 (10−5 M) or SN50 (10−5 M). C, FLO cells were transfected with 0.1 μg of R. reniformis luciferase plasmid and 0.5 μg of pNF-κB-Luc plasmid by using Lipofectamine 2000. Twenty-four hours after transfection with plasmids, 60 pmol of ERK2 or control siRNA per well were transfected. Twenty-four hours later, FLO cells were treated with 10−13 M H2O2 for additional 48 h. Finally, the luciferase activity was measured. H2O2 significantly increased luciferase activity in FLO cells, an increase that was significantly reduced by knockdown of ERK2, suggesting that activation of NF-κB may depend on activation of ERK2. n = 3. **, P < 0.01, ANOVA, compared with control siRNA group; *, P < 0.05, ANOVA, compared with control siRNA group; #, P < 0.05, ANOVA, compared with control siRNA plus H2O2 group; ##, P < 0.01, ANOVA, compared with H2O2 group.
Discussion
Gastroesophageal reflux disease complicated by BE is a major risk factor for EA (Lagergren et al., 1999). Mechanisms whereby acid reflux may accelerate the progression from BE to EA are not fully understood. ROS have been reported to be increased both in BE (Olyaee et al., 1995; Wetscher et al., 1997) and esophageal adenocarcinoma (Farhadi et al., 2002; Sihvo et al., 2003). We have previously shown that Barrett's metaplastic cells may be a source of ROS and that NADPH oxidase NOX5-S is responsible for acid-induced H2O2 production in Barrett's and EA cells (Hong et al., 2010c). Besides metaplastic cells, other cells in BE mucosa (e.g., inflammatory cells) may also produce ROS, which may affect metaplastic cells and thereby contribute to esophageal tumorigenesis.
We have shown that H2O2 increases cell proliferation in Barrett's cell line BAR-T and EA cell line OE33 (Hong et al., 2010c). Consistent with our previous findings, we found that a low dose (10−13 M) of H2O2 significantly increased thymidine incorporation, whereas higher doses (10−5 and 10−7 M) slightly decreased thymidine incorporation in FLO cells. The data suggest that low dose of H2O2 may increase cell proliferation in FLO cells. However, mechanisms whereby ROS increase cell proliferation are not fully understood.
In this study, we investigated whether exogenous H2O2 affects cell proliferation in a Barrett's EA cell line FLO by stimulating NOX5-S expression. We found that NOX5-S may mediate H2O2-induced increase in cell proliferation because 10−13 M H2O2 significantly increased NOX5-S mRNA level in FLO and OE33 cells as well as protein level and H2O2 production in FLO cells, whereas knockdown of NOX5-S blocked H2O2-induced increase in thymidine incorporation in FLO cells.
ROS have been reported to activate NF-κB (Flohé et al., 1997). We have also shown that NOX5-S-derived ROS activates NF-κB in BE cell line BAR-T (Si et al., 2007). NF-κB, a transcription factor, is known to function as tumor promoter (Pikarsky et al., 2004; Karin, 2006) and plays a key role in the development of colitis-associated cancer (Greten et al., 2004) and cholestatic hepatitis-associated hepatocellular carcinoma (Pikarsky et al., 2004). NF-κB is thought to be a member of a family of Rel domain-containing proteins, including Rel A (also called p65), Rel B, c-Rel, NF-κB1 (p105/p50), and NF-κB2 (p100/p52). p105 and p100 are larger precursor proteins containing IκB (an inhibitor of κB)-like ankyrin repeat sequences in their carboxyl termini. Because of their IκB-like ankyrin repeat sequences, these precursors are retained in the cytoplasm and require proteolytic processing to generate their mature DNA-binding proteins p50 and p52, respectively (Karin et al., 2002). In the cytoplasm, NF-κB is in an inactive state, and three pathways regulate its activity. In the first pathway, a heterotrimer composed of p50, p65, and IκB is degraded in a ubiquitin-dependent reaction, leading to the translocation of the p65-p50 dimers to the nucleus (Karin et al., 2002). In the second pathway, the dimers consisting of p100 and Rel B undergo proteolytic removal of the IκB-like C-terminal domain of p100, allowing Rel B-p52 dimers to translocate to nucleus. In the third pathway, p50 (or p52), homodimers enter the nucleus where NF-κB activates gene transcription (Karin et al., 2002; De Bosscher et al., 2006). p50 plays an important role in lymphoid organogenesis and inflammation, whereas p52 is mainly involved in lymphoid organogenesis (Shih et al., 2011). Therefore, we focused on the role of p50 in NOX5-S expression.
We found that knockdown of p50 with p50 siRNA significantly decreased cell proliferation in FLO cells and inhibited H2O2-induced increase in NOX5-S expression in OE33 and FLO cells, suggesting that NF-κB1 p50 may be involved in H2O2-induced NOX5-S expression in FLO and OE33 cells. This result is further supported by the following findings: 1) H2O2 significantly increased p65 phosphorylation and the luciferase activity in FLO cells transfected with a reporter plasmid pNF-κB-Luc, suggesting that H2O2 may activate NF-κB; 2) transfection with p50 or p65 expression plasmid significantly increased a NOX5-S reporter plasmid NOX5-LP, suggesting that NF-κB may activate NOX5-S promoter.
ROS have been shown to activate MAPKs (Kumar et al., 2008). ERK1 and ERK2 are isoforms of the “classic” MAPK. Both ERK1 and ERK2 are activated by MAPK kinase (MEK) 1/2. MEK1/2 phosphorylates threonine and tyrosine residues in the Thr–Glu–Tyr (TEY) sequence of ERK1/2, resulting in the activation of ERK1/2. The ERK1/2 MAPK pathway is involved in various cellular functions, including cell proliferation, differentiation, and migration (Nishimoto and Nishida, 2006). This pathway is constitutively active in human tumors (Gioeli et al., 1999; Hoshino et al., 1999; Tanaka et al., 2003) and is known to be involved in acid-induced increase in cell proliferation in EA cells (Souza et al., 2002, 2004). It is also known to be involved in acid-induced increase in cell proliferation and in MAPK phosphorylation in SEG1 cells (Souza et al., 2002, 2004), suggesting that ERK1/2 MAPKs are activated by acid treatment. However, whether MAPKs contribute to H2O2-induced expression of NOX5-S by up-regulation of NF-κB and increase in cell proliferation is not known. We found that MEK1 kinase inhibitor PD98059 and knockdown of ERK2 significantly decreased H2O2-induced increase in NOX5-S protein and mRNA levels and in thymidine incorporation in EA cells, whereas knockdown of ERK1 had no effect. In addition, H2O2 significantly increased ERK2 MAPK phosphorylation, suggesting that H2O2 may activate ERK2 MAPK. These data suggest that ERK2 MAPK, but not ERK1, may be involved in H2O2-induced NOX5-S expression.
We examined the relationship next between ERK2 MAPK and NF-κB. We found that ERK2 MAPK activates NF-κB because 1) knockdown of ERK2 significantly reduced H2O2-induced increase in luciferase activity in FLO cells transfected with pNF-κB-Luc and 2) NF-κB inhibitor SN50 had no significant effect on ERK2 phosphorylation. This result is consistent with the findings in a Citrobacter rodentium-induced transmissible murine colonic hyperplasia model (Chandrakesan et al., 2010).
Mechanisms of NOX5-S-mediated increase in cell proliferation are not fully understood. We have shown two possible mechanisms: 1) NOX5-S-derived ROS activate cyclooxygenase 2, increase prostaglandin E2 production, and thereby enhance cell proliferation (Si et al., 2007) and 2) NOX5-S-derived ROS also cause p16 promoter hypermethylation, down-regulate p16 expression, and thus, stimulate cell proliferation (Hong et al., 2010c).
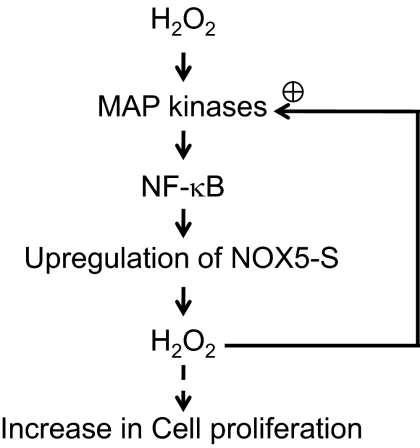
In conclusion, low doses of H2O2 increase cell proliferation. H2O2-induced increase in cell proliferation may depend on sequential activation of ERK2 MAPK and NF-κB and thus up-regulate NOX5-S expression (Fig. 8). It is possible that in Barrett's esophagus ROS produced by Barrett's cells, inflammatory cells, and other parenchymal cells may activate ERK2 MAPK and NF-κB and cause up-regulation of NOX5-S, which further enhances production of ROS (a positive feedback) and increases cell proliferation and DNA damage, thereby contributing to the esophageal tumorigenesis.
Fig. 8.
Signaling in H2O2-induced increase in cell proliferation. Low doses of H2O2 increase cell proliferation. H2O2-induced increase in cell proliferation may depend on sequential activation of ERK2 MAPK and NF-κB and thus up-regulate NOX5-S expression, which further enhances production of ROS (a positive feedback).
This work was supported by the National Institutes of Health National Institute of Diabetes and Digestive and Kidney Diseases [Grant R01-DK080703].
Article, publication date, and citation information can be found at http://jpet.aspetjournals.org.
doi:10.1124/jpet.111.182352.
- BE
- Barrett's esophagus
- NOX
- NADPH oxidase
- ROS
- reactive oxygen species
- EA
- esophageal adenocarcinoma
- NF-κB
- nuclear factor-κB
- Luc
- luciferase
- MAPK
- mitogen-activated protein kinase
- siRNA
- small interfering RNA
- ERK1/2
- extracellular signal-regulated kinase 1/2
- MEK
- mitogen-activated protein kinase kinase
- PD98059
- 2′-amino-3′methoxyflavone
- DMEM
- Dulbecco's modified Eagle's medium
- SN50
- AAVALLPAVLLALLAPVQRKRQKLMP
- RT-PCR
- reverse transcription-polymerase chain reaction
- ANOVA
- analysis of variance.
Authorship Contributions
Participated in research design: Zhou and Cao.
Conducted experiments: Zhou and Li.
Contributed new reagents or analytic tools: Resnick, Wands, and Cao.
Performed data analysis: Zhou and Cao.
Wrote or contributed to the writing of the manuscript: Zhou, Resnick, Behar, and Cao.
References
- Ballard DW, Dixon EP, Peffer NJ, Bogerd H, Doerre S, Stein B, Greene WC. (1992) The 65-kDa subunit of human NF-kappa B functions as a potent transcriptional activator and a target for v-Rel-mediated repression. Proc Natl Acad Sci USA 89:1875–1879 [DOI] [PMC free article] [PubMed] [Google Scholar]
- Bánfi B, Maturana A, Jaconi S, Arnaudeau S, Laforge T, Sinha B, Ligeti E, Demaurex N, Krause KH. (2000) A mammalian H+ channel generated through alternative splicing of the NADPH oxidase homolog NOH-1. Science 287:138–142 [DOI] [PubMed] [Google Scholar]
- Blot WJ, McLaughlin JK. (1999) The changing epidemiology of esophageal cancer. Semin Oncol 26 (5 Suppl 15):2–8 [PubMed] [Google Scholar]
- Bradford MM. (1976) A rapid and sensitive method for the quantitation of microgram quantities of protein utilizing the principle of protein-dye binding. Anal Biochem 72:248–254 [DOI] [PubMed] [Google Scholar]
- Cao W, Sohn UD, Bitar KN, Behar J, Biancani P, Harnett KM. (2003) MAPK mediates PKC-dependent contraction of cat esophageal and lower esophageal sphincter circular smooth muscle. Am J Physiol Gastrointest Liver Physiol 285:G86–G95 [DOI] [PubMed] [Google Scholar]
- Chandrakesan P, Ahmed I, Anwar T, Wang Y, Sarkar S, Singh P, Peleg S, Umar S. (2010) Novel changes in NF-κB activity during progression and regression phases of hyperplasia: role of MEK, ERK, and p38. J Biol Chem 285:33485–33498 [DOI] [PMC free article] [PubMed] [Google Scholar]
- De Bosscher K, Vanden Berghe W, Haegeman G. (2006) Cross-talk between nuclear receptors and nuclear factor kappaB. Oncogene 25:6868–6886 [DOI] [PubMed] [Google Scholar]
- Farhadi A, Fields J, Banan A, Keshavarzian A. (2002) Reactive oxygen species: are they involved in the pathogenesis of GERD, Barrett's esophagus, and the latter's progression toward esophageal cancer? Am J Gastroenterol 97:22–26 [DOI] [PubMed] [Google Scholar]
- Flohé L, Brigelius-Flohé R, Saliou C, Traber MG, Packer L. (1997) Redox regulation of NF-kappa B activation. Free Radic Biol Med 22:1115–1126 [DOI] [PubMed] [Google Scholar]
- Fu X, Beer DG, Behar J, Wands J, Lambeth D, Cao W. (2006) cAMP-response element-binding protein mediates acid-induced NADPH oxidase NOX5-S expression in Barrett esophageal adenocarcinoma cells. J Biol Chem 281:20368–20382 [DOI] [PubMed] [Google Scholar]
- Gioeli D, Mandell JW, Petroni GR, Frierson HF, Jr, Weber MJ. (1999) Activation of mitogen-activated protein kinase associated with prostate cancer progression. Cancer Res 59:279–284 [PubMed] [Google Scholar]
- Greten FR, Eckmann L, Greten TF, Park JM, Li ZW, Egan LJ, Kagnoff MF, Karin M. (2004) IKKbeta links inflammation and tumorigenesis in a mouse model of colitis-associated cancer. Cell 118:285–296 [DOI] [PubMed] [Google Scholar]
- Haggitt RC. (1994) Barrett's esophagus, dysplasia, and adenocarcinoma. Hum Pathol 25:982–993 [DOI] [PubMed] [Google Scholar]
- Hong J, Behar J, Wands J, Resnick M, Wang LJ, Delellis RA, Lambeth D, Cao W. (2010a) Bile acid reflux contributes to development of esophageal adenocarcinoma via activation of phosphatidylinositol-specific phospholipase Cgamma2 and NADPH oxidase NOX5-S. Cancer Res 70:1247–1255 [DOI] [PMC free article] [PubMed] [Google Scholar]
- Hong J, Behar J, Wands J, Resnick M, Wang LJ, DeLellis RA, Lambeth D, Souza RF, Spechler SJ, Cao W. (2010b) Role of a novel bile acid receptor TGR5 in the development of oesophageal adenocarcinoma. Gut 59:170–180 [DOI] [PMC free article] [PubMed] [Google Scholar]
- Hong J, Resnick M, Behar J, Wands J, Delellis RA, Cao W. (2011) Role of RAC1 in regulation of NOX5-S function in Barrett's esophageal adenocarcinoma cells. Am J Physiol Cell Physiol 301:C413–C420 [DOI] [PMC free article] [PubMed] [Google Scholar]
- Hong J, Resnick M, Behar J, Wang LJ, Wands J, DeLellis RA, Souza RF, Spechler SJ, Cao W. (2010c) Acid-induced p16 hypermethylation contributes to development of esophageal adenocarcinoma via activation of NADPH oxidase NOX5-S. Am J Physiol Gastrointest Liver Physiol 299:G697–G706 [DOI] [PMC free article] [PubMed] [Google Scholar]
- Hoshino R, Chatani Y, Yamori T, Tsuruo T, Oka H, Yoshida O, Shimada Y, Ari-i S, Wada H, Fujimoto J, et al. (1999) Constitutive activation of the 41-/43-kDa mitogen-activated protein kinase signaling pathway in human tumors. Oncogene 18:813–822 [DOI] [PubMed] [Google Scholar]
- Howe HL, Wingo PA, Thun MJ, Ries LA, Rosenberg HM, Feigal EG, Edwards BK. (2001) Annual report to the nation on the status of cancer (1973 through 1998), featuring cancers with recent increasing trends. J Natl Cancer Inst 93:824–842 [DOI] [PubMed] [Google Scholar]
- Hughes SJ, Nambu Y, Soldes OS, Hamstra D, Rehemtulla A, Iannettoni MD, Orringer MB, Beer DG. (1997) Fas/APO-1 (CD95) is not translocated to the cell membrane in esophageal adenocarcinoma. Cancer Res 57:5571–5578 [PubMed] [Google Scholar]
- Karin M. (2006) Nuclear factor-kappaB in cancer development and progression. Nature 441:431–436 [DOI] [PubMed] [Google Scholar]
- Karin M, Cao Y, Greten FR, Li ZW. (2002) NF-kappaB in cancer: from innocent bystander to major culprit. Nat Rev Cancer 2:301–310 [DOI] [PubMed] [Google Scholar]
- Kim R, Weissfeld JL, Reynolds JC, Kuller LH. (1997) Etiology of Barrett's metaplasia and esophageal adenocarcinoma. Cancer Epidemiol Biomarkers Prev 6:369–377 [PubMed] [Google Scholar]
- Kumar B, Koul S, Khandrika L, Meacham RB, Koul HK. (2008) Oxidative stress is inherent in prostate cancer cells and is required for aggressive phenotype. Cancer Res 68:1777–1785 [DOI] [PubMed] [Google Scholar]
- Lagergren J, Bergström R, Lindgren A, Nyrén O. (1999) Symptomatic gastroesophageal reflux as a risk factor for esophageal adenocarcinoma. N Engl J Med 340:825–831 [DOI] [PubMed] [Google Scholar]
- Lambeth JD. (2004) NOX enzymes and the biology of reactive oxygen. Nat Rev Immunol 4:181–189 [DOI] [PubMed] [Google Scholar]
- Nishimoto S, Nishida E. (2006) MAPK signalling: ERK5 versus ERK1/2. EMBO Rep 7:782–786 [DOI] [PMC free article] [PubMed] [Google Scholar]
- Ohshima H, Tatemichi M, Sawa T. (2003) Chemical basis of inflammation-induced carcinogenesis. Arch Biochem Biophys 417:3–11 [DOI] [PubMed] [Google Scholar]
- Olyaee M, Sontag S, Salman W, Schnell T, Mobarhan S, Eiznhamer D, Keshavarzian A. (1995) Mucosal reactive oxygen species production in oesophagitis and Barrett's oesophagus. Gut 37:168–173 [DOI] [PMC free article] [PubMed] [Google Scholar]
- Pikarsky E, Porat RM, Stein I, Abramovitch R, Amit S, Kasem S, Gutkovich-Pyest E, Urieli-Shoval S, Galun E, Ben-Neriah Y. (2004) NF-kappaB functions as a tumour promoter in inflammation-associated cancer. Nature 431:461–466 [DOI] [PubMed] [Google Scholar]
- Pohl H, Welch HG. (2005) The role of overdiagnosis and reclassification in the marked increase of esophageal adenocarcinoma incidence. J Natl Cancer Inst 97:142–146 [DOI] [PubMed] [Google Scholar]
- Shih VF, Tsui R, Caldwell A, Hoffmann A. (2011) A single NFêB system for both canonical and non-canonical signaling. Cell Res 21:86–102 [DOI] [PMC free article] [PubMed] [Google Scholar]
- Si J, Fu X, Behar J, Wands J, Beer DG, Souza RF, Spechler SJ, Lambeth D, Cao W. (2007) NADPH oxidase NOX5-S mediates acid-induced cyclooxygenase-2 expression via activation of NF-kappaB in Barrett's esophageal adenocarcinoma cells. J Biol Chem 282:16244–16255 [DOI] [PubMed] [Google Scholar]
- Sihvo EI, Ruohtula T, Auvinen MI, Koivistoinen A, Harjula AL, Salo JA. (2003) Simultaneous progression of oxidative stress and angiogenesis in malignant transformation of Barrett esophagus. J Thorac Cardiovasc Surg 126:1952–1957 [DOI] [PubMed] [Google Scholar]
- Souza RF, Shewmake K, Pearson S, Sarosi GA, Jr, Feagins LA, Ramirez RD, Terada LS, Spechler SJ. (2004) Acid increases proliferation via ERK and p38 MAPK-mediated increases in cyclooxygenase-2 in Barrett's adenocarcinoma cells. Am J Physiol Gastrointest Liver Physiol 287:G743–G748 [DOI] [PubMed] [Google Scholar]
- Souza RF, Shewmake K, Terada LS, Spechler SJ. (2002) Acid exposure activates the mitogen-activated protein kinase pathways in Barrett's esophagus. Gastroenterology 122:299–307 [DOI] [PubMed] [Google Scholar]
- Suh YA, Arnold RS, Lassegue B, Shi J, Xu X, Sorescu D, Chung AB, Griendling KK, Lambeth JD. (1999) Cell transformation by the superoxide-generating oxidase Mox1. Nature 401:79–82 [DOI] [PubMed] [Google Scholar]
- Tanaka S, Chu S, Hirokawa M, Montrose MH, Kaunitz JD. (2003) Direct measurement of acid permeation into rat oesophagus. Gut 52:775–783 [DOI] [PMC free article] [PubMed] [Google Scholar]
- Wetscher GJ, Hinder RA, Klingler P, Gadenstatter M, Perdikis G, Hinder PR. (1997) Reflux esophagitis in humans is a free radical event. Dis Esophagus 10:29–32; discussion 33 [DOI] [PubMed] [Google Scholar]
- Wild CP, Hardie LJ. (2003) Reflux, Barrett's oesophagus and adenocarcinoma: burning questions. Nat Rev Cancer 3:676–684 [DOI] [PubMed] [Google Scholar]


