

Abstract
Comparative-omics will identify a multitude of markers that can be used for intraspecific discrimination between strains of bacteria. It seems intuitive that with this plethora of markers we can construct higher resolution subtyping assays using discrete markers to define strain “barcodes.” Unfortunately, with each new marker added to an assay, overall assay robustness declines because errors are compounded exponentially. For example, the difference in accuracy of strain classification for an assay with 60 markers will change from 99.9% to 54.7% when average probe accuracy declines from 99.999% to 99.0%. To illustrate this effect empirically, we constructed a 19 probe bead-array for subtyping Listeria monocytogenes and showed that despite seemingly reliable individual probe accuracy (>97%), our best classification results at the strain level were <75%. A more robust strategy would use as few markers as possible to achieve strain discrimination. Consequently, we developed two variable number of tandem repeat (VNTR) assays (Vibrio parahaemolyticus and L. monocytogenes) and demonstrate that these assays along with a published assay (Salmonella enterica) produce robust results when products were machine scored. The discriminatory ability with four to seven VNTR loci was comparable to pulsed-field gel electrophoresis. Passage experiments showed some instability with ca. 5% of passaged lines showing evidence for new alleles within 30 days (V. parahaemolyticus and S. enterica). Changes were limited to a single locus and allele so conservative rules can be used to determine strain matching. Most importantly, VNTRs appear robust and portable and can clearly discriminate between strains with relatively few loci thereby limiting effects of compounding error.
Introduction
Pathogen subtyping is used to match clonal isolates during disease outbreak investigations and to assist with studying the phylogeny and molecular epidemiology of pathogens (Sukhnanand et al., 2005). Pulsed-field gel electrophoresis (PFGE) remains the “gold standard” for subtyping bacteria because this method is robust and portable to different labs. PFGE data is not very useful, however, for high sample throughput and fine resolution analysis of genetic relationships between strains (Davis et al., 2003), and in some cases PFGE is unable to clearly distinguish between closely related strains (Hedberg et al., 2001; Olson et al., 2007). Consequently, there is considerable interest in developing high sample throughput and high marker throughput systems for subtyping bacteria in a cost-effective and portable manner that will also serve both the needs of strain matching and analysis of genetic relationships (Call, 2005). As described below, assays of this nature frequently identify discrete markers whereby the presence and absence of different combinations of markers can be used to distinguish between strains of bacteria. Ideally, such methods could provide the equivalent of a digital DNA “barcode” to distinguish between strains where the barcode might be represented by the presence or absence of polymorphic alleles or identify specific alleles for a given locus (e.g., “013010210”) (Srinivasan et al., 2007).
The purpose of the present study is not to review the primary advantages and disadvantages of different subtyping methods (e.g., Borucki et al., 2004; Foley et al. 2006). Instead, our objective is to critically examine the feasibility of barcoding bacteria and to examine the sensitivity of this strategy to classification errors that can arise when characterizing any organism based on multiple, discrete traits. These traits or markers might be the products of different “-omics” databases including genetic, transcriptional, or metabolic information. The present analysis focuses on genetic markers, specifically ones that rely on polymerase chain reaction (PCR) with subsequent detection using flow-cytometry (bead-arrays) (Borucki et al., 2005) or electrophoresis (variable number of tandem repeats [VNTRs]) (Lindstedt et al., 2003). We demonstrate that conventional expectations for assay performance (e.g., >95% classification accuracy) will be very difficult to achieve because compounding error is a deterministic limitation when discrete traits are treated independently. Hybridization methods are more prone to the limitations of compounding error, but machine-scored VNTRs appear very promising both because of potentially greater accuracy in scoring and the need for fewer markers to distinguish strains.
Materials and Methods
Development of a bead-array for Listeria monocytogenes
To assess effects of compounding error on a hybridization-based subtyping system, we developed a modest bead-array (19 probes) for sub-typing L. monocytogenes. See Ducey et al. (2007) for a description of a more extensive bead-array for this pathogen. The general work flow for this assay involves isolation of DNA from strains of L. monocytogenes, multiplex PCR amplification of six genetic loci, biotinylation of amplification products, and then hybridization of these products to a suspension of microsphere beads. Each bead is color coded to correspond to a specific probe sequence (conjugated oligonucleotide probe) that represents a recognized DNA polymorphism within the genetic locus. After hybridization to the beads, biotinylated products are subsequently labeled with a fluorophore and a two-laser flow-cytometer is used to digitally quantify the presence of the different markers. In practice, this analysis produces a string of binary results where “0” represents absence of a marker and “1” represents presence of a given marker. See Supplemental Data (www.liebertpub.com/fpd) for more detailed methods for this assay.
Development of VNTR assays and PFGE
VNTRs are composed of short units of DNA that are repeated sequentially (chromosomal or plasmid). Strand slippage during DNA replication results in either an increase or decrease in the number of repeated units (Taylor and Breden, 2000) and thus produces length polymorphisms that can be treated as “alleles.” PCR primers are designed to flank the variable length region so that length polymorphisms can be detected using electrophoresis. VNTR loci were identified for V. parahemolyticus by using the program Tandem Repeats Finder (ver. 4.0) (Benson, 1999) with genome sequences that are available for strains RIMD 2210633 and AQ3810. Flanking PCR primers were designed using Primer3 (v. 0.3.0) (Rozen and Skaletsky, 2000). For simplicity, seven VNTRs were selected for analysis and independent PCR amplifications were used for each VNTR. Reaction mixtures were identical for each primer set (25 μL total volume, 2.5 mM MgCl2, 400 nM each primer, 200 nM of each dNTP, 1 unit Taq polymerase (Fisher Scientific, Pittsburgh, PA) and accompanying buffer (1×), and DNA template (1 μL). Template was prepared as a boiled lysate from a single agar plate colony using 100 μl TE (see media description below) (Gussow and Clackson, 1989). Thermal-cycler conditions included 5 minutes at 94°C followed by 35 cycles including 94°C for 15 seconds, 55°C for 30 seconds, and 72°C for 30 seconds with a 7 minute post-cycle incubation at 72°C.
Conventional scoring was conducted using electrophoresis with a 2.0% SeaKem agarose gel (Cambrex Bio Science, Rockland, ME) in 0.5 × TBE for 1.5 hours at 100 V. A 20-bp molecular ladder (Bio-Rad, Hercules, CA) was included with each gel. Agarose gels were stained with ethidium bromide, and Bionumerics software (v. 3.5; Applied Maths, Sint-Martens-Latem, Belgium) was used to estimate band sizes and the number of repeat units, accordingly. A single primer from each set was also conjugated with a fluorophore (5-prime) (Applied Biosystems, Foster City, CA) and PCR product sizes were estimated using an ABI 3730 Genetic Analyzer (Applied Biosystems) with the internal size standard GeneScan™-600 LIZ (Applied Biosystems). Trace files from the ABI 3730 (Center for Reproductive Biology, Washington State University, Pullman, WA) were analyzed using GeneMarker 1.7 (SoftGenetics, College Station, PA).
PFGE was used to fingerprint V. parahaemolyticus isolates. Our procedures were identical to Parsons et al. (2007) with the following exceptions. We used 30 units NotI per plug slice (New England BioLabs Inc., Ipswich, MA) and electrophoresis conditions were 6 V/cm at 14°C for 18 hours and initial and final switch times were 2 and 40 seconds, respectively. We also used a different sizing standard (Lambda ladder; Bio-Rad). After electrophoresis, gels were stained with ethidium bromide, photographed, and scored using Bionumerics software.
A VNTR assay was also developed for L. monocytogenes (see Murphy et al. [2007] for additional VNTR loci for this organism). Identical procedures (see above) were used to identify VNTR loci based on whole genome sequences for strains EGD-e (serovar 1/2a) and F2365 (serovar 4b). PCR conditions were identical for each primer set and included 25 μL total volume, 2.0 mM MgCl2, 200 nM each primer, 200 nM of each dNTP, 1.25 units Taq polymerase (JumpStart Taq Antibody, Sigma-Aldrich, St. Louis, MO) and accompanying buffer (1×), and gDNA template (10–20 ng). Template was prepared using a commercial extraction kit (DNeasy kit, Qiagen, Valencia, CA). Thermalcycler conditions included 2 minutes at 94°C followed by 35 cycles including 94°C for 15 seconds, 55°C for 15 seconds, and 72°C for 15 seconds with a 7-minute post-cycle incubation at 72°C. Primer sets were used in independent reactions. PCR products were sized using an ABI 3730 Genetic Analyzer and trace files were processed as described above.
PFGE was used to fingerprint L. monocytogenes using a published protocol (Graves and Swaminathan, 2001) with the AscI restriction enzyme (New England Biolabs) and the XbaI-digested standard isolate S. enterica serovar Braenderup H9812 as a size standard (Ribot et al., 2006). A multiplex VNTR assay was implemented for S. enterica serovar Typhimurium using published protocols (Lindstedt et al., 2003, 2004) and the Salmonella PFGE protocol followed the methods of Ribot et al. (2006) with XbaI restriction enzyme (Fermentas, Glen Burnie, MD) and the S. enterica serovar Braenderup H9812 size standard. L. monocytogenes and S. enterica VNTR and PFGE results were analyzed as described above.
Passage experiments
To assess stability of VNTR markers, we conducted passage experiments over a 30-day period. A single colony for each strain was dispersed in 3% NaCl-TSB broth (V. parahaemolyticus strains VP155 and F113A) or BHI broth (for L. monocytogenes strains TS23 and TS25, and S. enterica strains S8824 and S14175) and spread on corresponding agar plates. Isolated colonies were hand-picked into 96-well plates (one colony per well with one blank well contamination control). Each well contained 200 μL of media (as above) and plates were incubated at 37°C for 22–26 hours. Aliquots from each well were then transferred into 200 μL broth within new plates using either pipets (1 μL) or a 96-well pin replicator (ca. 1–2 μL) followed by 22–26 hour incubation and transferred again for a total of 30 passages. After every five passages, plates from overnight cultures were augmented with 50% glycerol and stored at −80°C. The final plate was tested with VNTR assays where more than one product indicated occurrence of a mutation at a VNTR locus. In these instances, we retrieved banked plates to determine the approximate time at which new VNTR “alleles” arose within a given culture.
Results
Listeria monocytogenes bead-array
We tested two panels of L. monocytogenes isolates using the bead-array. The first panel consisted of 55 strains of L. monocytogenes collected from diverse sources (Suppl. Table S1).PCR products were generated for six loci (Suppl. Table S2)and were subsequently hybridized to 23 oligonucleotide conjugated beads (Suppl. Table S3).Several sequence polymorphisms were indistinguishable by this method and thus were grouped as single markers for a total of 19 distinct markers (Table 1 and Suppl. Table S3).To determine the diagnostic specificity and sensitivity of the assay, we sequenced every locus from these strains and compared these known sequences to the bead-array hybridization results. Comparison of sequence and hybridization results showed an overall accuracy of 98.6% for the bead-array (Table 1).To generate a binary “barcode” for these isolates we combined hybridization results (presence or absence across 19 probes) and found that we were only able to accurately type 41 of 55 isolates (74.5%) across all 19 probes.
Table 1.
Probe Accuracy (Sensitivity and Specificity) Based on Hybridization to 55 Isolates of Listeria monocytogenes (LMB Numbered Isolates from Suppl. Table S3)
| Probe | Specificity (%) | Sensitivity (%) | Accuracy (%)a |
|---|---|---|---|
| L1 | 100.0 | 100.0 | 100.0 |
| L3 | 100.0 | 100.0 | 100.0 |
| EC1 | 100.0 | 100.0 | 100.0 |
| EC2 | 100.0 | 100.0 | 100.0 |
| 1/2a | 100.0 | 96.4 | 98.2 |
| 1/2b | 100.0 | 100.0 | 100.0 |
| 1/2c | 100.0 | 100.0 | 100.0 |
| 4b | 100.0 | 100.0 | 100.0 |
| ActA 1.1/1.6 | 100.0 | 100.0 | 100.0 |
| ActA 1.2/1.3 | 100.0 | 94.4 | 97.2 |
| ActA 1.5 | 100.0 | 100.0 | 100.0 |
| ActA 1.7 | 98.1 | 100.0 | 99.1 |
| ActA 1.8/1.9 | 98.1 | 100.0 | 99.1 |
| ActA 1.10 | 100.0 | 100.0 | 100.0 |
| ActA 2.1 | 88.9 | 100.0 | 94.4 |
| ActA 2.2/2.3 | 100.0 | 100.0 | 100.0 |
| ActA 2.4/2.5 | 100.0 | 98.1 | 99.1 |
| ActA 3.4 | 94.4 | 100.0 | 97.2 |
| ActA 3.5 | 77.8 | 100.0 | 88.9 |
| Mean | 97.8 | 99.4 | 98.6 |
Accuracy is the proportion of isolates correctly classified by a given probe and expressed as a percentage.
A second set of isolates (WHO panel, Suppl. Table S1)was evaluated by both hybridization and sequencing. For this group of isolates the overall accuracy of the probe set was 97.4%, but when we considered results simultaneously for all 19 loci, the overall correct classification rate was only 60.8%. This rate of correct classification dropped to 33.8% when we replicated the hybridization experiments for all 74 isolates.
Compounding error
Despite having reasonable average accuracy rates for our probe sets (>97%), when combining data across 19 probes the actual classification accuracy of the bead-array was disappointing for both panels of isolates. In retrospect, however, this result should be expected because a “barcode” treats each marker as an independent observation and thus the error for each marker is compounded. This can be expressed as
 |
where the expected percent correct classification is the product of probe accuracy (p) multiplied for each of n probes. Probe accuracy is expressed here as the proportion of correctly classified isolates for each probe. This calculation is a best-case scenario that assumes errors are independent among loci and ignores other confounding errors that can arise throughout the analytic process (Pompanon et al., 2005). Application of this equation to the empirical accuracies recorded for each of 19 probes used in the bead-array produces an expected correction classification rate of 75.8% (74.5% observed). Viewed from the perspective of compounding error, the poor classification power of our bead-array was quite close to the expected values (Table 2).
Table 2.
Actual and Expected Correct Classification Rates for Listeria monocytogenes Strains Based on 19 Loci Typed Using a Hybridization-Based Bead-Array
| Isolate panel | No. strains | Probe accuracy (%)a | % Correctly classified (expected %)b | % Correct with replicates (expected %)c |
|---|---|---|---|---|
| LMB-WSU | 55 | 98.6 | 74.5 (75.8) | nd (57.4) |
| WHO | 74 | 97.4 | 60.8 (59.8) | 33.8 (35.8) |
Average proportion of isolates correctly classified based on probe hybridization results when compared to sequence data (Table 1).
Correct classification is the percentage of isolates for which all 19 loci were correctly typed by bead-array. The expected correct classification rate is the product of the proportion of correct classification for each probe multiplied together.
Percentage of isolates correctly classified for replicate experiments. The expected value is the proportion of correct classifications from the previous column raised to the power of two and expressed as a percentage.
The effect of compounding error can be quite dramatic (Fig. 1). With only 20 probes a seemingly small reduction in probe accuracy from 99.74% to 96.59% can reduce the correct classification rate on a per-isolate basis from 95% to 50%. Note that the results shown in Fig. 1 assume that all probes perform with equal levels of accuracy. If accuracy varies between probes (i.e., σ2 > 0) then the rate of accuracy will be lower than shown. Thus, even relatively negligible and realistic error rates at the level of individual probes will translate into significant loss of accuracy in strain classification, and this effect becomes exponentially more severe with increasing numbers of probes.
FIG. 1.
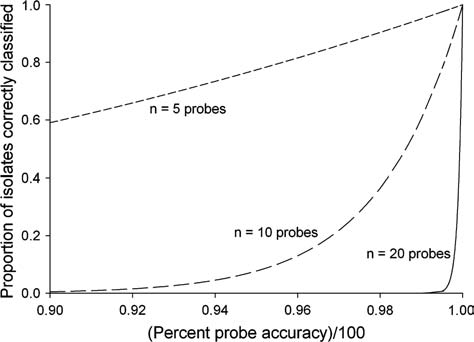
Expected proportion of correctly classified strains where assays consist of 5, 10, or 20 probes and assuming probes are independent and accuracy estimates are equal between all probes. For example, when probe accuracy is 95% for each of 20 probes, the expected proportion of correctly classified strains will be 36%. When probe accuracy differs between probes (σ2 > 0), then the actual correct classification rate will be less than shown in this figure.
Variable number of tandem repeats
Available algorithms made it relatively simple to identify potential VNTR loci and to then develop PCR assays to assess the variability of the markers (Table 3).For V. parahaemolyticus we tested 16 VNTR loci and found seven to be acceptable based on observable variation and ability to amplify a product for most strains tested. For L. monocytogenes we tested eight VNTR loci and found four to be acceptable based on these criteria.
Table 3.
Variable Number of Tandem Repeat (VNTR) Loci Developed or Tested in This Study
| Locus namea | Consensus pattern | Primer IDb | Tm | Primer sequence | Size (bp)c |
|---|---|---|---|---|---|
| VPTR1 | ATGGTCATGGCCGTCATCATC | VPTR1-L (NED) | 60.1 | GAAAGCGATATTGCACGGTA | 179 |
| VPTR1-R | 59.7 | TCATGTTGAACACTCGCTTG | |||
| VPTR7 | ATAATTAAAACCG | VPTR7-L (VIC) | 59.7 | AAATTGAGTTCCTGCAACGA | 114 |
| VPTR7-R | 59.8 | GTGCGTGAAAGGTAGCAGTC | |||
| VPTR8 | AGGTTCT | VPTR8-L (PET) | 59.6 | CCAGATATGTCAGACAGTGACG | 152 |
| VPTR8-R | 61.3 | GACGCTTTCACGCCAACT | |||
| VPTR9 | ACAAGGTCAGACTCCC | VPTR9-L (6FAM) | 60.1 | TTTCCTTGTCTGGGAGACG | 134 |
| VPTR9-R | 58.6 | TTTATCCCTCATTCCACCAC | |||
| VPTR10 | TCAACTTC | VPTR10-L (VIC) | 60.4 | GGAAGACGATGTTGGTTGC | 145 |
| VPTR10-R | 59.7 | GGATTACTCAGCCGAGACG | |||
| VPTR11 | ACAAAGCAC | VPTR11-L (6FAM) | 60.1 | TTACTGAATGGAAGGCGTTG | 151 |
| VPTR11-R | 61.0 | TATCGCGAAGCAATCTCTCA | |||
| VPTR12 | TAGCTTGATAACTA | VPTR12-L (PET) | 59.9 | CGAATCGAAGACATGGGATT | 160 |
| VPTR12-R | 59.9 | TTACCAACGGCCAAGTAACC | |||
| LMTR1 | AGTACCRCCAACACC | LMTR1+ (PET) | 56.0 | AAAAGCCCCGATTGGATATG | 220 |
| LMTR1- | 56.0 | TTTTGTTGGTGGCACAGTTG | |||
| LMTR2 | ACACCAAAAGAT | LMTR2+ (NED) | 60.4 | AGTAAAAGGCATGGACTTAACGAA | 100 |
| LMTR2- | 58.8 | CTTCGTTTTACTTGGTTTTATTGGTAG | |||
| LMTR3 | TAAAACCTA | LMTR3+ (6FAM) | 61.1 | CACGTATGATCCAAATGAAGGAA | 274 |
| LMTR3- | 60.7 | TTTTGGTAATGGTTTTGCTTCTTC | |||
| LMTR8 | AACACCARKKCCARKSCCAAKWCC | LMTR8+ (6FAM) | 60.2 | TACAAGTGATTTTGCGACTGTTG | 248 |
| LMTR8- | 62.5 | TTTTGTGACTTGGCACTTCTGG | |||
| STTR3 | ACCCCGCCCGACGATAGCGGCGATGACGATGTG | STTR3-F (PET) | 57.0 | CCCCCTAAGCCCGATAATGG | 400 |
| STTR3-R | 59.6 | TGACGCCGTTGCTGAAGGTAATAA | |||
| STTR5 | CACGAC | STTR5-F (PET) | 61.7 | ATGGCGAGGCGAGCAGCAGT | 578 |
| STTR5-R | 56.9 | GGTCAGGCCGAATAGCAGGAT | |||
| STTR6 | GCAAGG | STTR6-F (6FAM) | 54.0 | TCGGGCATGCGTTGAAA | 578 |
| STTR6-R | 54.0 | CTGGTGGGGAGAATGACTGG | |||
| STTR9 | TGCGATGTC | STTR9-F (6FAM) | 60.6 | AGAGGCGCTGCGATTGACGATA | 536 |
| STTR9-R | 60.6 | CATTTTCCACAGCGGCAGTTTTTC | |||
| STTR 10pl-F (VIC) | 65.1 | CGGGCGCGGCTGGAGTATTTG | 370 | ||
| STTR10p | CCTGTT | STTR10pl-R | 66.6 | GAAGGGGCCGGGCAGAGACAGC |
VP, Vibrio parahaemolyticus; LM, Listeria monocytogenes; ST, Salmonella enterica serovar Typhimurium (Lindstedt et al., 2003, 2004).
NED, VIC, PET, and 6FAM indicate primers with 5-prime conjugated fluorophores when products were scored using an ABI 3730 Genetic Analyzer (Applied Biosystems, Foster City, CA).
Approximate size in base pairs; this will be variable between strains.
These preliminary tests were conducted using conventional gel electrophoresis to assess variation in VNTR products. VNTR loci have been scored using conventional agarose gel electrophoresis (Ablordey et al., 2005), polyacrylamide gel electrophoresis (Call and Hallett, 1998), or capillary electrophoresis systems (Lindstedt et al., 2004). Because conventional agarose gel electrophoresis would be the simplest means to score VNTRs, we conducted a blinded classification study in which two experienced practitioners were provided V. parahaemolyticus template DNA where upon they generated VNTR products and scored them using agarose electrophoresis (see Methods). For 30 isolates the percent agreement for the estimated size (number of repeats) for each locus ranged between 13.3% and 96.7%. The product of the proportion of agreement for each of these seven loci indicated that we should only expect these two individuals to generate the same VNTR classification for 0.8% of the isolates. Clearly, this is a low estimate because intensive training might improve correspondence between estimates, but we did not consider this a robust solution given the need for assay portability.
We repeated this study except product sizes were estimated using a capillary electrophoresis instrument with fluorophore-labeled products (Table 3)and internal size standards were included for each lane. With this instrumentation, we had no difficulty reproducing VNTR size estimates with 100% agreement for 30 V. parahaemolyticus isolates (Suppl. Table S4).A similar replication study was conducted with 31 L. monocytogenes isolates (Suppl. Table S5)and 38 S. enterica serovar Typhimurium isolates (Suppl. Table S6)and in both cases the machine scored the products with 100% correspondence for replicate reactions.
Relative discrimination of VNTR vs. PFGE
VNTR data can be reduced to a composite score in the form of a distance matrix needed to construct a dendrogram for comparison to PFGE data. In general we found that both PFGE and VNTR assays produced a comparable degree of discrimination for V. parahaemolyticus isolates (Fig. 2). Using a 95% threshold for identifying identical isolates, then only two strains were considered identical by PFGE (NY-3064 and CT-6636) and three strains were considered identical by VNTR (48256, B8, and 855329-2). There were a number of other VNTR pair-wise comparisons that were relatively close (ca. 93% similarity). Furthermore, there was relatively poor correspondence between PFGE and VNTR “clades.” As we did not have an objective gold standard for describing true phylogenetic relationships between these strains, it was not possible to assess the merit of relative positions of different isolates within and between clades. Matching by serovar produced mixed results.
FIG. 2.
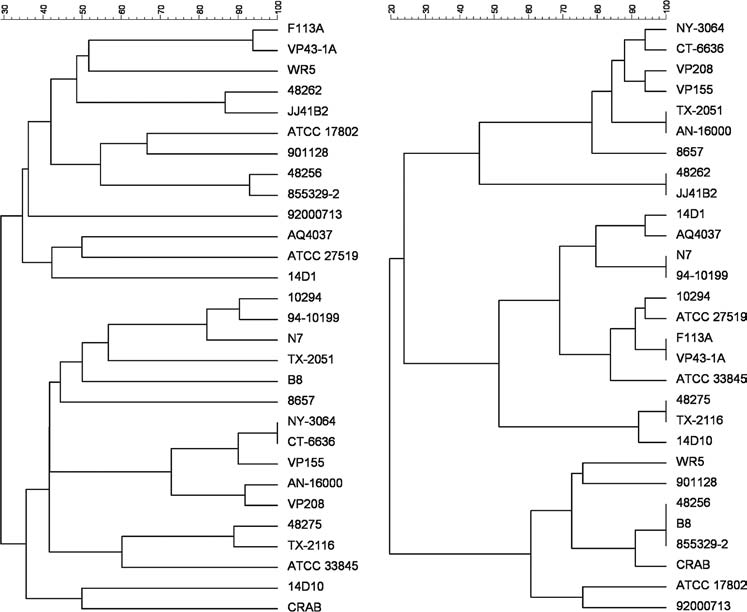
(Left) Dice coefficient based UPGMA dendrogram for NotI PFGE profiles of 29 Vibrio parahaemolyticus isolates from various sources (Table S4).(Right) Categorical coefficient based UPGMA dendrogram using data from seven variable number of tandem repeat (VNTR) loci (Table S4).Both dendrograms were generated using Bionumerics software; X-axis represents arbitrary units of genetic distance.
Our ability to discriminate L. monocytogenes strains was significantly better using PFGE, although in this case only four VNTR loci were used and this probably reflects a low number of less variable loci (Suppl. Fig. S1). Using a 95% similarity criterion for the S. enterica assays showed relatively close correspondence in the ability to discriminate isolates using either PFGE or four VNTR loci (Suppl. Fig. S2). In some cases results from the VNTR assay were more discriminatory whereas in other cases PFGE was more discriminatory. We encountered VNTR “null alleles” with several isolates (Suppl. Table S6)that may pose an analytic challenge to phylogenetic analyses. From these preliminary comparisons, it is clear that VNTR assays can provide a relatively high level of strain discrimination with as few as four loci.
Passage experiments
We investigated the stability of VNTR markers using a simple passage experiment (two strains per species) under the assumption that rapid growth occurring under idealized culture conditions over a 30-day period would over-estimate (i.e., be conservative) the mutability of these markers from a short-term perspective. We passaged 95 “lineages” for two strains of V. parahaemolyticus over the course of 30 days and six of seven VNTR loci were stable (only one allele present throughout). VPTR-8 produced two bands in four and five wells for the two strains, respectively. Retrospective testing showed that new alleles arose as early as the 15th passage to as late as the 30th passage. This experiment was not designed to estimate mutation rates, but it is clear that the rate of - mutation for VPTR-8 is more rapid compared with the other markers with 4.7% of wells showing presence of a novel allele at this locus within 30 days. No single well had more than one allele or locus change and no change was greater than one repeat unit.
Similar passage experiments with two strains of L. monocytogenes over 30 days showed that all four L. monocytogenes VNTR loci were stable (no new alleles detected). Passage of two S. enterica strains showed mixed results. One locus experienced no changes (STTR9). STTR5 was the most mutable with a new allele detected as early as the 10th passage and six wells had new alleles arise by day 30. STTR6 and STTR10pl had new alleles present by day 30 (three and one wells, respectively). STTR3 was unusual because this locus “dropped-out” at a regular rate (2.33 wells per passage) such that this locus was not detectable in 70% of wells by day 30. If we disregard the STTR3 locus, then 5.3% of wells showed the presence of a novel allele across four loci in 30 days and no well experienced more than one locus change and no change as greater than one repeat unit.
Discussion
With the explosion of “-omics” there are a multitude of opportunities to exploit novel biological markers for subtyping applications (Hadd et al., 2005). While assays that include many markers are intuitively attractive because of their potential to provide a high degree of strain discrimination, there is potential for significant limitations. When each trait is considered an independent observation that is then compiled into a string of traits (e.g., describing a barcode or haplotype), then compounding error is an incontrovertibly deterministic outcome. Unless the assay results can be very carefully controlled to yield 100% accuracy, multi-marker assays will be vulnerable to exponentially increasing classification errors (Fig. 1). Thus, the strategy of generating increasingly complex assays (i.e., adding more markers) also runs the risk of producing assays that cannot generate robust classifications, particularly when ported to multiple labs where errors can arise more easily. Pompanon et al. (2005) provide an excellent overview of a multitude of events that can introduce error in genotyping assays.
Efforts to develop more complicated subtyping assays have been successful. Ducey et al. (2007) implemented a 60 allele bead-array to subtype L. monocytogenes strains and they were able to reproducibly subtype 241 isolates with 100% repeatability. In this case, the outcome for 60 probe hybridizations produced 43 defined haplotypes. The work by Ducey et al. is an excellent example of what a high-sample and high-marker throughput assay can do when it is performed with precision. While the Ducey et al. assay relied on simple hybridization, others have combined allele-specific primer extension with bead-arrays and have reported excellent success relative to comparable assays (Taylor et al., 2001; Ye et al., 2001; Strom et al., 2006). Furthermore, adoption of standardized calibration panels can be used to limit effects of instrument variation between labs (Hanley, 2007b).
Others have reported less success with these types of assays. For example, Itoh et al. (2005) reported genotyping accuracy for four loci (48 probes) ranging between 85.03% and 97.32% when compared with 150 control samples. In our hands the overall probe accuracy of a L. monocytogenes bead-array ranged between 97.4% and 98.6%. Where discrete markers were generated by PCR, probe accuracy was highest (99.775%) whereas there was less accuracy for probes directed towards sequence polymorphisms at a single locus (actA gene, 97.727%). Others have reported good results when hybridization is directed towards very discrete markers (Srinivasan et al., 2007) and assuming this will produce the desired level of subtyping discrimination, then this could be a more robust strategy for assay development.
For bead-arrays, compounding error will limit the size of the assays provided the hybridization results are considered independent characteristics. Besides inherent variance expected when detecting sequence polymorphisms, other sources of error can be problematic including variance in bead size (Hanley et al., 2007) and bead carryover events (Hanley, 2007a). While large, multi-probe assays have been described, the largest limitation with the bead-array is that it is not possible to include quality controls for every hybridization reaction in every sample tube and therefore the quality of the data cannot be assessed independently. Thus, as the assay increases in scope, so does the likelihood that undetected errors will compound and generate significant classification errors. For example, while Ducey et al. (2007) were highly successful with their 60-bead assay, it is worth pointing out that the expected rate of correct classification drops from 99.9% to 54.7% when probe accuracy drops from 99.999% to 99.0%, respectively. We argue, therefore, that it is not reasonable to expect that a system with error sensitivity this great can be successfully ported to multiple labs.
There are other methods for analyzing multi-probe data. For example, data can be collapsed into pair-wise distance matrices and dendrograms can be constructed to show relative relationships between strains (e.g., Borucki et al., 2004). This strategy, however, requires threshold decisions to discriminate strains and results for any single isolate have to be evaluated in the context of other isolates. Statistical classification methods such as discriminant function analysis can also be used, although “training data” are needed to construct these equations and thus care is needed to represent appropriate populations and carefully considered independent data sets are needed to validate classification results and limit statistical artifacts. While these alternatives are feasible, they lack the simplicity inherent with stand-alone, discrete genotyping “barcodes” that are theoretically feasible from bead-arrays, VNTRs, or multilocus sequence typing (MLST).
MLST is an alternative subtyping method that does not rely on a priori knowledge of sequence polymorphisms and every reaction has a built-in quality control system because the practitioner can review the sequence trace to assess the quality of putative base changes. MLST is, however, more expensive than some alternatives (Ducey et al., 2007) and because housekeeping genes are used, sequence conservation can limit how well MLST can discriminate between isolates (Borucki et al., 2004).
VNTR assays offer an important alternative to constructing increasingly complex subtyping assays. VNTR loci are typically hypervariable because of DNA slippage during replication and thus they can provide high-resolution discrimination between isolates that have a relatively recent common ancestor (van Belkum et al., 1998; Vogler et al., 2006). Because fewer markers are needed to discriminate between isolates, classification by VNTRs can yield more robust and portable assays. For the examples presented herein, VNTR data appeared comparable to PFGE in the ability to discriminate between strains. VNTR data also includes more information that could be used to derive estimates of strain relationships, although differential mutation rates and non-neutral selection may limit phylogenetic inferences from VNTR data (Vogler et al., 2007).
Application of VNTR assays, of course, assumes that alleles can be scored with high accuracy. Machine-scored VNTR results are clearly very accurate as demonstrated here, although our tests screened less than 40 isolates per set of loci so we cannot provide a robust estimate of accuracy from this study. Nevertheless, the fact that machine-scored data, like MLST assays, also provide a trace file means that the practitioner has some ability to assess the quality of product size estimates. The fact that we were able to successfully apply a published VNTR assay (S. enterica; Lindstedt et al. 2003, 2004) is also evidence of portability of these assays. Nevertheless, there are potential difficulties with VNTR assays including presence of null alleles (no amplification products) and there is always a danger that a hypervariable marker changes so quickly that clonal lineages responsible for a disease outbreak are difficult to identify.
Our passage experiments showed some evidence for marker instability. Approximately 5% of wells had a single allele change within 30 days passage (V. parahaemolyticus and S. enterica) although our methods were only sensitive to mutations that expanded sufficiently in the population to be detected by PCR. One Salmonella locus also appeared to disappear from the passaged strains and three of four loci showed evidence for null alleles (Suppl. Table S6).Hopkins et al. (2007) compared PFGE and VNTR results from actual outbreak investigations (S. enterica serovar Typhimurium) and reported that the VNTR loci were sufficiently stable for outbreak investigations.
Conclusions
Large numbers of biological markers will be accumulated through the collective efforts of “-omics” investigations. Application of these markers for subtyping is intuitively appealing, but compounding error is an incontrovertibly deterministic outcome of multi-marker assays. Besides employing methods that minimize error and permit quality control checks, the most prudent approach to designing robust subtyping assays is to minimize the number of markers that are used. Under this constraint, VNTRs appear to be a suitable means to attain a high degree of genetic discrimination with the smallest number of markers.
Supplementary Material
Acknowledgements
Katie Baker and Deborah Duricka provided technical assistance. Todd Ward and Monica Borucki reviewed an earlier version of this manuscript. Asim Bej and Kathryn Boor provided V. parahaemolyticus isolates used in this study. This project was funded in part by the National Institute of Allergy and Infectious Diseases, National Institutes of Health, Department of Health and Human Services, under contract no. N01-AI-30055, and by the Agricultural Animal Health Program and Washington State University.
References
- Ablordey A. Swings J. Hubans C. Chemlal K. Locht C. Portaels F. Supply P. Multilocus variable-number tandem repeat typing of Mycobacterium ulcerans. J. Clin. Microbiol. 2005;43:1546–1551. doi: 10.1128/JCM.43.4.1546-1551.2005. [DOI] [PMC free article] [PubMed] [Google Scholar]
- Benson G. Tandem repeats finder: a program to analyze DNA sequences. Nucleic Acids Res. 1999;27:573–580. doi: 10.1093/nar/27.2.573. [DOI] [PMC free article] [PubMed] [Google Scholar]
- Borucki MK. Kim SH. Call DR. Smole SC. Pagotto F. Selective discrimination of Listeria monocytogenes epidemic strains by a mixed-genome DNA microarray compared to discrimination by pulsed-field gel electrophoresis, ribotyping, and multilocus sequence typing. J. Clin. Microbiol. 2004;42:5270–5276. doi: 10.1128/JCM.42.11.5270-5276.2004. [DOI] [PMC free article] [PubMed] [Google Scholar]
- Borucki MK. Reynolds J. Call DR. Ward TJ. Page B. Kadushin J. Suspension microarray with dendrimer signal amplification allows direct and high-throughput subtyping of Listeria monocytogenes from genomic DNA. J. Clin. Microbiol. 2005;43:3255–3259. doi: 10.1128/JCM.43.7.3255-3259.2005. [DOI] [PMC free article] [PubMed] [Google Scholar]
- Call DR. Challenges and opportunities for pathogen detection using DNA microarrays. Crit. Rev. Microbiol. 2005;31:91–99. doi: 10.1080/10408410590921736. [DOI] [PubMed] [Google Scholar]
- Call DR. Hallett JG. PCR primers for microsatellite loci in the anurans Rana luteiventris and Hyla regilla. Mol. Ecol. 1998;7:1085–1087. [PubMed] [Google Scholar]
- Davis MA. Hancock DD. Besser TE. Call DR. Evaluation of pulsed-field gel electrophoresis as a tool for determining the degree of genetic relatedness between strains of Escherichia coli O157:H7. J. Clin. Microbiol. 2003;41:1843–1849. doi: 10.1128/JCM.41.5.1843-1849.2003. [DOI] [PMC free article] [PubMed] [Google Scholar]
- Ducey TF. Page B. Usgaard T. Borucki MK. Pupedis K. Ward TJ. A single-nucleotide-polymorphism-based multilocus genotyping assay for subtyping lineage I isolates of Listeria monocytogenes. Appl. Environ. Microbiol. 2007;73:133–147. doi: 10.1128/AEM.01453-06. [DOI] [PMC free article] [PubMed] [Google Scholar]
- Foley SL. White DG. McDermott PF. Walker RD. Rhodes B. Fedorka-Cray PJ. Simjee S. Zhao S. Comparison of subtyping methods for differentiating Salmonella enterica serovar Typhimurium isolates obtained from food animal sources. J. Clin. Microbiol. 2006;44:3569–3577. doi: 10.1128/JCM.00745-06. [DOI] [PMC free article] [PubMed] [Google Scholar]
- Graves LM. Swaminathan B. PulseNet standardized protocol for subtyping Listeria monocytogenes by macro-restriction and pulsed-field gel electrophoresis. Int. J. Food Microbiol. 2001;65:55–62. doi: 10.1016/s0168-1605(00)00501-8. [DOI] [PubMed] [Google Scholar]
- Gussow D. Clackson T. Direct clone characterization from plaques and colonies by the polymerase chain reaction. Nucleic Acids Res. 1989;17:4000. doi: 10.1093/nar/17.10.4000. [DOI] [PMC free article] [PubMed] [Google Scholar]
- Hadd AG. Brown JT. Andruss BF. Ye F. Walker-Peach CR. Adoption of array technologies into the clinical laboratory. Expert Rev. Mol. Diagn. 2005;5:409–420. doi: 10.1586/14737159.5.3.409. [DOI] [PubMed] [Google Scholar]
- Hanley B. Variance in multiplex suspension array assays: carryover of microspheres between sample wells. J. Negat. Results Biomed. 2007a;6:6. doi: 10.1186/1477-5751-6-6. [DOI] [PMC free article] [PubMed] [Google Scholar]
- Hanley B. Variance in multiplex suspension array assays: intraplex method improves reliability. Theor. Biol. Med. Model. 2007b;4:32. doi: 10.1186/1742-4682-4-32. [DOI] [PMC free article] [PubMed] [Google Scholar]
- Hanley BP. Xing L. Cheng RH. Variance in multiplex suspension array assays: microsphere size variation impact. Theor. Biol. Med. Model. 2007;4:31. doi: 10.1186/1742-4682-4-31. [DOI] [PMC free article] [PubMed] [Google Scholar]
- Hedberg CW. Smith KE. Besser JM. Boxrud DJ. Hennessy TW. Bender JB. Anderson FA. Osterholm MT. Limitations of pulsed-field gel electrophoresis for the routine surveillance of Campylobacter infections. J. Infect. Dis. 2001;184:242–244. doi: 10.1086/322005. [DOI] [PubMed] [Google Scholar]
- Hopkins KL. Maguire C. Best E. Liebana E. Threlfall EJ. Stability of multiple-locus variable-number tandem repeats in Salmonella enterica serovar typhimurium. J. Clin. Microbiol. 2007;45:3058–3061. doi: 10.1128/JCM.00715-07. [DOI] [PMC free article] [PubMed] [Google Scholar]
- Itoh Y. Mizuki N. Shimada T. Azuma F. Itakura M. Kashiwase K. Kikkawa E. Kulski JK. Satake M. Inoko H. High-throughput DNA typing of HLA-A, -B, -C, and -DRB1 loci by a PCR-SSOP-Luminex method in the Japanese population. Immunogenetics. 2005;57:717–729. doi: 10.1007/s00251-005-0048-3. [DOI] [PubMed] [Google Scholar]
- Lindstedt BA. Heir E. Gjernes E. Kapperud G. DNA fingerprinting of Salmonella enterica subsp. enterica serovar typhimurium with emphasis on phage type DT104 based on variable number of tandem repeat loci. J. Clin. Microbiol. 2003;41:1469–1479. doi: 10.1128/JCM.41.4.1469-1479.2003. [DOI] [PMC free article] [PubMed] [Google Scholar]
- Lindstedt BA. Vardund T. Aas L. Kapperud G. Multiple-locus variable-number tandem-repeats analysis of Salmonella enterica subsp. enterica serovar Typhimurium using PCR multiplexing and multicolor capillary electrophoresis. J. Microbiol. Methods. 2004;59:163–172. doi: 10.1016/j.mimet.2004.06.014. [DOI] [PubMed] [Google Scholar]
- Murphy M. Corcoran D. Buckley JF. O'Mahony M. Whyte P. Fanning S. Development and application of multiple-locus variable number of tandem repeat analysis ( MLVA) to subtype a collection of Listeria monocytogenes. Int. J. Food Microbiol. 2007;115:187–194. doi: 10.1016/j.ijfoodmicro.2006.10.022. [DOI] [PubMed] [Google Scholar]
- Olson AB. Andrysiak AK. Tracz DM. Guard-Bouldin J. Demczuk W. Ng LK. Maki A. Jamieson F. Gilmour MW. Limited genetic diversity in Salmonella enterica serovar Enteritidis PT13. BMC Microbiol. 2007;7:87. doi: 10.1186/1471-2180-7-87. [DOI] [PMC free article] [PubMed] [Google Scholar]
- Parsons MB. Cooper KL. Kubota KA. Puhr N. Simington S. Calimlim PS. Schoonmaker-Bopp D. Bopp C. Swaminathan B. Gerner-Smidt P. Ribot EM. PulseNet USA standardized pulsed-field gel electrophoresis protocol for subtyping of Vibrio parahaemolyticus. Foodborne Pathog. Dis. 2007;4:285–292. doi: 10.1089/fpd.2007.0089. [DOI] [PubMed] [Google Scholar]
- Pompanon F. Bonin A. Bellemain E. Taberlet P. Genotyping errors: causes, consequences and solutions. Nat. Rev. Genet. 2005;6:847–859. doi: 10.1038/nrg1707. [DOI] [PubMed] [Google Scholar]
- Ribot EM. Fair MA. Gautom R. Cameron DN. Hunter SB. Swaminathan B. Barrett TJ. Standardization of pulsed-field gel electrophoresis protocols for the subtyping of Escherichia coli O157:H7, Salmonella, and Shigella for PulseNet. Foodborne Pathog. Dis. 2006;3:59–67. doi: 10.1089/fpd.2006.3.59. [DOI] [PubMed] [Google Scholar]
- Rozen S. Skaletsky H. Primer3 on the WWW for general users and for biologist programmers. Methods Mol. Biol. 2000;132:365–386. doi: 10.1385/1-59259-192-2:365. [DOI] [PubMed] [Google Scholar]
- Srinivasan U. Zhang L. France AM. Ghosh D. Shalaby W. Xie J. Marrs CF. Foxman B. Probe hybridization array typing: a binary typing method for Escherichia coli. J. Clin. Microbiol. 2007;45:206–214. doi: 10.1128/JCM.01543-06. [DOI] [PMC free article] [PubMed] [Google Scholar]
- Strom CM. Janeszco R. Quan F. Wang SB. Buller A. McGinniss M. Sun W. Technical validation of a TM Biosciences Luminex-based multiplex assay for detecting the American College of Medical Genetics recommended cystic fibrosis mutation panel. J. Mol. Diagn. 2006;8:371–375. doi: 10.2353/jmoldx.2006.050115. [DOI] [PMC free article] [PubMed] [Google Scholar]
- Sukhnanand S. Alcaine S. Warnick LD. Su WL. Hof J. Craver MP. McDonough P. Boor KJ. Wiedmann M. DNA sequence-based subtyping and evolutionary analysis of selected Salmonella enterica serotypes. J. Clin. Microbiol. 2005;43:3688–3698. doi: 10.1128/JCM.43.8.3688-3698.2005. [DOI] [PMC free article] [PubMed] [Google Scholar]
- Taylor JD. Briley D. Nguyen Q. Long K. Iannone MA. Li MS. Ye F. Afshari A. Lai E. Wagner M. Chen J. Weiner MP. Flow cytometric platform for high-throughput single nucleotide polymorphism analysis. Biotechniques. 2001;30:661–666. doi: 10.2144/01303dd04. 668–669. [DOI] [PubMed] [Google Scholar]
- Taylor JS. Breden F. Slipped-strand mispairing at noncontiguous repeats in Poecilia reticulata: a model for minisatellite birth. Genetics. 2000;155:1313–1320. doi: 10.1093/genetics/155.3.1313. [DOI] [PMC free article] [PubMed] [Google Scholar]
- van Belkum A. Scherer S. van Alphen L. Verbrugh H. Short-sequence DNA repeats in prokaryotic genomes. Microbiol. Mol. Biol. Rev. 1998;62:275–293. doi: 10.1128/mmbr.62.2.275-293.1998. [DOI] [PMC free article] [PubMed] [Google Scholar]
- Vogler AJ. Keys C. Nemoto Y. Colman RE. Jay Z. Keim P. Effect of repeat copy number on variable-number tandem repeat mutations in Escherichia coli O157:H7. J. Bacteriol. 2006;188:4253–4263. doi: 10.1128/JB.00001-06. [DOI] [PMC free article] [PubMed] [Google Scholar]
- Vogler AJ. Keys CE. Allender C. Bailey I. Girard J. Pearson T. Smith KL. Wagner DM. Keim P. Mutations, mutation rates, and evolution at the hypervariable VNTR loci of Yersinia pestis. Mutat. Res. 2007;616:145–158. doi: 10.1016/j.mrfmmm.2006.11.007. [DOI] [PubMed] [Google Scholar]
- Ye F. Li MS. Taylor JD. Nguyen Q. Colton HM. Casey WM. Wagner M. Weiner MP. Chen J. Fluorescent microsphere-based readout technology for multiplexed human single nucleotide polymorphism analysis and bacterial identification. Hum. Mutat. 2001;17:305–316. doi: 10.1002/humu.28. [DOI] [PubMed] [Google Scholar]
Associated Data
This section collects any data citations, data availability statements, or supplementary materials included in this article.