

Abstract
Background
The neurobiology of bulimia nervosa (BN) is poorly understood. Recent animal literature suggests that binge eating is associated with altered brain dopamine (DA) reward function. In this study we wanted to investigate DA related brain reward learning in BN.
Methods
Ill BN (n=20, age: M=25.2, SD=5.3 years) and healthy control women (CW; n=23, age: M=27.2, SD=6.4 years) underwent functional magnetic resonance brain imaging (fMRI) together with application of a DA related reward learning paradigm, the temporal difference (TD) model. That task involves association learning between conditioned visual and unconditioned taste stimuli, as well as unexpected violation of those learned associations. Study participants also completed the Sensitivity to Reward and Punishment Questionnaire (SPSRQ).
Results
BN individuals showed reduced brain response compared to CW for unexpected receipt and omission of taste stimuli, as well as reduced brain regression response to the TD computer model generated reward values, in insula, ventral putamen, amygdala and orbitofrontal cortex. Those results were qualitatively similar in BN individuals who were non-depressed and unmedicated. Binge/purge frequency in BN inversely predicted reduced TD model response. BN individuals showed significantly higher Sensitivity to Reward and Punishment compared CW.
Conclusions
This is the first study that relates reduced brain DA responses in BN to the altered learning of associations between arbitrary visual stimuli and taste rewards. This attenuated response is related to frequency of binge/purge episodes in BN. The brain DA neurotransmitter system could be an important treatment target for BN.
Keywords: Bulimia nervosa, imaging, reward, dopamine, temporal difference model, computational
Introduction
Bulimia nervosa (BN) is a severe eating disorder (ED) associated with episodic binge eating followed by extreme behaviors to avoid weight gain such as self induced vomiting, use of laxatives, or excessive exercise) (1). Individuals with BN present with fear of gaining weight, as well as food and body weight-related preoccupations, but are at normal or often high-normal weight. The pathophysiology of BN is largely unknown.
Only a few functional brain imaging studies have investigated the neurobiology of BN. One group (2) found that BN subjects demonstrated increased activity in the anterior cingulate cortex and insula in response to food images, possibly representing the increased emotional salience associated with the images. A second study explored body image perception in a small BN sample (n=9) (3); BN individuals demonstrated a reduced response in the lateral fusiform gyrus when presented with line drawings of body shapes, and such reduced responses were thought to reflect an aversion-driven restraint in brain response. A few neurotransmitter-receptor studies have been done in BN. One study reported reduced binding of [23]beta-CIT, a radiotracer that binds to brain serotonin (5HT) and dopamine (DA) transporter receptors (4). Reduced [23]beta-CIT binding in BN could be related to altered 5HT (5) or DA (6, 7) brain activity during the ill state. Another study found increased 5HT1A receptor binding in ill BN subjects (8), most prominently in prefrontal, cingulate and a parietal cortex area. This increased binding could reflect up-regulated receptor activity associated with the decrease in central 5HT function in BN (5).
The compulsive nature of binge episodes and comorbidity with substance use disorders (9) suggested that BN could at least in part share vulnerabilities and pathophysiology with substance use disorders. Substance use disorders are largely associated with abnormalities in the neural systems associated with processing salient stimuli and regulating the desire and ingestion of rewarding stimuli such as drugs or food (i.e. the reward system). The neurotransmitter system that has received the most attention in that respect is DA, partially because it is well characterized (10, 11). DA regulates the motivational aspects of the reward pathway (12) and seems to adjust to repetitive substance use with gradual desensitization and chronic dysphoria outside of times of acute use (13). Substance use disorders commonly are associated with lower DA D2/3 receptor availability (14), which has implications on reinforcement learning, reward processing, and eventually action selection (15). While DA dysfunction is commonly associated with substance abuse, there are also animal models linking the pathophysiology of binge eating to DA abnormalities. Those studies suggest withdrawal and tolerance development in the context of binge eating (16, 17), as well as DA D2 receptor reductions (18). While the animal models suggest a link between DA and BN, DA research in BN has been sparse, but there appear to be reduced DA metabolites in cerebrospinal fluid (6, 7), and reduced DA transporter availability in BN (4).
In this study we used event-related functional magnetic resonance imaging (fMRI) to investigate DA-related responding in a classical conditioning paradigm (19–21). Prior to learning, the DA system produces a phasic response to the (unexpected) unconditioned reward stimulus (US). After learning that the US is predictably preceded by a conditioned stimulus (CS), DA response transfers in time, such that it follows the CS, but no longer the US. Further, after such training, if the CS is followed by an omission of the US, a reduction in DA firing occurs at the time of the expected US. Thus brain DA response parallels the difference between the amount of reward observed, and that predicted, i.e. a reward prediction error. This type of prediction error and learning process can be characterized by a temporal difference (TD) algorithm (11). This algorithm has been explored empirically in both rodent models (21) and event-related human neuroimaging paradigms (20) and is widely thought to be a reasonable description of the learning process. The primary brain areas demonstrating responses that parallel signals produced by a TD model are the ventral striatum (VS) and midbrain (21), although the amygdala (22) and insula are also intimately involved in reward processing (23). Our goal was to test whether we would find diminished DA related taste reward processing across a large brain network that would distinguish BN from CW individuals.
Methods and Materials
Study Participants
Forty-one female study participants participated in this study (Table 1.), 20 individuals with purging type BN and 23 healthy control women (CW), matched for age and level of education. BN individuals were recruited from the Eating Disorder Center Denver. No BN subject approached for this study declined study participation. BN individuals showed typical behaviors on mood and personality measures and showed significantly greater SPSRQ Sensitivity to Punishment and Sensitivity to Reward compared to CW (Table 1.). BN fulfilled all diagnostic criteria for the disorder up to 1 week prior to the study. Study participants had no electrolyte or other lab abnormalities. Among BN individuals, 3 had a major depressive disorder (MDD) but no other comorbidity, 2 had MDD and social phobia, 1 had MDD and social phobia and generalized anxiety disorder, 2 had MDD and PTSD, 2 had MDD and generalized anxiety disorder, and 2 had social phobia without MDD. No BN subject had a substance use disorder. The study was approved by the Colorado Multiple Review Board and all subjects signed informed consent.
Table 1.
Demographic variables of study participants
| CW (n=23) | BN (n=20) | U | p | |||
|---|---|---|---|---|---|---|
| Mean | SD | Mean | SD | |||
| Age (years) | 27.2 | 6.4 | 25.2 | 5.3 | 190.5 | ns |
| Illness Duration (months) | -- | -- | 74.2 | 63.7 | -- | -- |
| Weekly Binge/Purge Episodes | -- | -- | 23.5 | 16.9 | -- | -- |
| Body Mass Index (kg/m2) | 21.5 | 1.2 | 22.6 | 5.7 | 201.0 | ns |
| Novelty Seeking (TCI) | 17.9 | 6.1 | 22.1 | 6.7 | 142.0 | 0.032 |
| Harm Avoidance (TCI) | 10.7 | 6.6 | 23.0 | 5.8 | 50.5 | <0.001 |
| Depression (BDI) | 1.0 | 1.0 | 24.5 | 11.3 | 0.0 | <0.001 |
| Drive for Thinness (EDI-3) | 2.7 | 3.5 | 23.1 | 4.5 | 1.0 | <0.001 |
| Bulimia (EDI-3) | 0.8 | 1.2 | 22.7 | 5.3 | 0.0 | <0.001 |
| Body Dissatisfaction (EDI-3) | 4.4 | 4.3 | 30.7 | 8.0 | 4.0 | <0.001 |
| Sensitivity to Reward (SPSRQ) | 8.7 | 3.8 | 12.3 | 4.5 | 122.0 | 0.008 |
| Sensitivity to Punishment (SPSRQ) | 7.6 | 5.0 | 16.1 | 4.8 | 56.0 | <0.001 |
| Pleasantness 1Molar Sucrose | 4.8 | 2.2 | 5.5 | 2.9 | 196.5 | ns |
| Sweetness 1Molar Sucrose | 8.3 | 0.8 | 8.7 | 0.6 | 180.0 | ns |
| Breakfast Calories | 511.2 | 81.3 | 473.2 | 95.3 | 188.5 | ns |
Assessment Procedures
Psychiatric diagnoses including BN, or absence of any psychiatric disorders in CW, were established by the structured clinical interview (SCID) for DSM-IV diagnoses (24) applied by a doctoral level interviewer. All participants completed the Eating Disorder Inventory-3 (25, 26), Sensitivity to Punishment and Sensitivity to Reward Questionnaire (SPSRQ) (27), Beck’s Depression Inventory (BDI) (28), and Cloninger’s Temperament and Character Inventory (TCI) (29).
Study subjects met with the principal investigator to ensure diagnosis and underwent a blinded taste test, where subjects were presented with a tray of randomly assorted small cups with 6 sucrose (Mallinckrodt Chemicals, Phillipsburg, NJ) solutions (0%-distilled water, 2%, 4%, 8%, 16% and 1Molar), as well as artificial saliva (25mM KCl, 2mM NaHCO3) (20). Study participants rated the solutions blindly for sweetness and pleasantness. This was to test taste sensitivity across groups. Taste test and brain imaging were conducted in all study participants during the first ten days of the menstrual cycle in order to keep hormonal variation low (30).
Brain Imaging Procedures
On the study day participants ate breakfast between 7.00 and 8.00 AM, BN individuals according to their meal plan, CW had breakfast matched in quality and calories to the average meal plan breakfast (Table 1.). BN individuals’ meal plan was adjusted that their morning snack after the study was less study sucrose solution calories, in order to not add anxiety. FMRI imaging was performed between 8.00 and 9.00 AM. Brain images were acquired on a GE Signa 3T scanner. T2* weighted echo-planar imaging (EPI) for blood oxygen-level dependent (BOLD) functional activity was performed, with 3.4 × 3.4 × 2.6 mm voxel size, 1.4 mm gap, TR = 2100s, TE = 30 ms, flip angle 70°, 30 slices. We also acquired structural images (T1 spoiled gradient recall, SPGR) for delineation of the brain anatomy and group comparison for anatomical differences.
Task Design
We adapted the design used by O’Doherty et al. (20). Individuals received three taste stimuli during fMRI imaging: 1M sucrose solution (100 trials), no solution (100 trials), and artificial saliva (AS, 80 trials). Individuals learned to associate each taste stimulus with a paired conditioned visual stimulus (CS) that is probabilistically associated with its US; the CS associated with no-solution (Null) appears prior to 20% of the trials in which Sucrose solution is presented as the US (US+), and vice-versa (US−). For each subject the first ten trials were CS Sucrose fractal followed by US Sucrose application, but all other trials were fully randomized. The taste stimuli were applied using a customized programmable syringe pump (J-Kem Scientific, St. Louis, MO) controlled by E-Prime Software (Psychological Software Tools, Pittsburgh, PA). Individual taste application was triggered by MRI scanner radiofrequency pulse (31). Task duration was 28 minutes.
Brain Imaging Data Analysis
Brain imaging data were preprocessed and analyzed using SPM5 software (http://www.fil.ion.ucl.ac.uk/spm/software/spm5/). Data from each subject were realigned to the first volume, normalized to the Montreal Neurological Institute template, and smoothed with a 3-mm FWHM Gaussian kernel. Each image sequence was inspected and images with artifacts or movement > one voxel size were removed. Data were modeled with a hemodynamic response function (HRF) -convolved boxcar function, using the general linear model, including temporal and dispersion derivatives. A 128-s high-pass filter was applied to remove low-frequency fluctuation in the BOLD signal. As an initial analysis, we developed first level models in which we predicted the response in each voxel as a function of each of the 5 stimulus conditions: expected Sucrose, unexpected Sucrose, expected Null, unexpected Null, and expected AS. Two contrasts of interest were computed: unexpected Sucrose minus expected Null where the visual stimulus is the same and predicts Null, but there is a positive prediction error signal at the time of the US (US+), and unexpected null minus expected Sucrose where the visual stimulus is the same and predicts Sucrose, but there is a negative prediction error signal at the time of the US (US−). Using a random effects analysis these contrasts were then compared within and across groups.
Regions of interest for extraction of region specific brain imaging data were used from the SPM5 wfupickatlas’ aal section for the insula, amygdala, lateral orbitofrontal cortex, substantia nigra, and ventral putamen. For the ventral putamen only the planes below the lateral ventricles were used as described previously (32, 33).
We further modeled each participant’s individual trial sequence using the TD algorithm (20, 21). On each trial, the predicted value (V̂) at any time (t) within a trial is calculated as a linear product of weights (wi) and the presence or absence of a CS stimulus at time t, coded in a stimulus representation vector xi(t) where each stimulus xi is represented separately at each moment in time (20):
Learning occurs by updating the predicted value of each time point t in the trial by comparing the predicted value at time t+1 to that actually observed at time t, leading to a prediction error (δ(t)):
where r(t) is the reward at time t. The parameter γ is a discount factor, which determines the extent to which rewards arriving earlier are more important than rewards that arrive later during the task. Similar to O’Doherty’s study (20), we set γ=0.99. The weights wi are then updated on a trial-by-trial basis according to the correlation between prediction error and the stimulus representation:
where α is a learning rate. We assigned six time points to each trial and used each subject’s individual event history as input. On each trial, the CS (visual fractal) is delivered at time point 1, and the US reward (taste stimulus) is delivered at time point 3. Similar to O’Doherty we applied fast (α=0.2) and slow (α=0.7) learning rate parameters. The initial reward values were 1 for Sucrose and 0 for Null.
Statistical Procedures
Whole-brain imaging data were analyzed as above. Behavioral data and brain activation percent signal change were analyzed with SPSS (IBM-SPSS, Chicago, IL) software. We initially tested for normality using Kolmogorov-Smirnov tests. When normality was preserved we used student’s t-test for 2 independent group comparisons, and report adjusted degrees of freedom and p values in case of significant variance inequalities across groups. If Kolmogorov-Smirnov tests indicated non-normal distribution across groups, we used Mann-Whitney tests for independent group comparisons. We assessed percent signal change over time and across groups using repeated measures ANOVAs. The relationship between predictor and dependent variables was assessed using regression analysis.
Results
Taste studies
Study groups rated sweetness and pleasantness of study taste solutions similarly. Sweet taste sensitivity across study groups and the 6 sucrose concentrations using linear regression analysis showed positive slopes for both groups: BN, R2=0.73, beta=0.94, p<0.001; CW, R2=0.71, beta=0.85, p<0.001; and a condition by group analysis was non-significant. For pleasantness, we explored linear, quadratic and logistic regression, but there was no significant regression result in either group, nor was there a difference in a repeated measures ANOVA analysis with taste condition and group as independent variables.
Brain Imaging Results
There were no significant group differences on the structural (SPGR) images. CW showed the predicted brain response to the unexpected receipt (US+) and omission (US−) of Sucrose in ventral putamen, insula and bilateral amygdala (Figures 1. and 2.). At lower significance (FDR corrected q=0.00005) CW also demonstrated responses in midbrain ventral tegmental area (VTA, US+:16 voxel cluster size, US−: 25 voxel cluster size) and substantia nigra (SN, US+:47 voxel cluster size, US−: 45 voxel cluster size). The group comparison indicated that BN individuals had reduced brain response in the ventral putamen, insula and orbitofrontal cortex compared to CW for both taste conditions (a reduced responses means the absolute value of the deviation was smaller: all differences were in the direction of CW having more positive or more negative responses; Figures 1. and 2.). Table 2 shows the individual coordinates for group contrast analysis (US+, US−). There were no regions that were significantly greater in BN compared to CW. We further extracted time activity curves for amygdala, ventral putamen and insula for both US+ and US− conditions. Both groups showed positive hemodynamic response curves for US+ and negative response for US−, with CW for all regions more positive for US+ and more negative for US−. Repeated measures ANOVAs showed the following significant group x condition interactions: US+ Insula right, multivariate test Wilk’s lambda=0.803, p<0.04; US− Amygdala right, multivariate test Wilk’s lambda=0.80, p<0.04; Amygdala left, multivariate test Wilk’s lambda=0.790, p<0.03. Comorbid Conditions. MDD could be affecting brain response in reward conditioning (34) and could have affected our results. Ten of the BN individuals did not have a MDD episode and were not on psychoactive medication. Group comparisons, between un-medicated BN without co-morbid depression and CW, for the US+ and US− conditions revealed similar, that is ventral putamen, insula, orbitofrontal and amygdala, differences between groups (CW > BN) but at a lower significance level for the whole brain comparison (p<0.05, 100 voxel cluster threshold).
Figure 1. Brain response to unexpected receipt of unconditioned taste stimulus Sucrose (US+).

Control women (CW) showed typical response in the ventral putamen, as well as insula and bilateral amygdala (p<0.05, cluster threshold 25 voxels, FWE corrected). Bulimia nervosa (BN) women showed significantly reduced brain response compared to CW (p<0.005 uncorrected, cluster threshold 10 voxels) in bilateral amygdala, insula and left orbitofrontal cortex.
Figure 2. Brain response to unexpected omission of unconditioned taste stimulus Sucrose (US−).

Control women (CW) showed typical response in the ventral putamen, as well as insula and bilateral amygdala (p<0.05, cluster threshold 25 voxels, FWE corrected). Bulimia nervosa (BN) women showed significantly reduced brain response compared to CW (p<0.005 uncorrected, cluster threshold 10 voxels) in bilateral ventral putamen, amygdala, insula and left orbitofrontal cortex.
Table 2.
Coordinates of brain response across groups and conditions
| US+ Receiving Sucrose Unexpectedly, CW > BN
| |||||||
|---|---|---|---|---|---|---|---|
| MNI coordinates | Z | p (SVC FWE) | Cluster | Anatomical Region | |||
| x | y | z | size | p corrected | |||
| −40 | 40 | 14 | 3.38 | 0.261 | 50 | 0.008 | Lat. Orbitofrontal cortex, Left |
| −40 | 4 | 16 | 3.28 | 0.333 | 30 | 0.044 | Insula, Left |
| −28 | −4 | −12 | 3.49 | 0.034 | 15 | 0.031 | Amygdala, Left |
| 28 | −6 | −12 | 3.26 | 0.050 | 8 | 0.054 | Amygdala, Right |
| US- Omission of Sucrose Unexpectedly, CW > BN
| |||||||
|---|---|---|---|---|---|---|---|
| MNI coordinates | Z | Cluster | Anatomical Region | ||||
| x | y | z | p (SVC FWE) | size | p corrected | ||
| 32 | 2 | −6 | 3.42 | 0.023 | 11 | 0.028 | Ventral Putamen, Right |
| −30 | 24 | −20 | 3.47 | 0.208 | 35 | 0.014 | Insula, Left |
| 30 | 28 | 4 | 3.57 | 0.166 | 108 | <0.001 | Insula, Right |
| −26 | −2 | −14 | 3.88 | 0.009 | 14 | 0.029 | Amygdala, Left |
| 30 | −4 | −14 | 3.55 | 0.023 | 38 | 0.003 | Amygdala, Right |
| Temporal Difference Model Regression, all expected and unexpected Sucrose and No-Solution trials, CW > BN
| |||||||
|---|---|---|---|---|---|---|---|
| MNI coordinates | Z | Cluster | Anatomical Region | ||||
| x | y | z | p (SVC FWE) | size | p corrected | ||
| −40 | 14 | −14 | 4.37 | 0.005 | 249 | <0.001 | Lat. Orbitofrontal cortex, Left |
| 36 | 22 | −20 | 3.33 | 0.132 | 180 | 0.001 | Lat. Orbitofrontal cortex, Left |
| −40 | 4 | 14 | 3.69 | 0.051 | 69 | 0.032 | Insula, Left |
| 28 | 22 | −12 | 3.39 | 0.128 | 74 | 0.027 | Insula, Right |
| −24 | 2 | −12 | 3.41 | 0.019 | 13 | 0.051 | Amygdala, Left |
| 28 | −6 | −12 | 2.98 | 0.054 | 12 | 0.050 | Amygdala, Right |
| 32 | 2 | −8 | 3.10 | 0.030 | 25 | 0.019 | Ventral Putamen, Right |
Montreal Nuclear Institute (MNI) coordinates are based on whole brain analysis (p<0.005 uncorrected, 10 voxel contiguity); the small volume (SVC) family-wise error correction (FWE) is based on the MNI aal atlas derived anatomical regions. There were no regions that were significantly greater in BN compared to CW.
For the TD model regression analysis, we assessed the relationship between BOLD signal and prediction errors generated by models with either a slow (alpha=0.2) or a fast (alpha=0.7) learning rate. For both groups, the fast learning rate provided the better fit. In the CW group, the regression analysis using the prediction error values from the model to predict brain response showed activation in the ventral putamen, insula, and amygdala (Figure 3.). With lower significance threshold (FDR corrected p<0.0005) VTA and SN were also significant. Relative to CW, BN individuals showed reduced regression weights in the bilateral putamen, amygdala, insula and orbitofrontal cortex (Figure 3.). Table 2 shows individual coordinates for group contrast analysis (TD Model Regression). There were no regions significantly greater in BN compared to CW. Also here, comparing the ten un-medicated, non depressed BN individuals with an age matched CW subset showed regional very similar brain response patterns, but at lower significance (p<0.05, 100 voxel cluster threshold).
Figure 3. Temporal difference model (TD) derived trial by trial reward regression with brain response.

CW showed ventral putamen, small midbrain, and amygdala response (p<0.05, cluster threshold 25 voxels, FWE corrected). BN women showed significantly weaker regression compared to CW in bilateral ventral putamen, amygdala, insula and lateral orbitofrontal cortex (p<0.005 uncorrected, cluster threshold 10 voxels).
Correlations with Behavioral Variables
Age, BMI, duration of illness, or Sensitivity to Reward or Punishment did not correlate significantly with region of interest derived strength of activation (parameter estimates) within groups for any of the conditions. However, logarithmic regression analysis revealed that binge/purge frequency significantly predicted TD model regression response in the BN group for the left insula and substantia nigra (Figure 4.), as well as left amygdala (adjusted R2=0.357, standardized beta=&0.625, p<0.003), right amygdala (adjusted R2=0.298, standardized beta=−0.579, p<0.007), right insula (adjusted R2=0.205, standardized beta=−0.497, p<0.026), left ventral putamen (adjusted R2=0.250, standardized beta=−0.538, p<0.014) and right ventral putamen (adjusted R2=0.257, standardized beta=−0.545, p<0.013).
Figure 4. Logarithmic Regression.
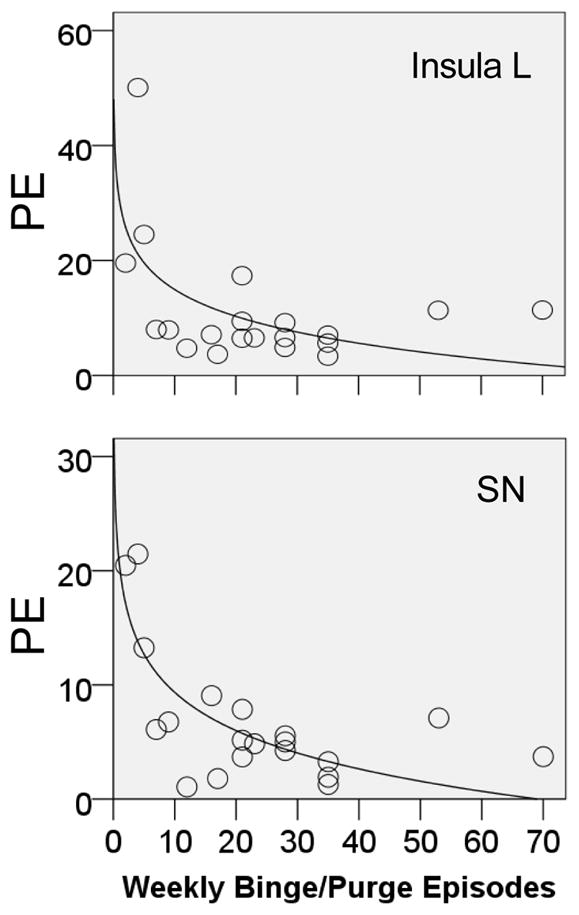
TD model response (parameter estimates, PE) was inversely predicted by number of weekly binge/purge episodes in the bulimia nervosa individuals for the left (L) insula (adjusted R2=0.285, standardized beta=−0.568, p<0.009) and substantia nigra (SN, adjusted R2=0.562, standardized beta=−0.765, p<0.001).
Discussion
This is to our knowledge the first study that investigated reward learning in BN. The results indicate that BN is associated with reduced responsiveness to unexpected receipt or omission of taste reward stimuli, and this was further supported by the relationship between brain responses and model-based predictors that are associated with the actual degree of reward associated with each trial. Further, the response associated with the model-based regressor was predicted by binge/purge frequency. These results strongly suggest reduced DA reactivity in BN that is related to illness severity. Additionally, SPSRQ Sensitivity to Reward and Punishment were elevated in the BN group.
Food consumption is intimately connected to the brain reward system. This system has been hypothesized to be an important factor in the pathophysiology of excessive eating and resulting obesity (35, 36), and is highly related to the taste of foods (37). Gustatory inputs from the tongue, immediately after food contact and prior to gut involvement, project via brain stem and thalamus to the primary taste cortex comprised by insula and frontal operculum, and from there project to the ventral striatum and amygdala, and subsequently project to the hypothalamus, midbrain, and frontal cortex (38). Hence a highly complex network is involved in taste processing. In addition to the transmission of taste quality, there are learned associations between food and pleasurable experience that create an internal representation of food stimuli that gets activated when we see, smell or think of food (37). Thus, there is a cognitive or cephalic phase that involves desire or craving, as well as a consummatory phase in the food reward processing cycle. BN has commonly been associated with addiction disorders (9) due to the episodic and often compulsive nature of bingeing on highly palatable foods. The motivation to approach food and other rewards, called ‘wanting’, has been associated with the neurotransmitter DA (35). The same neural pathways that reinforce those natural appetitive behaviors are also activated in response to addictive drugs (39). This has lead to the hypothesis that prone individuals could get “addicted” to food, including increased preference and tolerance as well as reduction of dysphoria, behaviors that are common in substance using individuals (13, 40). Animal models support the notion that episodic excessive food intake could have similar brain correlates as found in individuals with substance use. That is, rodents trained to engage in binge eating showed tolerance and withdrawal symptoms, and obese rats developed a level of dopamine (DA) release to food as seen with typical addictive substances (16, 41). Additionally, rodents showed addiction-like DA D2 receptor down regulation to overconsumption of food in brain reward circuits (18). Our results of reduced brain response to both unexpected receipt and omission of sweet taste stimuli in BN in this DA-anchored task suggest that BN is, in fact, associated with altered functional brain DA response. We propose that this may be due to the episodic excessive food stimulation resulting in desensitization of DA circuits. Little is known whether abstinence from BN type behaviors would help recover abnormal brain function in the disorder. Recent research in animals suggests that overconsumption of food manipulates DA receptor function (18). This could imply that the reverse is also possible: neurotransmitter function could recover with normalization of eating behavior. However, this is unknown and it is possible that such alterations might be long lasting, as indicated by animal studies showing that brain reward response did not immediately recover with weight restoration (42), and that drugs of abuse can cause persistent DA abnormalities after recovery (43).
The originally reported DA brain regions responsive to the TD model involved the ventral putamen and midbrain (44). Our group results indicate group differences for the ventral putamen, amygdala, insula, and orbitofrontal cortex. Newer models of reinforcement learning and conditioning integrate more brain regions that respond to the US or CS (10), and include the amygdala as excitatory and driving DA activation. The primary gustatory cortex part of the insula is not considered in the current version of that model. However, the insular cortex provides neuronal inputs to the ventral striatum (38, 45, 46), moderates substance use and novelty seeking behaviors via its DA D1 (47) and D2 (48) receptors, and is an important part of taste and reward circuits (23). The orbitofrontal cortex is also closely connected to ventral striatum and amygdala and is important for reward learning (49). In aggregate, the above studies suggest that in the BN group, the US activates insula and amygdala to a lesser degree than in the CW. This may lead to reduced activation in the ventral putamen (thought to reflect DA) and less involvement of the orbitofrontal cortex. This mechanism could be due to excessive episodic DA release and potential subsequent down-regulation of DA D2 receptors (18). Such a down-regulated DA taste reward system could then be part of an addiction-like pattern of need for episodic excessive food stimulation, while fears of gaining weight could then drive the purging behavior to compensate.
The reduced response in BN was greater for the unexpected omission of the sweet taste than for the unexpected receipt. Reinforcement learning involves both the DA D1 and D2 receptor but there are brain region specific actions, such as both receptors acting comparably in the nucleus accumbens (50), but stimulation of D2 receptors in the amygdala reduced seeking of drug rewards, while D1 stimulation did not (51). The DA D1 receptor is excitatory and probably stimulated by phasic DA stimulation like in the US+ condition, while the DA D2 receptor is inhibitory and stimulated by tonic (baseline) DA (15). Thus with the notion that excessive food intake is specifically associated with DA D2 receptor abnormalities (18, 52), this could then be reflected by the stronger response in the US− condition, which is dependent on changes in tonic DA release.
The concept that excessive eating behavior is associated with altered brain DA changes is further supported by the fact that the number of binge/purge episodes directly predicted TD model brain activation. Others studying cerebrospinal fluid monoamines found that binge/purge frequency predicted lower DA metabolites (6, 7) and our study now suggests that this behavior is directly associated with functional DA brain reward pathways.
This is the first study that reports increased Sensitivity to Punishment as well as Sensitivity to Reward from the SPSRQ in BN individuals. Previously, we found similar increases in anorexia nervosa (53), and our findings indicate that both eating disorders are characterized by generally heightened sensitivity to salient stimuli. This is important since this instability in relation to environmental stimuli could drive high harm avoidance in eating disorders.
Limitations
The sample size was not large, but 20 participants per cell are usually regarded as providing high reliability (54). Brain imaging results in psychiatry can be confounded by comorbid conditions. We addressed this by comparing unmedicated BN without comorbid diagnosis with matched CW and those analyses also showed lower activation in the BN group. This indicates that our results are not likely to be an effect of comorbidity or medication. The use of fMRI can only be a proxy for DA function and although there is reasonable evidence that fMRI BOLD response reflects DA activity well (19), there is potential for error and these studies will need to be combined with neurotransmitter receptor studies. Furthermore, while we found correlations of brain biology with BN specific behavior, those self report measures could be inflated. In our sample for both groups the fast learning rate was the better fit with similar differences across groups between slow and fast learning rate parameter estimates in the target brain regions. In our studies the artificial saliva is rated as rather aversive and therefore introduces an additional taste, while removing artificial saliva from the model simplifies learning and this could be related to the better fit of the fast learning rate across both groups.
Conclusion
In summary, our results indicate that DA related reward function is reduced in BN; these results are in line with food addiction studies in animals and could indicate a down regulation of DA function in response to episodic, excessive food intake and DA overstimulation. DA specific drugs that target to correct this reduced sensitivity may hold promise as treatment agents in the future.
Acknowledgments
The authors have no conflict of interest to declare and all authors contributed equally to this manuscript. We thank Dr. O’Doherty for providing the fractal images used as conditioned stimuli in the study. We would like to thank all the individuals who participated in this study as well as the staff at the Eating Disorders program at the Children’s Hospital and the Eating Disorder Center Denver.
Footnotes
Financial Disclosures
Funding for all aspects of the study was provided to Guido Frank by a Davis Foundation Award of the Klarman Family Foundation Grants Program in Eating Disorders, NIMH grant K23 MH080135-01A2, and a NARSAD Young Investigator Award.
Randy O’Reilly has received funding through NIH IBSC center grant 1-P50-MH079485. The authors report no biomedical financial interests or potential conflicts of interest.
References
- 1.APA. Diagnostic & Statistical Manual of Mental Disorders: DSM-IV-TR. 4. American Psychiatric Association; 2000. [Google Scholar]
- 2.Schienle A, Schafer A, Hermann A, Vaitl D. Binge-eating disorder: reward sensitivity and brain activation to images of food. Biol Psychiatry. 2009;65:654–661. doi: 10.1016/j.biopsych.2008.09.028. [DOI] [PubMed] [Google Scholar]
- 3.Uher RTM, Brammer M, Dalgleish T, Phillips M, Ng V, et al. Medial Prefrontal Cortex Activity Associated With Symptom Provocation in Eating Disorders. Am J Psychiatry. 2004;161(7):1238–1246. doi: 10.1176/appi.ajp.161.7.1238. [DOI] [PubMed] [Google Scholar]
- 4.Tauscher J, Pirker W, Willeit M, de Zwaan M, Bailer U, Neumeister A, et al. [123I] beta-CIT and single photon emission computed tomography reveal reduced brain serotonin transporter availability in bulimia nervosa. Biological Psychiatry. 2001;49:326–332. doi: 10.1016/s0006-3223(00)00951-3. [DOI] [PubMed] [Google Scholar]
- 5.Jimerson DC, Wolfe BE, Metzger ED, Finkelstein DM, Cooper TB, Levine JM. Decreased serotonin function in bulimia nervosa. Arch Gen Psychiatry. 1997;54:529–534. doi: 10.1001/archpsyc.1997.01830180043005. [DOI] [PubMed] [Google Scholar]
- 6.Jimerson D, Lesem M, Kaye W, Brewerton T. Low serotonin and dopamine metabolite concentrations in cerebrospinal fluid from bulimic patients with frequent binge episodes. Arch Gen Psychiatry. 1992;49:132–138. doi: 10.1001/archpsyc.1992.01820020052007. [DOI] [PubMed] [Google Scholar]
- 7.Kaye WH, Ballenger JC, Lydiard RB, Stuart GW, Laraia MT, O’Neil P, et al. CSF monoamine levels in normal-weight bulimia: evidence for abnormal noradrenergic activity. Am J Psychiatry. 1990;147:225–229. doi: 10.1176/ajp.147.2.225. [DOI] [PubMed] [Google Scholar]
- 8.Tiihonen J, Keski-Rahkonen A, Lopponen M, Muhonen M, Kajander J, Allonen T, et al. Brain serotonin 1A receptor binding in bulimia nervosa. Biol Psychiatry. 2004;55:871. doi: 10.1016/j.biopsych.2003.12.016. [DOI] [PubMed] [Google Scholar]
- 9.Goodman A. Neurobiology of addiction. An integrative review. Biochem Pharmacol. 2008;75:266–322. doi: 10.1016/j.bcp.2007.07.030. [DOI] [PubMed] [Google Scholar]
- 10.Hazy TE, Frank MJ, O’Reilly RC. Neural mechanisms of acquired phasic dopamine responses in learning. Neurosci Biobehav Rev. 2010;34:701–720. doi: 10.1016/j.neubiorev.2009.11.019. [DOI] [PMC free article] [PubMed] [Google Scholar]
- 11.Sutton RS, Barto AG. Toward a modern theory of adaptive networks: expectation and prediction. Psychol Rev. 1981;88:135–170. [PubMed] [Google Scholar]
- 12.Kelley AE, Berridge KC. The neuroscience of natural rewards: relevance to addictive drugs. J Neurosci. 2002;22:3306–3311. doi: 10.1523/JNEUROSCI.22-09-03306.2002. [DOI] [PMC free article] [PubMed] [Google Scholar]
- 13.Koob GF, Le Moal M. Plasticity of reward neurocircuitry and the ‘dark side’ of drug addiction. Nat Neurosci. 2005;8:1442–1444. doi: 10.1038/nn1105-1442. [DOI] [PubMed] [Google Scholar]
- 14.Cosgrove KP. Imaging receptor changes in human drug abusers. Curr Top Behav Neurosci. 2010;3:199–217. doi: 10.1007/7854_2009_24. [DOI] [PMC free article] [PubMed] [Google Scholar]
- 15.Maia TV, Frank MJ. From reinforcement learning models to psychiatric and neurological disorders. Nat Neurosci. 2011;14:154–162. doi: 10.1038/nn.2723. [DOI] [PMC free article] [PubMed] [Google Scholar]
- 16.Avena NM, Rada P, Hoebel BG. Evidence for sugar addiction: behavioral and neurochemical effects of intermittent, excessive sugar intake. Neurosci Biobehav Rev. 2008;32:20–39. doi: 10.1016/j.neubiorev.2007.04.019. [DOI] [PMC free article] [PubMed] [Google Scholar]
- 17.Bello NT, Hajnal A. Dopamine and binge eating behaviors. Pharmacol Biochem Behav. 2010;97:25–33. doi: 10.1016/j.pbb.2010.04.016. [DOI] [PMC free article] [PubMed] [Google Scholar]
- 18.Johnson PM, Kenny PJ. Dopamine D2 receptors in addiction-like reward dysfunction and compulsive eating in obese rats. Nat Neurosci. 2010;13:635–641. doi: 10.1038/nn.2519. [DOI] [PMC free article] [PubMed] [Google Scholar]
- 19.D’Ardenne K, McClure SM, Nystrom LE, Cohen JD. BOLD responses reflecting dopaminergic signals in the human ventral tegmental area. Science. 2008;319:1264–1267. doi: 10.1126/science.1150605. [DOI] [PubMed] [Google Scholar]
- 20.O’Doherty JP, Dayan P, Friston K, Critchley H, Dolan RJ. Temporal difference models and reward-related learning in the human brain. Neuron. 2003;38:329–337. doi: 10.1016/s0896-6273(03)00169-7. [DOI] [PubMed] [Google Scholar]
- 21.Schultz W. Predictive reward signal of dopamine neurons. J Neurophysiol. 1998;80:1–27. doi: 10.1152/jn.1998.80.1.1. [DOI] [PubMed] [Google Scholar]
- 22.Hazy TE, Frank MJ, O’Reilly RC. Neural mechanisms of acquired phasic dopamine responses in learning. Neurosci Biobehav Rev. 2009 doi: 10.1016/j.neubiorev.2009.11.019. [DOI] [PMC free article] [PubMed] [Google Scholar]
- 23.Wang G-J, Volkow N, Thanos P, Fowler J. Imaging of Brain Dopamine Pathways. Journal of Addiction Medicine. 2009;3:8–18. doi: 10.1097/ADM.0b013e31819a86f7. [DOI] [PMC free article] [PubMed] [Google Scholar]
- 24.American Psychiatric Association. Handbook of Psychiatric Measures. 4. Washington DC: American Psychiatric Association; 2000. Diagnostic and Statistical Manual of Mental Disorders - Text Revision (DSM-IV-TR) [Google Scholar]
- 25.Cumella E. Review of the Eating Disorder Inventory-3. Journal of Personality Assessment. 2006;81:116–117. [Google Scholar]
- 26.Garner D. Eating Disorder Inventory -3 (EDI -3) Lutz, FL: Psychological Assessment Resources, Inc; 2004. [Google Scholar]
- 27.Torrubia R, Avila C, Molto J, Caseras X. The Sensitivity to Punishment and Sensitivity to Reward Questionnaire (SPSRQ) as a measure of Gray’s anxiety and impulsivity dimensions. Personality and Individual Differences. 2001;31:837–862. [Google Scholar]
- 28.Beck AT, Ward M, Mendelson M, Mock J, Erbaugh J. An Inventory for measuring depression. Arch Gen Psychiatry. 1961;4:53–63. doi: 10.1001/archpsyc.1961.01710120031004. [DOI] [PubMed] [Google Scholar]
- 29.Cloninger CR, Przybeck TR, Svrakic DM, Wetzel RD. The Temperament and Character Inventory (TCI) A Guide to its Development and Use. St. Louis, MO: Center for Psychobiology of Personality, Washington University; 1994. [Google Scholar]
- 30.Dreher JC, Schmidt PJ, Kohn P, Furman D, Rubinow D, Berman KF. Menstrual cycle phase modulates reward-related neural function in women. Proc Natl Acad Sci U S A. 2007;104:2465–2470. doi: 10.1073/pnas.0605569104. [DOI] [PMC free article] [PubMed] [Google Scholar]
- 31.Frank G, Kaye W, Carter C, Brooks S, May C, Fissel K, et al. The evaluation of brain activity in response to taste stimuli--a pilot study and method for central taste activation as assessed by event related fMRI. J Neurosci Methods. 2003;131:99–105. doi: 10.1016/s0165-0270(03)00240-1. [DOI] [PubMed] [Google Scholar]
- 32.Drevets WC, Gautier C, Price JC, Kupfer DJ, Kinahan PE, Grace AA, et al. Amphetamine-induced dopamine release in human ventral striatum correlates with euphoria. Biol Psychiatry. 2001;49:81–96. doi: 10.1016/s0006-3223(00)01038-6. [DOI] [PubMed] [Google Scholar]
- 33.Frank GK, Bailer UF, Henry S, Drevets W, Meltzer CC, Price JC, et al. Increased dopamine D2/D3 receptor binding after recovery from anorexia nervosa measured by positron emission tomography and [11C]raclopride. Biol Psychiatry. 2005;58:908–912. doi: 10.1016/j.biopsych.2005.05.003. [DOI] [PubMed] [Google Scholar]
- 34.Kumar P, Waiter G, Ahearn T, Milders M, Reid I, Steele JD. Abnormal temporal difference reward-learning signals in major depression. Brain. 2008;131:2084–2093. doi: 10.1093/brain/awn136. [DOI] [PubMed] [Google Scholar]
- 35.Berridge KC, Ho CY, Richard JM, DiFeliceantonio AG. The tempted brain eats: pleasure and desire circuits in obesity and eating disorders. Brain Res. 2010;1350:43–64. doi: 10.1016/j.brainres.2010.04.003. [DOI] [PMC free article] [PubMed] [Google Scholar]
- 36.Magni P, Dozio E, Ruscica M, Celotti F, Masini MA, Prato P, et al. Feeding behavior in mammals including humans. Ann N Y Acad Sci. 2009;1163:221–232. doi: 10.1111/j.1749-6632.2008.03627.x. [DOI] [PubMed] [Google Scholar]
- 37.Rolls ET. Taste, olfactory and food texture reward processing in the brain and obesity. Int J Obes (Lond) 2010 doi: 10.1038/ijo.2010.155. [DOI] [PubMed] [Google Scholar]
- 38.Carmichael ST, Price JL. Connectional networks within the orbital and medial prefrontal cortex of macaque monkeys. J Comp Neurol. 1996;371:179–207. doi: 10.1002/(SICI)1096-9861(19960722)371:2<179::AID-CNE1>3.0.CO;2-#. [DOI] [PubMed] [Google Scholar]
- 39.Hyman SE, Malenka RC. Addiction and the brain: the neurobiology of compulsion and its persistence. Nat Rev Neurosci. 2001;2:695–703. doi: 10.1038/35094560. [DOI] [PubMed] [Google Scholar]
- 40.Corsica JA, Pelchat ML. Food addiction: true or false? Curr Opin Gastroenterol. 2010;26:165–169. doi: 10.1097/MOG.0b013e328336528d. [DOI] [PubMed] [Google Scholar]
- 41.Blumenthal DM, Gold MS. Neurobiology of food addiction. Curr Opin Clin Nutr Metab Care. 2010;13:359–365. doi: 10.1097/MCO.0b013e32833ad4d4. [DOI] [PubMed] [Google Scholar]
- 42.Carr KD, Tsimberg Y, Berman Y, Yamamoto N. Evidence of increased dopamine receptor signaling in food-restricted rats. Neuroscience. 2003;119:1157–1167. doi: 10.1016/s0306-4522(03)00227-6. [DOI] [PubMed] [Google Scholar]
- 43.Nader MA, Czoty PW. PET imaging of dopamine D2 receptors in monkey models of cocaine abuse: genetic predisposition versus environmental modulation. Am J Psychiatry. 2005;162:1473–1482. doi: 10.1176/appi.ajp.162.8.1473. [DOI] [PubMed] [Google Scholar]
- 44.Schultz W. Getting formal with dopamine and reward. Neuron. 2002;36:241–263. doi: 10.1016/s0896-6273(02)00967-4. [DOI] [PubMed] [Google Scholar]
- 45.Fudge JL, Breitbart MA, Danish M, Pannoni V. Insular and gustatory inputs to thecaudal ventral striatum in primates. J Comp Neurol. 2005;490:101–118. doi: 10.1002/cne.20660. [DOI] [PMC free article] [PubMed] [Google Scholar]
- 46.Haber SN, Kunishio K, Mizobuchi M, Lynd-Balta E. The orbital and medial prefrontal circuit through the primate basal ganglia. J Neurosci. 1995;15:4851–4867. doi: 10.1523/JNEUROSCI.15-07-04851.1995. [DOI] [PMC free article] [PubMed] [Google Scholar]
- 47.Di Pietro NC, Mashhoon Y, Heaney C, Yager LM, Kantak KM. Role of dopamine D1 receptors in the prefrontal dorsal agranular insular cortex in mediating cocaine self-administration in rats. Psychopharmacology (Berl) 2008;200:81–91. doi: 10.1007/s00213-008-1149-0. [DOI] [PMC free article] [PubMed] [Google Scholar]
- 48.Suhara T, Yasuno F, Sudo Y, Yamamoto M, Inoue M, Okubo Y, et al. Dopamine D2 receptors in the insular cortex and the personality trait of novelty seeking. Neuroimage. 2001;13:891–895. doi: 10.1006/nimg.2001.0761. [DOI] [PubMed] [Google Scholar]
- 49.Schoenbaum G, Roesch MR, Stalnaker TA, Takahashi YK. A new perspective on the role of the orbitofrontal cortex in adaptive behaviour. Nat Rev Neurosci. 2009;10:885–892. doi: 10.1038/nrn2753. [DOI] [PMC free article] [PubMed] [Google Scholar]
- 50.Wolterink G, Phillips G, Cador M, Donselaar-Wolterink I, Robbins TW, Everitt BJ. Relative roles of ventral striatal D1 and D2 dopamine receptors in responding with conditioned reinforcement. Psychopharmacology (Berl) 1993;110:355–364. doi: 10.1007/BF02251293. [DOI] [PubMed] [Google Scholar]
- 51.Thiel KJ, Wenzel JM, Pentkowski NS, Hobbs RJ, Alleweireldt AT, Neisewander JL. Stimulation of dopamine D2/D3 but not D1 receptors in the central amygdala decreases cocaine-seeking behavior. Behav Brain Res. 2010;214:386–394. doi: 10.1016/j.bbr.2010.06.021. [DOI] [PMC free article] [PubMed] [Google Scholar]
- 52.Wang GJ, Volkow ND, Thanos PK, Fowler JS. Similarity between obesity and drug addiction as assessed by neurofunctional imaging: a concept review. J Addict Dis. 2004;23:39–53. doi: 10.1300/J069v23n03_04. [DOI] [PubMed] [Google Scholar]
- 53.Jappe L, Frank G, Shott M, Rollin D, Pryor T, Hagman J, et al. Heightened Sensitivity to Reward and Punishment in Anorexia Nervosa. Int J of Eating Disorders. doi: 10.1002/eat.20815. Published online: 15 APR 2010. [DOI] [PMC free article] [PubMed] [Google Scholar]
- 54.Thirion B, Pinel P, Meriaux S, Roche A, Dehaene S, Poline JB. Analysis of a large fMRI cohort: Statistical and methodological issues for group analyses. Neuroimage. 2007;35:105–120. doi: 10.1016/j.neuroimage.2006.11.054. [DOI] [PubMed] [Google Scholar]