Abstract
Candida glabrata is a leading cause of disseminated candidiasis. The echinocandins are increasingly used as first-line agents for the treatment of patients with this syndrome, although the optimal regimen for the treatment of invasive Candida glabrata infections in neutropenic patients is not known. We studied the pharmacokinetics (PK) and pharmacodynamics (PD) of micafungin, anidulafungin, and caspofungin in a neutropenic murine model of disseminated Candida glabrata infection to gain further insight into optimal therapeutic options for patients with this syndrome. A mathematical model was fitted to the data and used to bridge the experimental results to humans. The intravenous inoculation of Candida glabrata in mice was followed by logarithmic growth throughout the experimental period (101 h). A dose-dependent decline in fungal burden was observed following the administration of 0.1 to 20 mg/kg of body weight every 24 h for all three agents. The exposure-response relationships for each drug partitioned into distinct fungistatic and fungicidal components of activity. Surprisingly, the average human drug exposures following currently licensed regimens were predicted to result in a fungistatic antifungal effect. Higher human dosages of all three echinocandins are required to induce fungicidal effects in neutropenic hosts.
INTRODUCTION
Candida glabrata is a leading cause of disseminated candidiasis in most national surveillance studies (5, 31). The overall mortality rate is approximately 40% (6, 18) and in some series is associated with worse outcomes than are other Candida spp. (33). Candida glabrata is frequently resistant to fluconazole (6). Invasive infections due to Candida glabrata in neutropenic patients are a serious but relatively uncommon clinical syndrome, accounting for approximately 5% of the overall number of invasive cases (18). Importantly, there are no prospective clinical trial data that address the optimal therapy of this opportunistic pathogen in profoundly immunocompromised patients.
The echinocandins are increasingly used as first-line agents for the treatment of patients with candidemia and invasive candidiasis. These agents have demonstrated efficacy against Candida spp. in laboratory animal models (1, 27, 28) and randomized clinical trials (20, 23, 25). The echinocandins generally are well tolerated, have few clinically significant drug-drug interactions, and can be safely used in patients with renal and hepatic dysfunction (9). The Infectious Diseases Society of America (IDSA) recommends echinocandins as first-line agents for the treatment of Candida glabrata infections in neutropenic patients but also recognizes the paucity of evidence supporting this position (24).
Here, we investigate the pharmacokinetics (PK) and pharmacodynamics (PD) of micafungin, anidulafungin, and caspofungin against Candida glabrata. We described the drug exposure-response relationships for each of these agents using a neutropenic model of disseminated Candida glabrata infection. We use a linked PK-PD mathematical model to explore the clinical implications of our experimental data. Our results suggest that higher human echinocandin dosages than those currently licensed are required to achieve fungicidal activity and near-maximal antifungal activity.
(This work was presented in part at the 21st European Congress of Clinical Microbiology and Infectious Diseases [ECCMID]/ 27th International Congress of Chemotherapy [ICC], Milan, May 2011.)
MATERIALS AND METHODS
Organisms and MICs.
Candida glabrata ATCC 2001 was used as the challenge strain for all experiments. MICs of micafungin, anidulafungin, and caspofungin were determined using both European Committee for Antimicrobial Susceptibility Testing (EUCAST) and Clinical and Laboratory Standards Institute (CLSI) methodologies (7, 11). MICs were determined in three separate independent experiments, and the modal EUCAST value was used for the subsequent PK-PD analyses. The Candida FKS1, FKS2, and FKS3 genes were sequenced in the hot-spot regions by the Sanger methodology using a CEQ 8000 Beckman Coulter genetic analysis system as previously described (26).
Intravenous neutropenic murine model of Candida glabrata.
All animal experiments during this study were performed under United Kingdom Home Office project license PPL40/3101. Male CD1 mice (Charles River Ltd., Kent, United Kingdom) weighing approximately 25 g were housed in vented HEPA-filtered cages with free access to food and water. Mice were rendered profoundly neutropenic 3 days prior to the beginning of the study with 200 mg/kg of body weight intraperitoneal (i.p.) cyclophosphamide (Sigma) and 200 mg/kg subcutaneous cortisone acetate (Sigma). A Candida glabrata suspension containing 1.6 × 10⁶ CFU per ml was prepared in phosphate-buffered saline (Invitrogen, Paisley, United Kingdom) from 1-day-old shaking cultures in Sabouraud glucose broth (Scientific Laboratory Supplies, Wilford, United Kingdom). The desired inoculum was confirmed by quantitative cultures. Disseminated infection was established via the tail vein with 0.2 ml of this suspension to deliver an absolute inoculum of 3 × 10⁵ organisms per mouse. Cortisone acetate was readministered on day +1.
The clinical formulations of anidulafungin (Pfizer, Sandwich, United Kingdom) and micafungin (Astellas Pharma Ltd., Staines, United Kingdom) were diluted to the final desired concentration in saline. The clinical formulation of caspofungin (Merck Sharp & Dohme Corp., Hoddesdon, United Kingdom) was diluted in water. All three drugs were administered i.p. 5 h postinoculation and every subsequent 24 h for a total of four doses (i.e., drug was administered at 5, 29, 53, and 77 h). Mice were sacrificed throughout the study period for both pharmacokinetic and pharmacodynamic analyses, with the last time point being 101 h postinoculation.
Pharmacokinetic and pharmacodynamic studies.
Mice received 0.1, 1, 5, and 20 mg/kg of each echinocandin every 24 h. These dosages were based on preliminary dose-finding experiments. For pharmacokinetic studies, groups of mice (n = 3) were sacrificed throughout the second and fourth dosing intervals at 1, 3, 6, and 24 h postdose. Plasma samples were obtained by cardiac puncture following terminal anesthesia with 5% isoflurane (Baxter, Newbury, United Kingdom), and tissue drug levels were determined in the kidney. For the pharmacodynamic studies, kidney cultures (n = 4 mice) were determined between 0 and 101 h postinoculation by plating serial 10-fold dilutions of homogenate to Sabouraud agar (Oxoid, Basingstoke, United Kingdom).
Measurement of echinocandin concentrations.
Micafungin, anidulafungin, and caspofungin concentrations in mouse plasma and kidney were measured using high-performance liquid chromatography (HPLC) with a Shimadzu Prominence (Shimadzu, Milton Keynes, United Kingdom) by the following methods adapted from several sources (13, 14, 29).
Micafungin and anidulafungin were measured using a hypersil BDS C18 5-μm column (250 by 4.6 mm; Fisher Scientific, Loughborough, United Kingdom) following an injection volume of 10 μl. A standard curve encompassing 0.05 to 25 mg/liter was constructed in the respective matrix from stock solutions of 1,000 mg/liter micafungin or anidulafungin in ethanol (Fisher Scientific). The internal standard was micafungin or anidulafungin for the measurement of anidulafungin and micafungin, respectively. The mobile phase was 70% 0.02 M potassium dihydrogen phosphate, 30% (vol/vol) acetonitrile, with a gradient profile changing to 30 and 70% during 12 min and with an overall run time of 16 min. The flow rate was 1 ml/min. Micafungin and anidulafungin were detected using fluorescence at an excitation wavelength of 273 nm and an emission wavelength of 464 nm; they eluted after 10 and 13.4 min, respectively. For micafungin in plasma and kidney, the percent coefficient of variation (CV%) was <10% for the concentration range 0.05 to 25 mg/liter, the limit of detection was 0.05 mg/liter, and the intra- and interday variation was <10%. For anidulafungin in plasma and kidney, the CV% was <8% for the concentration range 0.05 to 25 mg/liter, the limit of detection was 0.05 mg/liter, and the intra- and interday variation was <8%.
Caspofungin was measured with a new Kinetex 2.6u C18 column (75 by 4.6 mm; Phenomenex, Macclesfield, United Kingdom) using a 30-μl injection volume. A standard curve encompassing 0.125 to 10 mg/liter was constructed in the respective matrix from stock solutions of 1,000 mg/liter caspofungin in a 62:28 mixture of 0.1% trifluoroacetic acid (TFA) in water-acetonitrile (Fisher Scientific). The internal standard was 4-hexylresourcinol (Sigma, Dorset, United Kingdom). The mobile phase was 70% (vol/vol) 0.1% TFA in water and 30% (vol/vol) acetonitrile with a gradient profile changing to 40 and 60% during 5 min, with an overall run time of 7.5 min and flow rate of 1.4 ml/min. Caspofungin was detected using fluorescence with an excitation wavelength of 224 nm and emission wavelength of 304 nm; they eluted after 3.6 and 5.5 min, respectively. In plasma and kidney the CV% was <8% for the concentration range 0.125 to 10 mg/liter, the limit of detection was 0.125 mg/liter, and the intra- and interday variation was <7%.
Mathematical modeling.
A pharmacokinetic-pharmacodynamic mathematical model was used to link drug concentrations with the antifungal effect and to define the drug exposure that produced near-maximal fungicidal activity. All PK-PD data obtained from each drug were simultaneously comodeled using a population methodology with the Big version of the program nonparametric adaptive grid (BIG NPAG) (21). The structural mathematical model used for these analyses consisted of the following five ordinary differential equations and have been recently used by us to model disseminated infections due to Candida albicans (30).
| (1) |
| (2) |
| (3) |
| (4) |
| (5) |
Where X1, X2, X3, and X4 are the amounts of echinocandin (in milligrams) in the peritoneum, serum, kidney, and peripheral compartment, respectively. R(1) is the amount of drug administered to the peritoneum; CLS is the clearance; Vc and Vkidney are the volumes of the central compartment and kidney, respectively; ka, kcp, kpc, kck, and kkc are the first-order rate constants that connect the respective compartments; N is the burden (organisms/gram kidney) of Candida glabrata; Kgmax is the maximal rate of growth; POPmax is the theoretical maximal density within the kidney; Hg is the slope function for the suppression of growth; C50g is the amount of drug in the kidney where there is half-maximal suppression of growth; Kkmax is the maximal rate of kill; Hk is the slope functions for the fungal kill; C50k is the concentration of drug in the kidney where the fungal kill is half maximal.
Equation 1 describes the flux of drug out of the peritoneum (where it has been injected). Equation 2 describes the rate of change of drug in the central compartment (plasma). Equation 3 describes the rate of change of drug in the kidney. Equation 4 describes the rate of change of drug in the peripheral compartment (i.e., everything other than the blood and the kidney). Equation 5 describes the rate of change of fungal burden in the kidney that contains terms describing the capacity-limited growth of Candida glabrata (5), the drug-associated suppression of growth (fungistatic effect), and the drug-associated fungal kill (fungicidal effect).
The weighting functions were obtained by fitting the structural mathematical model (shown above) to the data using the maximum-likelihood estimator in ADAPT 5, as previously described by us and others (19, 34). The fit of the model to the data was assessed using the log likelihood value, visual inspection, the coefficient of determination (r2) of the observed-predicted plot after the Bayesian step, and by respective measures of bias and precision. Both the mean and median parameter values were explored and distinguished using these parameters. The area under the concentration-time curve (AUC0-24) in plasma and kidney was calculated using integration after the implementation of the mathematical model in the simulation module of the program ADAPT 5 (8).
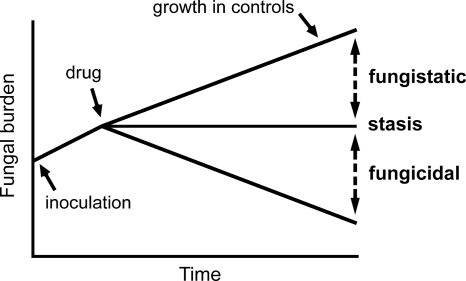
The definitions and concepts for the terms fungistatic and fungicidal are depicted in Fig. 1. The term stasis refers to the maintenance of fungal burden at the (estimated) density at the time drug therapy was initiated. Kidney burdens above this line were classified as fungistatic, while those beneath the line were fungicidal.
Fig. 1.
Definitions for fungicidal and fungistatic activity used in this study.
Simulation and humanization of murine pharmacokinetics.
The mean concentration-time profile for humans receiving micafungin at 100, 200, 400, and 800 mg/day was determined using the mean parameter values from a population pharmacokinetic model. These values were inserted into ADAPT 5 (8). Micafungin then was administered to mice in silico to approximate the shape of a human concentration-time curve. The mathematical model then was used to obtain a predicted pharmacodynamic readout from this humanized regimen.
The AUC0-24 following a variety of echinocandin dosages was estimated using the integration of the plasma concentration-time profile (i.e., integration with respect to the time of equation 2 of the mathematical model). The modal EUCAST MIC then was used to calculate the AUC/MIC ratio (Table 1). The fungal burden in the kidney following each echinocandin regimen also was determined using the mathematical model and then related to the AUC/MIC ratios.
Table 1.
Micafungin, anidulafungin, and caspofungin MICs against Candida glabrata ATCC 2001
| Drug | Modal MIC (mg/liter) (n = 3) according to: |
|
|---|---|---|
| EUCAST | CLSI | |
| Micafungin | 0.06 | 0.06 |
| Anidulafungin | 0.015 | 0.03 |
| Caspofungin | 0.25 | 0.5 |
To help place the AUC/MIC ratios from the experimental model in a clinical context, mean human values also were estimated. For micafungin and anidulafungin, the AUC at steady state was calculated using total dose (mg)/clearance (liter/h). The point estimates for clearance were obtained from the population pharmacokinetic models of Gumbo et al. (15) and Dowell et al. (10). For caspofungin, the AUC at steady state in healthy volunteers was obtained from the publication of Stone et al. (32).
RESULTS
MICs.
The modal MICs for C. glabrata ATCC 2001 for each compound are shown in Table 1. The MICs were comparable when determined using EUCAST or CLSI methodology. The organism was determined to be wild type with no amino acid substitutions in Fks1, Fks2, and Fks3 that have been associated with echinocandin resistance.
Murine pharmacodynamics.
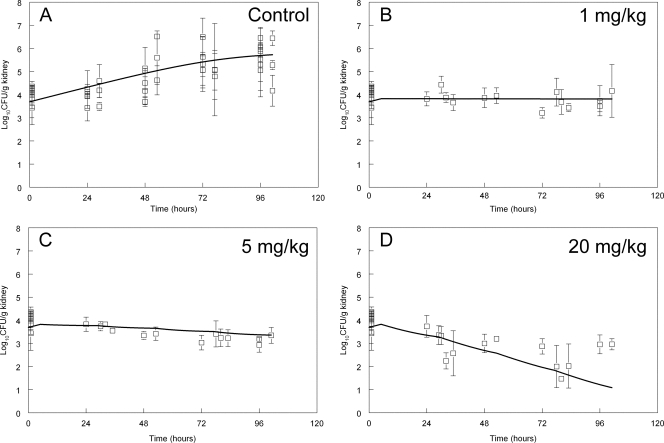
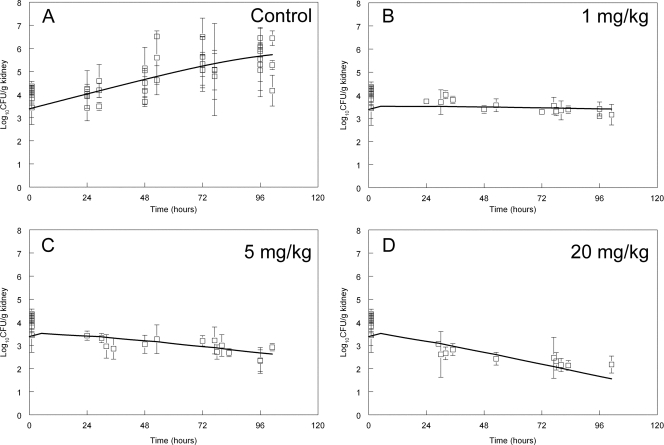
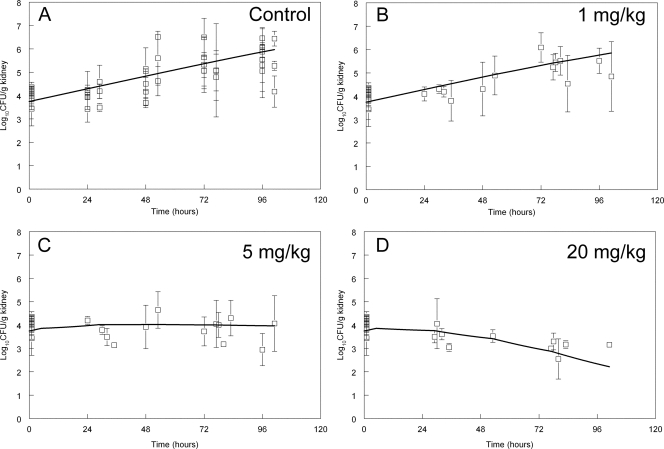
The fungal burden in the kidney at 1 h postinoculation determined from eight separate experiments was 4.04 ± 0.42 log10 CFU/g kidney (means ± standard deviations). In Fig. 2 to 4 the means ± standard deviations from each experiment (n = 4 mice) are shown. There was logarithmic growth throughout the experimental period, with an increase of approximately 2 log units by the end of the experiment. The pooled data from these control experiments (obtained from each compound) are shown in of Fig. 2A to 4A. The stasis point (i.e., the fungal density at the time treatment commenced at 5 h postinoculation) estimated from the mathematical model (Fig. 1 and see below) was 3.83, 3.86, and 3.52 log10 CFU/g kidney for micafungin, anidulafungin, and caspofungin, respectively.
Fig. 2.
Pharmacodynamics of 0, 1, 5, and 20 mg/kg micafungin administered 5, 29, 53, and 77 h postinoculation. Data are means ± standard deviations, and the solid line is the fit of the mathematical model.
Fig. 4.
Pharmacodynamics of 0, 1, 5, and 20 mg/kg caspofungin administered 5, 29, 53, and 77 h postinoculation. Data are means ± standard deviations, and the solid line is the fit of the mathematical model.
The effect of the administration of 1, 5, and 20 mg/kg of micafungin, anidulafungin, and caspofungin on the density of C. glabrata in the kidney is shown in Fig. 2 to 4. The antifungal effect was comparable on a mg/kg basis for each of the three agents. A predominantly fungistatic effect was apparent following the administration of 1 mg/kg micafungin and caspofungin (Fig. 2 and 4) and 5 mg/kg anidulafungin (Fig. 3). Progressively higher dosages resulted in a net decline in the fungal burden, even though the effect was relatively small and sterilization was not achieved. The effect of 0.1 mg/kg also was studied, but it did not result in any appreciable antifungal effect for any compound (these data were mathematically modeled, and therefore contributed to the overall fit of the model to the data, but are not shown). The administration of 20 mg/kg of each echinocandin resulted in a fungicidal effect, even though this antifungal effect was relatively small (ca. 1 to 2 log units beyond stasis) (Fig. 2D to 4D).
Fig. 3.
Pharmacodynamics of 0, 1, 5, and 20 mg/kg anidulafungin administered 5, 29, 53, and 77 h postinoculation. Data are means ± standard deviations, and the solid line is the fit of the mathematical model.
Humanization of micafungin pharmacokinetics.
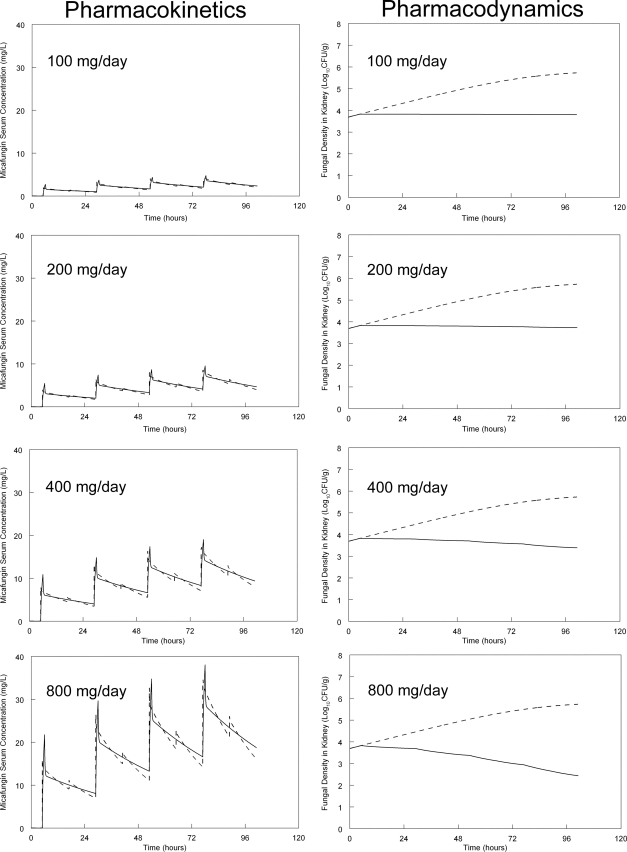
To further place the experimental findings in a clinical context, the murine pharmacokinetics were humanized in silico. Human-like concentration-time profiles were simulated by the administration of micafungin (in silico) every 12 h (Fig. 5). Humanized serum profiles were constructed to mimic the concentration-time profile of an average patient receiving 100, 200, 400, and 800 mg/day. The predicted time course of echinocandin concentrations and fungal density in the kidney then was determined from the mathematical model. As shown in Fig. 5, the administration of the currently licensed regimen resulted in a fungistatic effect. The administration of 200 mg similarly resulted in a comparable fungistatic effect. A clear fungicidal effect was apparent following the administration of 400 and 800 mg/day, even though the rate of kill was relatively slow.
Fig. 5.
In silico humanization of the murine pharmacokinetics and predicted pharmacodynamic response obtained from the mathematical model. The administration of 100, 200, 400, and 800 mg micafungin to a so-called average human results in a micafungin concentration-time profile represented by the solid line. For the pharmacodynamics, the fungal burden without therapy is shown by the dotted line, and the predicted response with each dosage is shown by the solid line.
Simulations and bridging to humans.
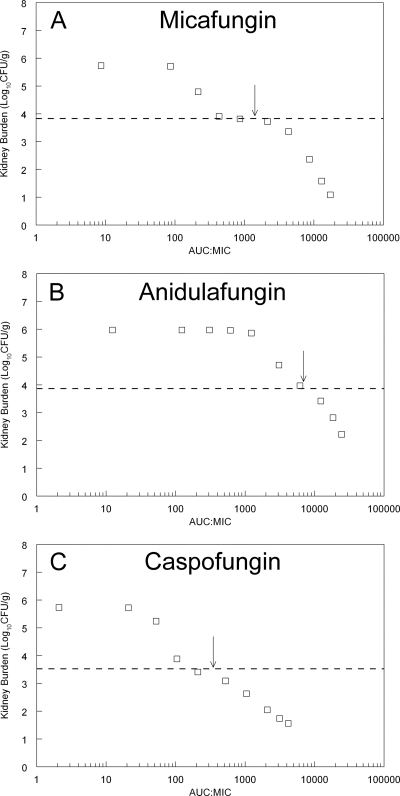
To further study the patterns of antifungal effect, the mathematical model was used to calculate the fungal burden in the kidney at the end of the experimental period. In these simulations, drug exposure was quantified in terms of the AUC/MIC ratio. A unique and common pattern of activity was observed for these agents that was characterized by distinct fungistatic and fungicidal components of the drug exposure-response relationship. All three agents showed a “shoulder” as the antifungal activity transitioned from a fungistatic to a fungicidal pattern of action (Fig. 6). This quite distinct partitioning of antifungal effect was also apparent from the disparate estimates for C50g (the concentration of drug in the kidney required to induce half-maximal reduction in growth) versus C50k (the concentration of drug in the kidney required to induce half-maximal kill) (see Table 2). For each compound, the estimate for C50g was substantially lower than C50k, reflecting the fact that increases in concentrations well beyond C50g were required before a fungicidal effect was apparent. This shoulder was most apparent for micafungin but also was present for anidulafungin and caspofungin (see Fig. 6). The average human AUC/MIC ratio for patients receiving micafungin at 100 mg/day, anidulafungin at 100 mg/day, and caspofungin at 50 mg/day corresponds to the shoulder on the stasis line (arrows in Fig. 6). As is clear from Fig. 5 and 6, higher drug exposures than those experienced by an average patient receiving a standard regimen are required to induce fungicidal activity.
Fig. 6.
Predictions from the mathematical model for each echinocandin. Each point represents the predicted fungal burden at the end of the experiment (i.e., 101 h postinoculation and following four doses of drug administered at 5, 29, 53, and 77 h postinoculation) for a given AUC/MIC ratio. The dotted line is the stasis line, which represents the fungal burden in the kidney at the time therapy is initiated 5 h postinoculation. The arrows represent the AUC/MIC ratio in an average patient receiving micafungin at 100 mg/day, anidulafungin at 100/day, and caspofungin at 50 mg/day. The exposure-response relationships show a shoulder as antifungal activity transitions from a fungistatic to fungicidal pattern.
Table 2.
Measures of central tendency and standard deviations for the parameter values from the mathematical model for each echinocandin against Candida glabrata
| Parametera | Result for: |
|||||
|---|---|---|---|---|---|---|
| Micafungin |
Anidulafungin |
Caspofungin |
||||
| Mean | SD | Mean | SD | Median | SD | |
| ka (h−1) | 26.83 | 4.92 | 20.35 | 2.21 | 24.78 | 3.11 |
| CLS (liter/h) | 0.0005 | 0.0002 | 0.0009 | 0.0003 | 0.0004 | 0.0003 |
| Vc (liter) | 0.004 | 0.0007 | 0.027 | 0.0077 | 0.0031 | 0.002 |
| kcp (h−1) | 7.65 | 9.73 | 22.73 | 12.38 | 26.97 | 12.45 |
| kpc (h−1) | 20.4 | 5.59 | 19.27 | 3.01 | 16.79 | 5.48 |
| kck (h−1) | 18.94 | 10.48 | 21.05 | 6.24 | 6.7 | 8.55 |
| kkc (h−1) | 12.88 | 4.32 | 26.37 | 4.34 | 2.12 | 9.34 |
| Vkidney(liter) | 0.005 | 0.004 | 0.014 | 0.006 | 0.009 | 0.003 |
| Kgmax (log10 CFU/g/h) | 0.06 | 0.01 | 0.05 | 0.003 | 0.062 | 0.024 |
| Hg | 6.30 | 1.75 | 4.64 | 3.03 | 6.34 | 1.87 |
| C50g (mg/liter) | 0.464 | 0.27 | 1.74 | 0.57 | 0.59 | 0.9 |
| POPmax (CFU/g) | 678,931 | 335,816 | 6,076,970 | 3,145,520 | 916,159 | 3,821,240 |
| Kkmax (log10 CFU/g/h) | 0.089 | 0.029 | 0.1 | 0.059 | 0.059 | 0.054 |
| Hk | 2.4 | 1.81 | 2.72 | 2.63 | 1.47 | 1.36 |
| C50k (mg/liter) | 25.82 | 7.81 | 19.42 | 8.14 | 13.82 | 5.17 |
| Initial condition (CFU/g) | 4,926 | 1,579 | 5,590 | 1,594 | 2,437 | 1,324 |
Parameters are defined in Materials and Methods.
DISCUSSION
Candida glabrata is a leading cause of candidemia and invasive candidiasis, accounting for 26% in some surveillance series (18). There are relatively few data that specifically address the epidemiology, prognosis, and treatment of invasive candidiasis in neutropenic hosts. There are fewer data that describe the specific outcomes of Candida glabrata infections in this setting. The echinocandins are increasingly considered to be first-line agents for the treatment of Candida glabrata in neutropenic hosts, despite the absence of definitive evidence from randomized clinical trials for this recommendation.
One frequently cited advantage of the echinocandins is their presumed fungicidal activity (12). While the terms fungistatic and fungicidal are widely used to characterize antimicrobial activity, there are no standardized definitions, and the ultimate relevance for humans is not known (22). Our study provides some further insights into these issues. (i) The echinocandin concentrations required to suppress growth are substantially different from those required to achieve microbial killing. In our study, for example, the echinocandin effect was predominantly fungistatic at relatively low drug exposures, with fungicidal activity being observed only at much higher drug exposures. (ii) The wide separation of fungistatic versus fungicidal effects is responsible for a shoulder or hump in the exposure-response relationships. (iii) Fungicidal activity was observed only at exposures substantially in excess of those that are currently recommended and/or licensed.
The pharmacodynamic targets associated with stasis and various orders of logarithmic killing for the echinocandins against C. glabrata are largely comparable between this study and others (2–4, 14). The total drug AUC/MIC ratios associated with stasis for micafungin and caspofungin are ∼1,500 to 3,000 and 100 to 400, respectively. Our estimate for anidulafungin AUC/MIC ratios associated with stasis (∼6,000) is higher than those in other studies (3), and this discrepancy may be explained by strain-to-strain variability in response to echinocandins.
Our study suggests that dosage escalation is required to achieve maximal antifungal effect in neutropenic hosts with disseminated Candida glabrata infection. The simulations shown in Fig. 6 suggest that an average neutropenic patient receiving a licensed echinocandin regimen could control disseminated infection—the drug would prevent progressive fungal growth. Importantly, however, infection may not be eliminated because concentrations are not high enough to induce fungal killing. Therefore, one potential therapeutic strategy for the use of echinocandins in neutropenic patients is the use of higher dosages. Such a strategy is viable because of the wide therapeutic index that is characteristic of each of these agents. Further clinical studies are warranted to investigate the utility of dosage escalation.
We acknowledge a number of potential limitations of this study. We have studied a single strain of Candida glabrata in considerable detail. Ideally, our findings should be confirmed with additional strains. Nevertheless, the exposure-response relationships in this study are consistent with those described by other investigators (2, 14). Second, the implications of our study findings should be restricted to neutropenic patients. The outcome of disseminated Candida glabrata infections treated with echinocandins in nonneutropenic patients is likely to be different because of the additional fungicidal effect of neutrophils as previously demonstrated by us (17, 34). Third, the PK-PD modeling and bridging studies from mice to humans explicitly assumes that the rate and extent of trafficking of drug from the plasma into the kidney in mice and humans are comparable (16).
Despite potential limitations, this study provides an experimental basis for innovative treatment regimens for neutropenic hosts with disseminated infection caused by Candida glabrata. Dosage escalation may be required to achieve maximal fungal killing and thereby optimize clinical responses. PK-PD modeling with bridging from mice to humans provides a way in which potential therapeutic strategies can be identified. Additional preclinical and clinical studies are warranted to further investigate this possibility.
ACKNOWLEDGMENTS
William Hope is supported by a National Institute for Health Research (NIHR) Clinician Scientist Award. This study was supported in part by a research grant from Astellas Pharma Europe Ltd. and the Fungal Research Trust.
Footnotes
Published ahead of print on 1 August 2011.
REFERENCES
- 1. Abruzzo G. K., et al. 2000. Efficacy of the echinocandin caspofungin against disseminated aspergillosis and candidiasis in cyclophosphamide-induced immunosuppressed mice. Antimicrob. Agents Chemother. 44:2310–2318 [DOI] [PMC free article] [PubMed] [Google Scholar]
- 2. Andes D., et al. 2010. In vivo comparison of the pharmacodynamic targets for echinocandin drugs against Candida species. Antimicrob. Agents Chemother. 54:2497–2506 [DOI] [PMC free article] [PubMed] [Google Scholar]
- 3. Andes D., et al. 2008. In vivo pharmacodynamic characterization of anidulafungin in a neutropenic murine candidiasis model. Antimicrob. Agents Chemother. 52:539–550 [DOI] [PMC free article] [PubMed] [Google Scholar]
- 4. Andes D. R., Diekema D. J., Pfaller M. A., Marchillo K., Bohrmueller J. 2008. In vivo pharmacodynamic target investigation for micafungin against Candida albicans and C. glabrata in a neutropenic murine candidiasis model. Antimicrob. Agents Chemother. 52:3497–3503 [DOI] [PMC free article] [PubMed] [Google Scholar]
- 5. Arendrup M. C., et al. 2011. National surveillance of fungemia in Denmark (2004 to 2009). J. Clin. Microbiol. 49:325–334 [DOI] [PMC free article] [PubMed] [Google Scholar]
- 6. Bodey G. P., et al. 2002. The epidemiology of Candida glabrata and Candida albicans fungemia in immunocompromised patients with cancer. Am. J. Med. 112:380–385 [DOI] [PubMed] [Google Scholar]
- 7. Clinical Laboratory Standards Institute 2008. Reference method for broth dilution antifungal susceptibility testing of yeasts, 3rd ed., approved standard M27–A3(28). Clinical Laboratory Standards Institute, Wayne, PA [Google Scholar]
- 8. D'Argenio D. Z., Schumitzky A., Wang X. 2009. ADAPT 5 user's guide: pharmacokinetic/pharmacodynamic systems analysis software. Biomedical Simulations Resource, Los Angeles, CA [Google Scholar]
- 9. Denning D. W. 2003. Echinocandin antifungal drugs. Lancet 362:1142–1151 [DOI] [PubMed] [Google Scholar]
- 10. Dowell J. A., et al. 2004. Population pharmacokinetic analysis of anidulafungin, an echinocandin antifungal. J. Clin. Pharmacol. 44:590–598 [DOI] [PubMed] [Google Scholar]
- 11. European Committee for Antimicrobial Susceptibility Testing 2008. EUCAST definitive document EDef 7.1: method for the determination of broth dilution MICs of antifungal agents for fermentative yeasts. Clin. Microbiol. Infect. 14:398–405 [DOI] [PubMed] [Google Scholar]
- 12. Georgopapadakou N. H. 2001. Update on antifungals targeted to the cell wall: focus on beta-1,3-glucan synthase inhibitors. Expert Opin. Investig. Drugs 10:269–280 [DOI] [PubMed] [Google Scholar]
- 13. Gumbo T., et al. 2007. Once-weekly micafungin therapy is as effective as daily therapy for disseminated candidiasis in mice with persistent neutropenia. Antimicrob. Agents Chemother. 51:968–974 [DOI] [PMC free article] [PubMed] [Google Scholar]
- 14. Gumbo T., et al. 2006. Anidulafungin pharmacokinetics and microbial response in neutropenic mice with disseminated candidiasis. Antimicrob. Agents Chemother. 50:3695–3700 [DOI] [PMC free article] [PubMed] [Google Scholar]
- 15. Gumbo T., et al. 2008. Population pharmacokinetics of micafungin in adult patients. Diagn. Microbiol. Infect. Dis. 60:329–331 [DOI] [PubMed] [Google Scholar]
- 16. Hope W. W., Drusano G. L. 2009. Antifungal pharmacokinetics and pharmacodynamics: bridging from the bench to bedside. Clin. Microbiol. Infect. 15:602–612 [DOI] [PubMed] [Google Scholar]
- 17. Hope W. W., et al. 2007. Effect of neutropenia and treatment delay on the response to antifungal agents in experimental disseminated candidiasis. Antimicrob. Agents Chemother. 51:285–295 [DOI] [PMC free article] [PubMed] [Google Scholar]
- 18. Horn D. L., et al. 2009. Epidemiology and outcomes of candidemia in 2019 patients: data from the prospective antifungal therapy alliance registry. Clin. Infect. Dis. 48:1695–1703 [DOI] [PubMed] [Google Scholar]
- 19. Howard S. J., et al. 2011. Pharmacokinetics and pharmacodynamics of posaconazole for invasive pulmonary aspergillosis: clinical implications for antifungal therapy. J. Infect. Dis. 203:1324–1332 [DOI] [PMC free article] [PubMed] [Google Scholar]
- 20. Kuse E. R., et al. 2007. Micafungin versus liposomal amphotericin B for candidaemia and invasive candidosis: a phase III randomised double-blind trial. Lancet 369:1519–1527 [DOI] [PubMed] [Google Scholar]
- 21. Leary R., Jelliffe R., Schumitzky A., van Guilder M. 2001. An adaptive grid, non-parametric approach to pharmacokinetic and dynamic (PK/PD) models, p. 389–394 In Proceedings of the 14th IEEE Computer Society, Bethesda, MD [Google Scholar]
- 22. Lewis J. S., Jr., Graybill J. R. 2008. Fungicidal versus fungistatic: what's in a word? Expert Opin. Pharmacother. 9:927–935 [DOI] [PubMed] [Google Scholar]
- 23. Mora-Duarte J., et al. 2002. Comparison of caspofungin and amphotericin B for invasive candidiasis. N. Engl. J. Med. 347:2020–2029 [DOI] [PubMed] [Google Scholar]
- 24. Pappas P. G., et al. 2009. Clinical practice guidelines for the management of candidiasis: 2009 update by the Infectious Diseases Society of America. Clin. Infect. Dis. 48:503–535 [DOI] [PMC free article] [PubMed] [Google Scholar]
- 25. Pappas P. G., et al. 2007. Micafungin versus caspofungin for treatment of candidemia and other forms of invasive candidiasis. Clin. Infect. Dis. 45:883–893 [DOI] [PubMed] [Google Scholar]
- 26. Park S., et al. 2005. Specific substitutions in the echinocandin target Fks1p account for reduced susceptibility of rare laboratory and clinical Candida sp. isolates. Antimicrob. Agents Chemother. 49:3264–3273 [DOI] [PMC free article] [PubMed] [Google Scholar]
- 27. Petraitiene R., et al. 1999. Antifungal activity of LY303366, a novel echinocandin B, in experimental disseminated candidiasis in rabbits. Antimicrob. Agents Chemother. 43:2148–2155 [DOI] [PMC free article] [PubMed] [Google Scholar]
- 28. Petraitis V., et al. 2002. Comparative antifungal activities and plasma pharmacokinetics of micafungin (FK463) against disseminated candidiasis and invasive pulmonary aspergillosis in persistently neutropenic rabbits. Antimicrob. Agents Chemother. 46:1857–1869 [DOI] [PMC free article] [PubMed] [Google Scholar]
- 29. Sheng B., Schwartz M. S., Desai R. B., Miller A. R., Matuszewski B. K. 2005. A semi-automated procedure for the determination of caspofungin in human plasma using solid-phase extraction and HPLC with fluorescence detection using secondary ionic interactions to obtain a highly purified extract J. Liquid Chromatogr. Related Technol. 28:2895–2908 [Google Scholar]
- 30. Slater J., et al. 2011. Disseminated candidiasis caused by Candida albicans with amino acid substitutions in Fks1 at position Ser645 cannot be successfully treated with micafungin. Antimicrob. Agents Chemother. 55:3075–3083 [DOI] [PMC free article] [PubMed] [Google Scholar]
- 31. Slavin M. A., et al. 2010. Candidaemia in adult cancer patients: risks for fluconazole-resistant isolates and death. J. Antimicrob. Chemother. 65:1042–1051 [DOI] [PubMed] [Google Scholar]
- 32. Stone J. A., et al. 2002. Single- and multiple-dose pharmacokinetics of caspofungin in healthy men. Antimicrob. Agents Chemother. 46:739–745 [DOI] [PMC free article] [PubMed] [Google Scholar]
- 33. Viscoli C., et al. 1999. Candidemia in cancer patients: a prospective, multicenter surveillance study by the Invasive Fungal Infection Group (IFIG) of the European Organization for Research and Treatment of Cancer (EORTC). Clin. Infect. Dis. 28:1071–1079 [DOI] [PubMed] [Google Scholar]
- 34. Warn P. A., et al. 2009. Pharmacokinetics and pharmacodynamics of a novel triazole, isavuconazole: mathematical modeling, importance of tissue concentrations, and impact of immune status on antifungal effect. Antimicrob. Agents Chemother. 53:3453–3461 [DOI] [PMC free article] [PubMed] [Google Scholar]


