Abstract
We describe a method for production of recombinant human hemoglobin by Escherichia coli grown in a bioreactor. E. coli BL21(DE3) transformed with a plasmid containing hemoglobin genes and Plesiomonas shigelloides heme transport genes reached a cell dry weight of 83.64 g/liter and produced 11.92 g/liter of hemoglobin in clarified lysates.
TEXT
Numerous attempts have been made to find alternatives to human blood for transfusions (for reviews, see references 2 and 5). One approach has been to produce recombinant human hemoglobin in Escherichia coli. When plasmid-encoded α and β chain genes are expressed in E. coli, assembled hemoglobin can be recovered from E. coli cells (4). A problem that must be addressed is obtaining sufficient quantities of recombinant hemoglobin to be economically feasible. When expressed in E. coli, the apoprotein and/or its subunits are unstable and are degraded by the cell unless sufficient heme is present to allow proper folding into hemoglobin (12, 13, 14).
One approach for solving this problem is to modify the hemoglobin genes so that the hemoglobin produced is more stable in E. coli (3). Another approach is to increase intracellular heme levels in an E. coli strain that expresses the hemoglobin genes by providing a heme transport system from another organism (3, 10). In this paper, we describe the development of a method to produce hemoglobin in E. coli grown in a bioreactor. We demonstrate that E. coli transformed with a plasmid containing modified hemoglobin genes and the Plesiomonas shigelloides heme transport genes grew to high cell density and produced large amounts of hemoglobin.
Development of a fed-batch procedure for E. coli BL21(DE3)/ pTHBHug.
The plasmid pTHBHug contains human hemoglobin genes with three mutations [α(G15A)β(G16A/H116I)] (3) and the P. shigelloides heme transport genes from pHUG21 (10). A fed-batch procedure was developed using a 3-liter BioFlo 110 modular benchtop fermentor (New Brunswick Scientific, Edison, NJ) controlled by BioCommand Plus software. The inoculum was grown at 36.5°C in DM-1 medium (8), and the bioreactor culture was grown in DM-4 medium (8) containing 0.2% yeast extract and 2 μg/ml tetracycline. Feed solutions were as follows. (i) An acid feed (5 M phosphoric acid) was used through the first 6 h of the run when the pH went above 6.9 and was replaced with a phosphate feed (2.4 M KH2PO4, 0.8 M K2HPO4) (9) later in the run. Addition of phosphate late in the run was required for efficient glucose uptake and utilization. (ii) A glucose feed (79.5% glucose, 0.5% yeast extract, 0.084 M MgSO4·7 H2O, 0.154 g/liter thiamine) was started 7 h into the run and continued throughout the run. (iii) A base feed (5 M NH4OH) was used until induction and then replaced with a heme feed (2.3 mM heme in 5 M NH4OH) for which the flow rate was pH controlled. Hemoglobin genes, which are controlled by a tac promoter, were induced at around 30 h by the addition of 0.4 g of isopropyl-β-d-thiogalactopyranoside (IPTG) to the bioreactor culture. Dissolved oxygen was maintained at 40%, and agitation was between 250 and 1,200 rpm. A 1:2.5 dilution of Antifoam 204 (Sigma Chemical, St. Louis, MO) with water was used to control foaming. The mass flow equation (6) was used to estimate the glucose requirements of the strain.
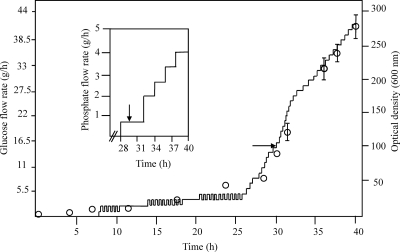
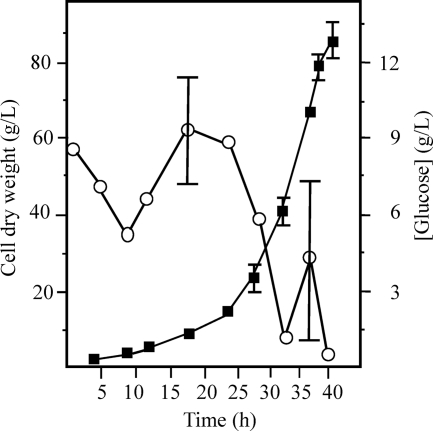
Figure 1 shows the flow rates of glucose and phosphate from a representative run and the average growth curve for cultures from three runs. The average cell density (optical density at 600 nm [OD600]) of the cultures ± standard deviation was 81.05 ± 3.64 at induction and continued to increase after induction to an average OD600 of 280.9 ± 15.08 (Fig. 1). The average final cell dry weight of the cultures ± standard deviation was 83.64 ± 3.22 g/liter (Fig. 2, filled squares). The cell dry weight values doubled from 2 h postinduction to the end of the run, indicating that induction of the hemoglobin genes did not inhibit the growth of the culture.
Fig. 1.
Growth curve for BL21(DE3)/pTHBHug and flow rates of glucose and phosphate during bioreactor runs. Solid lines on the large and small graphs indicate flow rates of glucose and phosphate, respectively, during a typical run. Circles indicate optical densities of the culture at 600 nm. The optical density results shown are an average of results from three experiments, and standard deviations below an OD of 6 are not shown. The arrows indicate the time of induction of the cultures with IPTG and the starting point of the heme/base feed.
Fig. 2.
Glucose concentrations (unfilled circles) and cell dry weights (filled squares) for cultures of BL21(DE3)/pTHBHug. The results shown are an average of results from three experiments, and standard deviations below 1.5 g/liter are not shown.
The glucose concentration in the culture as measured with an Accu-Chek Compact Plus glucose monitor (Roche, Mannheim, Germany) was maintained between 3.5 and 10.0 g/liter during the first 28 h of the run. Glucose levels below 3.5 g/liter during the first 28 h of the run correlated with plasmid loss in the cells (data not shown). Shortly after induction, the glucose level was allowed to drop below 3.5 g/liter (Fig. 2, unfilled circles). We found that if this drop in the glucose level was not permitted to occur, the culture grew poorly during the remainder of the run. This may have been due to the production of waste products such as acetic acid, which are detrimental to the health of the culture (for a review, see reference 7). The large error bar at 37.5 h in Fig. 2 is the result of one of the cultures having a glucose level of 0.4 g/liter, which was much lower than those in the two other cultures represented in the graph. This low glucose level did not result in lower growth or lower hemoglobin production (data not shown). By the end of the run, the average glucose concentration ± standard deviation was 0.25 ± 0.23 g/liter. The average final volume of the culture ± standard deviation was 1.557 ± 0.049 liter, and the average amount of heme added during the runs ± standard deviation was 0.327 ± 0.0175 g.
Hemoglobin production during bioreactor runs.
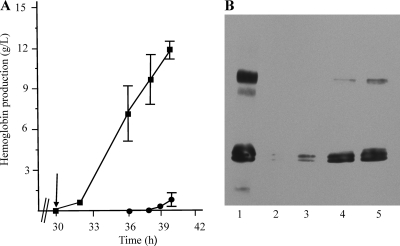
To determine hemoglobin production in clarified cell lysates, 5.0 OD600 units of culture was centrifuged at 4°C, resuspended in 0.1 M Tris, pH 7.5, that had been flushed with CO for 20 min, and centrifuged again and the pellets were frozen overnight at −75°C. The cells were resuspended in CO-flushed 0.1 M Tris, pH 8, and treated as described previously (11). The absorbance of clarified lysates was determined at a 419-nm wavelength; the absorbance of clarified lysates from the control strain BL21(DE3)/pCHug (pCHug contains only the heme transport genes) treated in the same fashion was subtracted from that value. To determine the concentration of hemoglobin, the Beer-Lambert equation was used with the molar extinction coefficient of carboxyhemoglobin (1). Hemoglobin in clarified lysates was not detectable at induction (30 h) but was detectable (at an average level ± standard deviation of 0.48 ± 0.32 g/liter) 2 h postinduction (Fig. 3 A, squares). From 32 to 36 h, soluble hemoglobin increased 14-fold to 7.1 ± 2.26 g/liter. The amount of hemoglobin at 40 h was 11.92 ± 0.62 g/liter. Looker et al. (8), using a different strain of E. coli in which no heme transport system was present, produced 0.3805 g/liter of hemoglobin in clarified lysates. Our method generated about 31-fold more hemoglobin per liter in clarified lysates. Hemoglobin from cells that had lysed late in the run was detectable at 39 h and reached an average of 0.6 ± 0.54 g/liter by the end of the run (Fig. 3A, circles).
Fig. 3.
Hemoglobin production by BL21(DE3)/pTHBHug. (A) Graph of hemoglobin produced during bioreactor runs. Squares indicate concentrations of soluble hemoglobin isolated from cells, and circles indicate concentrations of hemoglobin released from cells that lysed during the run. The results shown are an average of results from three experiments, and standard deviations below 0.5 g/liter are not shown. The arrow indicates the time of induction. (B) Immunoblot of hemoglobin produced from a representative run. Lane 1 contains a hemoglobin control at 0.285 μg. Lanes 2 to 5 contain samples taken at the following time points: 2, 30 h (induction); 3, 32 h; 4, 37.5 h; and 5, 40 h. The equivalent of 0.014 μl of culture was loaded.
Figure 3B shows an immunoblot of hemoglobin from clarified lysates of BL21(DE3)/pTHBHug during a representative run. In agreement with the data in Fig. 3A, no hemoglobin was detectable at induction (lane 2), very little hemoglobin was detected at 2 h postinduction (32 h) (lane 3), and large amounts of hemoglobin were detected at 37.5 and 40 h (lanes 4 and 5, respectively).
The work described in this paper indicates that production of recombinant hemoglobin in E. coli may be an economically viable method of obtaining therapeutic hemoglobin. Our future efforts will focus on fine-tuning of our hemoglobin production process in order to further increase hemoglobin yields and to purify and analyze hemoglobin from clarified lysates.
Acknowledgments
This work was supported by equipment funds from the University of Texas of the Permian Basin, University of Texas System Louis Stokes Alliance for Minority Participation funds, and National Institutes of Health grant 2R15HL079992-02.
We thank John Olson for the original idea of using a heme transport system to increase human hemoglobin production in E. coli, Philip Graves for providing the plasmid containing the modified hemoglobin genes which was used to make pTHBHug, and David Wilson of New Brunswick Scientific for his advice and support on operation of the bioreactor.
Footnotes
Published ahead of print on 29 July 2011.
REFERENCES
- 1. Antonini E. 1965. Interrelationship between structure and function in hemoglobin and myoglobin. Physiol. Rev. 45:123–170 [DOI] [PubMed] [Google Scholar]
- 2. Chang T. M. S. 2006. Blood substitutes based on nanobiotechnology. Trends Biochem. 24:372–377 [DOI] [PubMed] [Google Scholar]
- 3. Graves P. E., Henderson D. P., Horstman M., Solomon B., Olson J. S. 2008. Enhancing stability and expression of recombinant human hemoglobin in E. coli: progress in the development of a recombinant HBOC source. Biochem. Biophys. Acta 1784:1471–1479 [DOI] [PubMed] [Google Scholar]
- 4. Hoffman S. J., et al. 1990. Expression of fully functional tetrameric human hemoglobin in Escherichia coli. Proc. Natl. Acad. Sci. U. S. A. 87:8521–8525 [DOI] [PMC free article] [PubMed] [Google Scholar]
- 5. Inayat M. S., et al. 2006. Oxygen carriers: a selected review. Transfus. Apher. Sci. 34:25–32 [DOI] [PubMed] [Google Scholar]
- 6. Korz D. J., Rinas U., Hellmuth K., Sanders E. A., Deckwer W. D. 1995. Simple fed-batch technique for high cell density cultivation of Escherichia coli. J. Biotechnol. 39:59–65 [DOI] [PubMed] [Google Scholar]
- 7. Lee S. Y. 1996. High cell-density culture of Escherichia coli. Trends Biotechnol. 14:98–105 [DOI] [PubMed] [Google Scholar]
- 8. Looker D., Mathews A. J., Neway J. O., Stetler G. L. 1994. Expression of recombinant human hemoglobin in Escherichia coli. Methods Enzymol. 231:364–374 [DOI] [PubMed] [Google Scholar]
- 9. Rinas U., Hellmuth K., Kang R., Seeger A., Schlieker H. 1995. Entry of Escherichia coli into stationary phase is indicated by endogenous and exogenous accumulation of nucleobases. Appl. Environ. Microbiol. 61:4147–4151 [DOI] [PMC free article] [PubMed] [Google Scholar]
- 10. Villarreal D. M., et al. 2008. Enhancement of recombinant hemoglobin production in Escherichia coli BL21(DE3) containing the Plesiomonas shigelloides heme transport system. Appl. Environ. Microbiol. 74:5854–5856 [DOI] [PMC free article] [PubMed] [Google Scholar]
- 11. Weickert M. J., Pagratis M., Curry S. R., Blackmore R. 1997. Stabilization of apoglobin by low temperature increases yield of soluble recombinant hemoglobin in Escherichia coli. Appl. Environ. Microbiol. 63:4313–4320 [DOI] [PMC free article] [PubMed] [Google Scholar]
- 12. Weickert M. J., Curry S. R. 1997. Turnover of recombinant human hemoglobin in Escherichia coli occurs rapidly for insoluble and slowly for soluble globin. Arch. Biochem. Biophys. 348:337–346 [DOI] [PubMed] [Google Scholar]
- 13. Weickert M. J., Apostol I. 1998. High-fidelity translation of recombinant human hemoglobin in Escherichia coli. Appl. Environ. Microbiol. 64:1589–1593 [DOI] [PMC free article] [PubMed] [Google Scholar]
- 14. Weickert M. J., Pagratis M., Glascock C. B., Blackmore R. 1999. A mutation that improves soluble recombinant hemoglobin accumulation in Escherichia coli in heme excess. Appl. Environ. Microbiol. 65:640–647 [DOI] [PMC free article] [PubMed] [Google Scholar]


