Abstract
The mechanisms underlying the association between obesity and progressive renal disease are not well understood. Exposure to a high-fat diet decreases levels of the cellular energy sensor AMPK in many organs, including the kidney, but whether AMPK contributes to the pathophysiology of kidney disease induced by a high-fat diet is unknown. In this study, we randomly assigned C57BL/6J mice to a standard or high-fat diet. After 1 week, mice fed a high-fat diet exhibited an increase in body weight, renal hypertrophy, an increase in urine H2O2 and urine MCP-1, and a decrease in circulating adiponectin levels and renal AMPK activity. Urine ACR progressively increased after 4 weeks of a high-fat diet. After 12 weeks, kidneys of mice fed a high-fat diet demonstrated a marked increase in markers of fibrosis and inflammation, and AMPK activity remained significantly suppressed. To determine whether inhibition of AMPK activity explained these renal effects, we administered an AMPK activator along with a high-fat diet for 1 week. Although AMPK activation did not abrogate the weight gain, it reduced the renal hypertrophy, urine H2O2, and urine and renal MCP-1. In vitro, AMPK activation completely inhibited the induction of MCP-1 by palmitic acid in mesangial cells. In conclusion, these data suggest that the energy sensor AMPK mediates the early renal effects of a high-fat diet.
Obesity has been dramatically increasing in the United States and worldwide. Between 1999 and 2004, 32.2% of all adults in the United States were obese (body mass index > 30 kg/m2)1 and the prevalence of obesity is expected to reach 50% by 2030. Obesity is the major risk factor for the metabolic syndrome, characterized by insulin resistance, dyslipidemia, and hypertension.2 Obesity in association with insulin resistance contribute to the development of cardiovascular disease and diabetes. Furthermore, obesity is now being increasingly recognized as a major and independent risk factor for the development of kidney disease.3–5 In the general population, obesity was the second most highly predictive factor to predict ESRD, even independent of diabetes and hypertension.6 Clinical and experimental studies have demonstrated that the characteristic features of obesity-induced kidney injury include glomerular hypertrophy, thickening of the glomerular basement membrane, mesangial matrix expansion, and increased renal inflammation.7–10 These alterations likely contribute to albuminuria, a progressive decline in renal function and ultimately glomerulosclerosis and tubulointerstitial fibrosis.7–10 Despite the public health and clinical implications of the relationships between obesity and kidney injury, the signaling pathways leading to renal pathology with obesity are not well understood.
In a prior study, our group identified that low levels of circulating adiponectin, an adipocyte-specific hormone that is reduced in insulin-resistant obese patients, correlate with low-grade albuminuria in obese African Americans and that the adiponectin knockout mouse developed low-grade albuminuria without co-existent obesity, hypertension, or hyperglycemia.11 Adiponectin has a protective effect on podocytes primarily via stimulating the enzyme AMP-activated protein kinase (AMPK). AMPK is an ubiquitous heterotrimeric enzyme that is considered to be the master energy sensor in all eukaryotic cells.12 AMPK has been reported to be reduced in various organs, including the kidney after exposure to a high-fat diet; however, the role of AMPK in mediating HFD-induced kidney disease has not been evaluated.13,14 To define the renal response in relation to obesity we utilized a high-fat diet (HFD) induced obesity model and tested the hypothesis that AMPK is a key pathway by which a HFD contributes to the initial manifestations of kidney disease.
RESULTS
HFD Induces Obesity, Hyperglycemia, Insulin Resistance, and Kidney Hypertrophy
Table 1 illustrates the changes in body weight, blood glucose, kidney weight, plasma insulin, and adiponectin levels in mice fed a HFD compared with mice fed a standard diet (STD) at week 1 and 12 of the experimental protocol. We observed a significant increase in body weight and kidney weight as early as 1 week on the HFD. The level of plasma glucose and insulin were unchanged after 1 week but were significantly higher in HFD mice at week 12. In contrast, the circulating adiponectin level was significantly lower at week 1 in HFD mice, whereas at week 12 circulating adiponectin was similar with HFD and STD.
Table 1.
Characterization of mice fed STD or HFD
| STD Week 1 | HFD Week 1 | STD Week 12 | HFD Week 12 | |
|---|---|---|---|---|
| Body weight, g | 20.89 ± 0.78 | 25.26 ± 0.94a | 27.68 ± 0.80 | 41.68 ± 0.77b |
| Plasma glucose level, mg/dl | 156.5 ± 8.5 | 172.3 ± 6.5 | 147.3 ± 8.3 | 203.3 ± 12.1b |
| Kidney weight, g | 0.285 ± 0.01 | 0.343 ± 0.01a | 0.300 ± 0.008 | 0.410 ± 0.012b |
| Kidney weight, g/mm of tibia length | 0.0162 ± 0.0007 | 0.0194 ± 0.0006a | 0.0151 ± 0.0005 | 0.0212 ± 0.0010b |
| Adiponectin, μg/ml | 13.53 ± 1.36 | 9.75 ± 1.36a | 14.14 ± 0.93 | 17.97 ± 1.98 |
| Plasma insulin, ng/ml | 0.53 ± 0.07 | 1.03 ± 0.22 | 0.45 ± 0.02 | 13.53 ± 0.22b |
Values are means ± SEM. n = 5 in each group. Statistical analyses were performed by unpaired t test.
aP ≤ 0.05 versus mice on STD week 1.
bP ≤ 0.05 versus mice on STD week 12.
Effect of HFD on Glomerular Histology
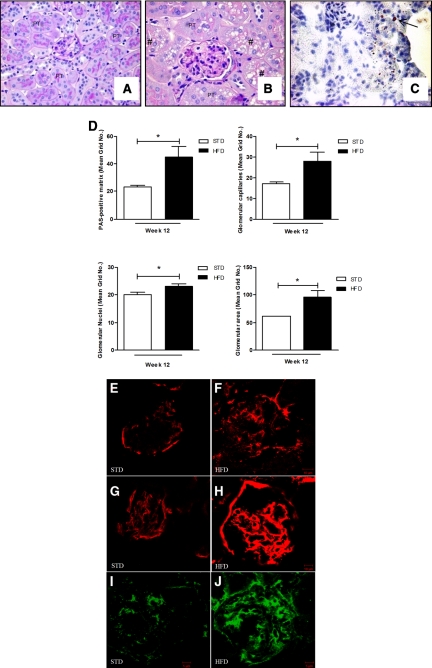
At week 12, the HFD mice demonstrated an overall increase of glomerular area (Figure 1, A, B, and D). The increase in glomerular area was contributed by an accumulation of Periodic-Acid-Schiff (PAS)-positive matrix in the mesangium, an increase of nuclei, and an increase of glomerular filtration surface area (Figure 1D). There was an overall increase in vacuolated cells and some were positively stained by the oil-red O method (Figure 1, B and C). There was a robust increase in glomerular matrix because fibronectin, collagen type I, and collagen type IV were all greatly increased in the glomeruli of mice fed a HFD (Figure 1, F, H, and J). However, no morphologic changes were observed in the kidney after 1 week on a HFD (data not shown).
Figure 1.
HFD increases glomerular area and matrix accumulation. (A, B) Mice fed a HFD displayed large glomeruli and vacuolated cytoplasm (#). (C) Oil-red O staining on kidney sections on a HFD at 12 weeks: arrow shows the accumulated neutral lipid. (D) Quantitative analysis of glomeruli demonstrates increased mesangial matrix expansion, capillary filtration area, nuclei, and overall surface area. Immunofluorescence microscopy of cortical sections demonstrates increased collagen type I (E, F), collagen type IV (G, H), and fibronectin (I, J) in mice fed a HFD (F, H, and J) versus a STD (E, G, and I) for 12 weeks. Values are means ± SEM. n = 5 in each group. Statistical analyses were performed by unpaired t test *P ≤ 0.05 versus mice on STD. PT, proximal tubule.
Urinary Markers of Inflammation Precede Albuminuria with HFD
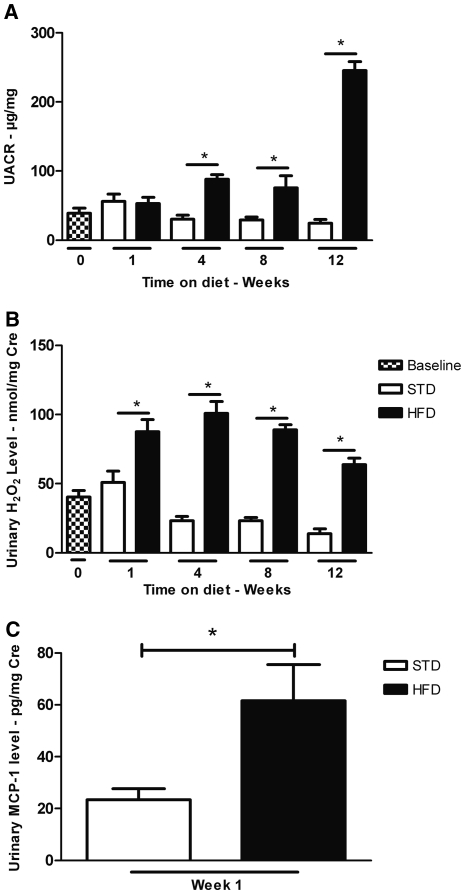
To determine the time course by which HFD may affect markers of renal inflammation, we examined urine albumin and urine hydrogen peroxide (H2O2) levels in mice at weeks 1, 4, 8, and 12 with HFD compared with STD (Figure 2). As illustrated, the degree of albuminuria in HFD mice increased 3-fold at 4 and 8 weeks and increased to 10-fold at week 12 compared with STD (245.2 ± 13.0 versus 24.4 ± 5.3 μg albumin/mg creatinine). At 1 week, however, the degree of albuminuria was the same in HFD and STD mice (Figure 2A). In contrast, the urinary H2O2 level was significantly higher as early as 1 week after HFD (Figure 2B). The increase in urine H2O2 was maintained and remained significantly increased throughout the 12-week period. In addition, at 1 week, the urine excretion of monocyte chemoattractant protein-1 (MCP-1) was significantly higher in HFD mice compared with the STD mice (Figure 2C).
Figure 2.
HFD increases urine albumin, H2O2 and MCP-1. (A) Urine albumin/creatinine ratio (UACR) increases with HFD at 4, 8, and 12 weeks. (B) Urine H2O2/creatinine level in mice on a HFD increases by 1 week and remains elevated during the 12-week period. (C) Urine MCP-1/creatinine level is increased in mice fed a HFD for 1 week. Values are means ± SEM. n = 5 in each group. Statistical analyses were performed by one-way ANOVA followed by Newman–Keuls test (A, B) *P ≤ 0.05 versus mice on a STD at corresponding time point.
Effect of HFD on Renal Gene Expression
To evaluate the effect of a HFD on candidate genes involved in renal inflammation and fibrosis, the mRNA expression of proinflammatory and fibrotic markers was measured by real-time PCR. As observed in Table 2, renal cortical mRNA levels of the proinflammatory markers (TNFα, IL-1β, IL-6, MCP-1, macrophage inflammatory protein [MIP]-1α, NADPH oxidase 2 [Nox2], p22phox [neutrophil cytochrome B, 22 kDa polypeptide]) as well as the profibrotic markers (TGF-β1, fibronectin, collagen type 1 and IV) were all significantly increased after 12 weeks on the HFD. TGF-β1 mRNA expression was the most highly stimulated of the profibrotic markers. The greatest increases of the inflammatory markers were IL-6 and the macrophage chemoattractants (MCP-1 and MIP).
Table 2.
Effects of HFD on renal gene expressions at week 12 of experimental protocol
| STD | HFD | |
|---|---|---|
| Proinflammatory markers | ||
| TNFα | 1.00 ± 0.20 | 3.82 ± 0.63a |
| IL-6 | 1.00 ± 0.27 | 9.54 ± 3.61a |
| MCP-1 | 1.00 ± 0.26 | 7.53 ± 2.32a |
| MIP-1α | 1.00 ± 0.25 | 7.70 ± 2.74a |
| IL-1β | 1.00 ± 0.35 | 2.24 ± 0.49a |
| Nox2 | 1.00 ± 0.21 | 3.45 ± 0.42a |
| p22phox | 1.00 ± 0.29 | 3.59 ± 0.29a |
| Profibrotic markers | ||
| TGF-β1 | 1.00 ± 0.23 | 11.01 ± 0.86a |
| fibronectin | 1.00 ± 0.23 | 1.93 ± 0.22a |
| collagen type I | 1.00 ± 0.38 | 3.30 ± 0.67a |
| collagen type IV | 1.00 ± 0.19 | 5.40 ± 0.35a |
Quantitative real-time PCR was performed with kidney cortex from both groups each normalized against β-actin. Values are means ± SEM. n = 5 in each group. Statistical analyses were performed by unpaired t test.
aP ≤ 0.05 versus mice on STD.
AMPK Activity Is Reduced with HFD
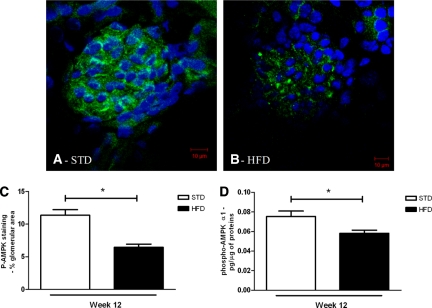
To determine whether renal AMPK activity is affected by the HFD, the degree of AMPKα Thr 172 phosphorylation was performed by immunostaining and confocal analysis, and overall AMPK activity was measured by ELISA in the renal cortex (Figure 3). The phosphorylated AMPK (p-AMPK) staining of glomerular sections in the two groups revealed that the HFD caused a marked decrease of p-AMPK in glomeruli compared with the STD at week 12 (Figure 3A through 3C). There was also a quantitative reduction of AMPK activity in the renal cortices of the HFD mice (Figure 3D).
Figure 3.
Renal p-AMPK is reduced with HFD at 12 weeks. Representative photomicrographs of p-AMPK staining (green color) in glomeruli from mice on a (A) STD or (B) HFD. The nuclei were stained using DAPI (blue color). Semiquantitative analysis of p-AMPK-positive staining per glomerular area (C) and quantitative analysis of p-AMPK level in the protein extractions from renal cortex (D) at week 12 of experimental protocol. Values are means ± SEM. n = 5 in each group. Statistical analyses were performed by unpaired t test. *P ≤ 0.05 versus mice on STD.
Role of AMPK in the Early Renal Changes of Mice Fed a HFD
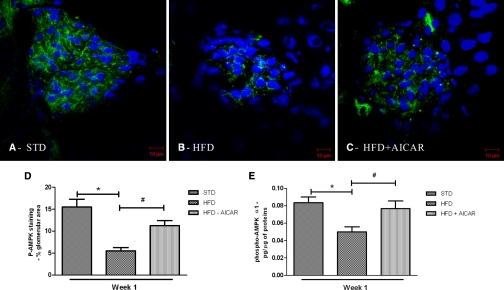
On the basis of our time-course studies, it was apparent that markers of inflammation (urine H2O2 and urine MCP-1) preceded development of albuminuria. We hypothesized that AMPK inhibition would occur within days after institution of a high caloric diet and therefore we performed a second study to determine the role of AMPK in the early renal effects of HFD. Mice on the HFD were treated with a specific activator of AMPK, 5-aminoimidazole-4-carboxamide-1-β-D-ribonucleoside (AICAR) for 1 week. As illustrated in Figure 4, AMPK activity was reduced in the kidney and glomeruli after 1 week of HFD (Figure 4A through 4D) and was increased with AICAR treatment. AICAR treatment did not prevent the increase in body weight with HFD (Table 3). Despite the lack of change in body weight gain, kidney hypertrophy was completely prevented in HFD mice treated with AICAR at week 1 (Table 3). Interestingly, the reduced plasma adiponectin level with HFD was also completely prevented by AICAR treatment. As shown in Table 3, AICAR administration in mice fed a STD did not affect the body weight, kidney weight, or plasma adiponectin level.
Figure 4.
Renal p-AMPK is reduced with HFD at 1 week and increased with AICAR. Representative photomicrographs of p-AMPK (green) staining in glomeruli from mice on a (A) STD, (B) HFD, or (C) HFD + AICAR for 1 week. Nuclei were stained using DAPI (blue color). Semiquantitative analysis of p-AMPK-positive staining per glomerular area (D), and quantitative analysis of p-AMPK level in the protein extractions from renal cortex (E) at week 1. Values are means ± SEM. n = 6 in each group. Statistical analyses were performed by one-way ANOVA followed by Newman–Keuls test. *P ≤ 0.05 versus mice on STD; #P ≤ 0.05 versus mice on HFD.
Table 3.
Characterization of mice with 1 week of STD, HFD, and STD, HFD + AICAR
| STD | STD-AICAR | HFD | HFD-AICAR | |
|---|---|---|---|---|
| Body weight, g | 21.30 ± 0.70 | 22.50 ± 0.35 | 24.77 ± 0.54a,b | 23.75 ± 0.52a |
| Plasma glucose level, mg/dl | 175.7 ± 9.6 | 151.3 ± 8.4 | 190.7 ± 8.6 | 178.9 ± 10.5 |
| Kidney weight, g | 0.259 ± 0.013 | 0.2665 ± 0.005 | 0.290 ± 0.005a | 0.265 ± 0.004 |
| Kidney weight, g/mm of tibia length | 0.0138 ± 0.0009 | 0.0136 ± 0.0003 | 0.0160 ± 0.0004a,b | 0.0138 ± 0.0003c |
| Adiponectin, μg/ml | 15.12 ± 2.02 | 16.13 ± 1.66 | 8.54 ± 0.89a,b | 18.45 ± 3.94c |
Values are means ± SEM. n = 6 in each group. Statistical analyses were performed by one-way ANOVA followed by Newman–Keuls test.
aP ≤ 0.05 versus mice on STD
bP ≤ 0.05 versus mice on STD-AICAR.
cP ≤ 0.05 versus mice on HFD.
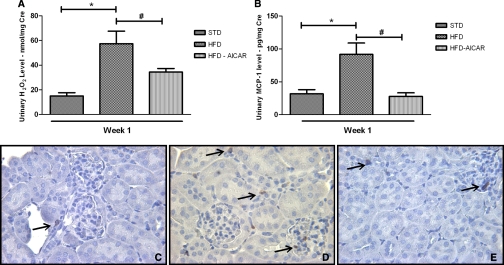
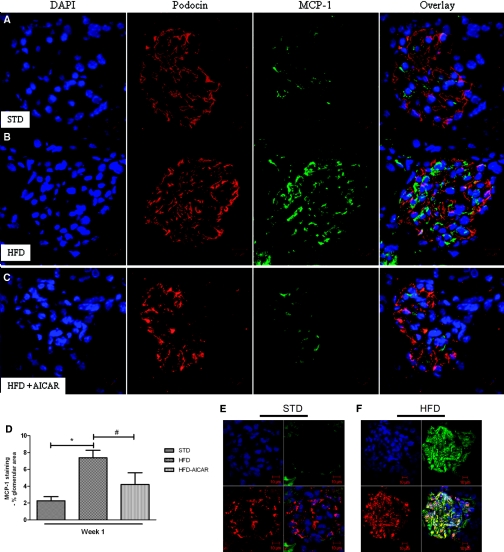
AMPK activation prevented the increase in urine H2O2 and urine MCP-1 with HFD (Figure 5, A and B). The increased macrophage infiltration observed in mice fed a HFD (Figure 5, C and D) was prevented by the AICAR treatment (Figure 5E). Of the genes that were stimulated with prolonged HFD, only MCP-1 gene expression was significantly increased in mice fed HFD for 1 week (Table 4). Localization of MCP-1 in glomeruli was assessed using confocal analysis. MCP-1 protein was increased in the glomeruli after 1 week of HFD and reduced with AICAR (Figure 6A through 6D). Of note, colocalization of MCP-1 with the podocyte marker podocin (Figure 6A through 6C) was less than 30% (0.29 ± 0.06 for STD mice; 0.21 ± 0.04 for HFD mice, and 0.24 ± 0.08 for HFD + AICAR mice, P = NS). To determine whether MCP-1 was colocalized on the mesangial cells, megsin antibody (marker of mesangial cells) was used (Figure 6, E and F). As illustrated, MCP-1 protein was increased in mesangial cells in mice fed a HFD (Figure 6F) (Pearson coefficient: 0.19 ± 0.02 [STD] and 0.54 ± 0.03 [HFD], P < 0.05).
Figure 5.
Urine markers of inflammation with HFD are reduced by AMPK activation. (A) Urine H2O2/creatinine level (A) and (B) urine MCP-1/creatinine level in mice fed a STD, HFD, or HFD + AICAR for 1 week. Values are means ± SEM. n = 6 in each group. Statistical analyses were performed by one-way ANOVA followed by Newman–Keuls test *P ≤ 0.05 versus mice on STD; #P ≤ 0.05 versus mice on HFD. Representative photomicrographs of macrophage staining in cortex from mice on a (C) STD, (D) HFD, or (E) HFD + AICAR.
Table 4.
Effects of AMPK activation on renal inflammatory gene expression
| Proinflammatory Cytokines | STD | STD-AICAR | HFD | HFD-AICAR |
|---|---|---|---|---|
| TNFα | 1.00 ± 0.07 | 1.39 ± 0.19 | 1.40 ± 0.23 | 1.17 ± 0.17 |
| IL-6 | 1.00 ± 0.28 | 1.17 ± 0.39 | 1.36 ± 0.27 | 0.75 ± 0.19 |
| MCP-1 | 1.00 ± 0.38 | 1.13 ± 0.44 | 2.82 ± 0.55a,b | 1.31 ± 0.43c |
| MIP-1α | 1.00 ± 0.31 | 1.14 ± 0.34 | 1.56 ± 0.40 | 1.86 ± 0.48 |
| IL-1β | 1.00 ± 0.33 | 1.14 ± 0.26 | 0.69 ± 0.08 | 1.05 ± 0.33 |
Quantitative real-time PCR was performed with kidney cortex from all groups, each normalized against β-actin. Values are means ± SEM. n = 6 in each group. Statistical analyses were performed by one-way ANOVA followed by Newman–Keuls test.
aP ≤ 0.05 versus mice on STD.
bP ≤ 0.05 versus mice on STD-AICAR.
cP ≤ 0.05 versus mice on HFD.
Figure 6.
Increased glomerular MCP-1 with HFD is reduced with AMPK activation. Representative photomicrographs of glomeruli from mice on a (A) STD, (B) HFD, or (C) HFD + AICAR, and (D) semiquantitative analysis of MCP-1-positive staining per glomerular area at week 1. Colocalization of glomerular MCP-1 in mesangial cells. Representative photomicrographs of glomeruli from mice on a (E) STD or (F) HFD at week 12. Megsin (red)/MCP-1 (green); nuclei (blue). Values are means ± SEM. n = 6 in each group. Statistical analyses were performed by one-way ANOVA followed by Newman–Keuls test. *P ≤ 0.05 versus mice on STD; #P ≤ 0.05 versus mice on HFD.
AMPK Activation Prevents MCP-1 Production in Mesangial Cells
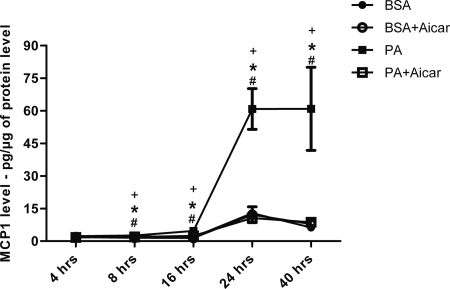
To determine if AMPK mediates high-fat induced MCP-1 production, mesangial cells in culture were stimulated with palmitic acid (PA) and MCP-1 was measured in the conditioned media at 4, 8, 16, 24, and 40 hours after stimulation (Figure 7). Mesangial cells exhibited a dramatic increase in MCP-1 expression with PA treatment in a dose- and time-dependent pattern. The peak effect of MCP-1 production was demonstrated between 24 and 40 hours. At each time point, treatment with AICAR completely prevented the PA-stimulated production of MCP-1.
Figure 7.
Stimulation of MCP-1 with palmitic acid (PA) in mesangial cells is blocked by AMPK activation. Quantitative analysis of MCP-1 level measured in the conditioned media of murine mesangial cells (MMC) at 4, 8, 16, 24, and 40 hours after stimulation by PA. Values are means ± SEM. n = 4 in each group. Statistical analyses were performed by one-way ANOVA followed by Newman–Keuls test. *P ≤ 0.05 versus BSA; #P ≤ 0.05 versus BSA + AICAR; +P ≤ 0.05 versus PA + AICAR.
DISCUSSION
Obesity is a major risk factor for renal disease progression and can cause de novo glomerulopathy. Obesity-related renal disease has been characterized by proteinuria, glomerulomegaly, and glomerulosclerosis. Increased body mass index and high fat intake have been associated with onset and progression of renal disease.6,15 In this study we show that high fat feeding has dramatic effects in a time-dependent manner. Even after just 1-week exposure to HFD, there was an increase in body weight, a reduction of plasma adiponectin, and renal inflammation. The early renal inflammatory response was limited to elevated levels of MCP-1 and urinary H2O2 and preceded the progressive increase in urine albumin. AMPK activity was decreased within 1 week of high fat exposure, and AMPK activation with AICAR was able to completely block the early onset of the renal inflammatory response to HFD. Taken together, the study likely has relevance to features of the human metabolic syndrome and provides insight into the mechanisms underlying obesity-related low-grade renal inflammation and albuminuria.16
AMPK is a ubiquitous heterotrimeric kinase consisting of a catalytic α subunit and regulatory β and γ subunits, and it is abundantly expressed in the kidney.17,18 As a cellular energy sensor, its activity is highly linked to the change in the intracellular AMP/ATP ratio. Increase of the AMP/ATP ratio stimulates AMPK activity whereas an increase of ATP level results in its inhibition.19 Hence, its activation results in a change of energy utilization involving the stimulation of energy-producing pathways to restore energy balance.20 Metabolic stress conditions such as diabetes or obesity modulate the activity of AMPK. The mechanism of AMPK reduction in renal cells exposed to HFD has not been evaluated, but it could be due to a change in AMP/ATP ratios or other upstream modulators of AMPK activity, such as LKB-1(liver kinase B-1), and CaMKK (calcium calmodulin-dependent protein kinase kinase).20,21 Renal AMPK activity has previously been reported to be reduced after a HFD for 16 weeks22; however, its role in mediating renal inflammation was not evaluated. We had previously found that AMPK activity was reduced in the glomeruli in adiponectin knockout mice and that glomerular AMPK was stimulated by adiponectin.11 In the study presented here, we identified that renal AMPK activity was reduced in association with adiponectin reduction during the early stage of HFD-induced kidney disease; however, AMPK reduction persisted despite an increase in adiponectin during the chronic stage of HFD-induced kidney disease. It is possible that the initial increase in visceral adiposity and inflammation contributes to the reduced adiponectin level, but the mouse is able to compensate and increases adiponectin levels with chronic HFD.
To demonstrate the functional role of AMPK, AICAR was administered with HFD concurrently for 1 week. AICAR is taken up into the cells where it is phosphorylated to 5-aminoimidazole-4-carboxamide-1-β-D-furanosyl 5′-monophosphate and mimics the effect of AMP to activate AMPK.23 AICAR administration increased AMPK activity in the kidney and reduced renal hypertrophy despite the persistent increase in body weight with HFD. Moreover, the early reduction in plasma adiponectin level with HFD was completely prevented by AICAR treatment, demonstrating a potential role of AMPK on adipocyte production or release of adiponectin. In support of our in vivo observation, a prior study found that AICAR was able to directly increase gene expression of adiponectin in human adipocytes in vitro.24 Nevertheless, the beneficial effects of AMPK activation are likely independent of adiponectin because we found that AICAR treatment of mice with adiponectin deficiency conferred a renoprotective effect associated with stimulation of glomerular AMPK.11
An important and early consequence of HFD-induced AMPK inhibition in the kidney is upregulation of MCP-1. Renal MCP-1 was increased as early as 1 week after HFD at the gene expression level, in the glomerulus by immunostaining, and in the urine. Interestingly, of the proinflammatory markers measured, only MCP-1 was increased at the early stage of HFD-induced kidney disease. The role of MCP-1 and its receptor, chemokine (C-C motif) receptor 2 (CCR2), has received greater recognition for its role in mediating chronic kidney disease.25–27 Recently, MCP-1 was found to regulate nephrin expression via chemokine receptor 2 in human podocytes, and mice lacking MCP-1 had resistance to diabetes-induced albuminuria.28 The role of MCP-1 as a mediator of insulin resistance has also been considered, although there are conflicting reports whether MCP-1 deficiency protects against insulin resistance with a HFD.29,30
The major cellular source of glomerular MCP-1 with HFD remains unclear. Although podocytes are a source of MCP-1, our results suggest that mesangial and glomerular endothelial cells are also an important source of MCP-1 production with HFD. Studies in mesangial cells demonstrate a marked stimulation of MCP-1 secretion by PA, suggesting that exposure of circulating saturated fatty acids, such as PA, may be a trigger of glomerular MCP-1 production in the setting of HFD and obesity. We showed that the early increase in glomerular MCP-1 would contribute to the subsequent recruitment of macrophages that would then contribute to enhanced release of proinflammatory (TNFα, IL-6, IL-1, Nox2) and profibrotic factors (TGF-β). An additional pathway by which MCP-1 may enhance albuminuria is by a local paracrine effect on podocytes. MCP-1-induced podocyte motility may affect podocyte function31 and contribute to nephrin reduction and subsequent albuminuria. Finally, we demonstrated that AMPK activation is able to inhibit MCP-1 stimulation in vivo with HFD and in vitro in response to palmitic acid. The mechanism by which AMPK activation inhibits MCP-1 in renal cells is unclear, but it may be due to inhibition of nuclear factor-κB activation. AMPK has recently been shown to affect the proteolysis of inhibitor of κB in endothelial cells and regulate nuclear factor-κB.32 Although systemic AMPK activation has multiple beneficial effects to reduce systemic inflammation and improve insulin resistance, there may well be renal-specific responses to AMPK activation that are renoprotective. Hypertension, stimulation of the renin-angiotensin-aldosterone system, and reduced endothelial nitric oxide synthase may all contribute to the renal alterations with HFD; however, these parameters were not evaluated in the study presented here. Of note, systolic BP was increased only after 8 weeks of HFD10 and may therefore may not play a major role in the very early changes noted after 1 week of HFD.
In summary, our studies demonstrate that the kidney is an early responder to the challenge of high fat feeding. The kidney exhibits an initial programmed inflammatory response, initially characterized by increased MCP-1 and urine H2O2, followed by a subsequent robust inflammatory and fibrotic response at the gene expression, histologic, and functional level. The central energy sensor, AMPK, plays a critical role in regulating the initial response in the kidney. Specific AMPK activation in the kidney would therefore be a potential approach to protect the kidney from the early effects of obesity and insulin resistance.
CONCISE METHODS
Animals
C57BL/6 mice were purchased from Jackson Laboratory (Bar Harbor, ME). All animal procedures were approved by the Institutional Animal Care and Use Committee of the University of California San Diego. Six-week-old mice were fed a HFD (60% of total calories from fat, 20% protein, 20% carbohydrate) (Research Diets, New Brunswick, NJ) or STD (5% fat, 24.5% protein) for 1 and 12 weeks. Mice were placed in metabolic cages for 24-hour urine collection at baseline and after week 1, 4, 8, and 12, and body weight and the blood glucose were also measured at those time points. Mice were sacrificed after 1 or 12 weeks on the diet. Blood samples were collected and portions of kidneys were snap-frozen in liquid nitrogen for RNA and protein isolation. An additional portion was frozen in OCT or fixed in 4% paraformaldehyde for immunostaining.
Animal Study
Mice were treated with AICAR (Toronto Chemicals) with a single daily intraperitoneal dose of 0.5 mg/g body weight for 7 days and then sacrificed. The control animals were given PBS alone. Twenty-four-hour urines from each mouse were collected before treatment and on the last day of the treatment period.
Cell Culture Design
Murine mesangial cells33 were grown in DMEM (glucose 5.5 mM), 10% heat-inactivated FBS (Atlanta Biologicals, Lawrenceville, GA), 100 U/ml penicillin G, 100 μg/ml streptomycin, and 2 mM l-glutamine (Life Technologies, Invitrogen). One day before treatment with AICAR, BSA, or PA, cells were plated in 12-well plates (0.2 × 10⁶ cells/well) in DMEM (5.5 mM glucose) and 0.5% FBS. PA-BSA was prepared as described previously.34 The next day, cells were treated with AICAR, BSA, or PA as described.34
Urine and Plasma Data
The urine albumin and creatinine were measured with a mouse Albuwell ELISA kit and a Creatinine Companion kit (Exocell). As an index of oxidative stress, urine samples were also analyzed for H2O2 by Amplex red assay (Invitrogen) following the manufacturer's protocol. Plasma insulin and adiponectin levels were determined by ELISA kits (Millipore). The level of MCP-1 was measured with an ELISA kit (BD OptEIA Mouse MCP-1, BD Biosciences) following the manufacturer's protocol.
p-AMPKα1 Activity
The level of activated AMPK-α1 in renal cortex tissue was determined by a sandwich ELISA to measure AMPK-α1 phosphorylated at T174 (R&D Systems, Minneapolis, MN).
Quantitative Real-Time PCR
Real-time PCR was performed on cortex homogenates as described previously35 using the primers for Nox2, p22phox, TNFα, MCP-1, IL-6, MIP-1α, IL-1β, α1-type I collagen, α1-type IV collagen, fibronectin, TGF-β1, and β-actin as a housekeeping gene.
Morphologic Analysis
Morphometry of sections of kidneys was carried out as previously reported.36 Briefly, 25 randomly selected glomeruli in the outer cortex of each kidney section were evaluated in a blinded manner. An image of each glomerulus was overlaid with grids. Each grid intersection was determined for the following features: capillary lumen, periodic-acid–Schiff-positive mesangial area, and nuclear number. The accumulation of all of the grid intersections was calculated for overall glomerular area.
Immunofluorescence and Oil-Red O Staining
Immunofluorescence was performed with the following primary antibodies: goat polyclonal anti-fibronectin (BD Biosciences), goat anti-type I collagen (SouthernBiotech), goat anti-type IV collagen (SouthernBiotech), and rabbit monoclonal anti-p-AMPKα (Thr172) (Cell Signaling Technology); overlay studies were carried out with the anti-MCP-1 rabbit polyclonal antibody (Abcam) using the podocyte-specific mouse anti-podocin antibody or the mesangial cell-specific marker anti-megsin antibody (Santa Cruz). Slides were observed with a confocal LSM 510 microscope (Zeiss), and representative photographic images were performed at a magnification of 63×. For each antibody, there were at least five mice per group. Neutral lipid accumulation was evaluated on frozen section using Oil-red O staining.
Immunohistochemistry
Immunostaining of macrophages on paraffin-embedded mouse kidneys was performed using rat anti-CD43 antibody (BD Biosciences). Quantitation of CD43-positive cells was performed using a high-power magnification (400×) on ten fields randomly taken in the cortex area from five mice per group.
Statistical Analysis
Results are presented as mean values ± SEM. The level for statistical significance was defined as P < 0.05. Analyses were carried out using Graph Pad Prism Software version 4.03. Difference between data groups were evaluated for significance using independent t test of data or one-way ANOVA and Newman–Keuls post hoc test for multiple comparisons.
DISCLOSURES
None.
Supplementary Material
Acknowledgments
These studies were conducted with grants from the National Institutes of Health (R01 DK 053867 and U01 DK 060995), Veterans Merit Award, and the Juvenile Diabetes Research Foundation (to K.S.). These studies were performed with the support of the Department of Veterans Affairs Career Development Transition Award, the Veterans Affairs Merit Award, and the University of California San Diego Senate Grant awarded to R.C.
Footnotes
Published online ahead of print. Publication date available at www.jasn.org.
Supplemental information for this article is available online at http://www.jasn.org/.
REFERENCES
- 1. Ogden CL, Carroll MD, Curtin LR, McDowell MA, Tabak CJ, Flegal KM: Prevalence of overweight and obesity in the United States, 1999–2004. JAMA 295: 1549–1555, 2006 [DOI] [PubMed] [Google Scholar]
- 2. Bruce KD, Byrne CD: The metabolic syndrome: Common origins of a multifactorial disorder. Postgrad Med J 85: 614–621, 2009 [DOI] [PubMed] [Google Scholar]
- 3. Praga M, Morales E: Obesity, proteinuria and progression of renal failure. Curr Opin Nephrol Hypertens 15: 481–486, 2006 [DOI] [PubMed] [Google Scholar]
- 4. Wang Y, Chen X, Song Y, Caballero B, Cheskin LJ: Association between obesity and kidney disease: A systematic review and metaanalysis. Kidney Int 73: 19–33, 2008 [DOI] [PubMed] [Google Scholar]
- 5. Kincaid-Smith P: Hypothesis: Obesity and the insulin resistance syndrome play a major role in end-stage renal failure attributed to hypertension and labelled ‘hypertensive nephrosclerosis’. J Hypertens 22: 1051–1055, 2004 [DOI] [PubMed] [Google Scholar]
- 6. Hsu CY, McCulloch CE, Iribarren C, Darbinian J, Go AS: Body mass index and risk for end-stage renal disease. Ann Intern Med 144: 21–28, 2006 [DOI] [PubMed] [Google Scholar]
- 7. Pai R, Kirschenbaum MA, Kamanna VS: Low-density lipoprotein stimulates the expression of macrophage colony-stimulating factor in glomerular mesangial cells. Kidney Int 48: 1254–1262, 1995 [DOI] [PubMed] [Google Scholar]
- 8. Coimbra TM, Janssen U, Gröne HJ, Ostendorf T, Kunter U, Schmidt H, Brabant G, Floege J: Early events leading to renal injury in obese Zucker (fatty) rats with type II diabetes. Kidney Int 57: 167–182, 2000 [DOI] [PubMed] [Google Scholar]
- 9. Wu Y, Liu Z, Xiang Z, Zeng C, Chen Z, Ma X, Li L: Obesity-related glomerulopathy: Insights from gene expression profiles of the glomeruli derived from renal biopsy samples. Endocrinology 147: 44–50, 2006 [DOI] [PubMed] [Google Scholar]
- 10. Deji N, Kume S, Araki S, Soumura M, Sugimoto T, Isshiki K, Chin-Kanasaki M, Sakaguchi M, Koya D, Haneda M, Kashiwagi A, Uzu T: Structural and functional changes in the kidneys of high-fat diet-induced obese mice. Am. J Physiol Renal Physiol. 296: F118–F126, 2009 [DOI] [PubMed] [Google Scholar]
- 11. Sharma K, Ramachandrarao S, Qiu G, Usui HK, Zhu Y, Dunn SR, Ouedraogo R, Hough K, McCue P, Chan L, Falkner B, Goldstein BJ: Adiponectin regulates albuminuria and podocyte function in mice. J Clin Invest 118: 1645–1656, 2008 [DOI] [PMC free article] [PubMed] [Google Scholar]
- 12. Steinberg GR, Kemp BE: AMPK in Health and disease. Physiol Rev 89: 1025–1078, 2009 [DOI] [PubMed] [Google Scholar]
- 13. Liu Y, Wan Q, Guan Q, Gao L, Zhao J: High-fat diet feeding impairs both the expression and activity of AMPKa in rats' skeletal muscle. Biochem Biophys Res Commun 339: 701–707, 2006 [DOI] [PubMed] [Google Scholar]
- 14. Motawi TM, Hashem RM, Rashed LA, El-Razek SM: Comparative study between the effect of the peroxisome proliferator activated receptor-a ligands fenofibrate and n-3 polyunsaturated fatty acids on activation of 5′-AMP-activated protein kinase-a1 in high-fat fed rats. J Pharm Pharmacol 61: 1339–1346, 2009 [DOI] [PubMed] [Google Scholar]
- 15. Lin J, Judd S, Le A, Ard J, Newsome BB, Howard G, Warnock DG, McClellan W: Associations of dietary fat with albuminuria and kidney dysfunction. Am J Clin Nutr 92: 897–904, 2010 [DOI] [PMC free article] [PubMed] [Google Scholar]
- 16. Ruan X, Guan Y: Metabolic syndrome and chronic kidney disease. J Diabetes 1: 236–245, 2009 [DOI] [PubMed] [Google Scholar]
- 17. Stapleton D, Mitchelhill KI, Gao G, Widmer J, Michell BJ, Teh T, House CM, Fernandez CS, Cox T, Witters LA, Kemp BE: Mammalian AMP-activated protein kinase subfamily. J Biol Chem 271: 611–614, 1996 [DOI] [PubMed] [Google Scholar]
- 18. Yamauchi T, Kamon J, Ito Y, Tsuchida A, Yokomizo T, Kita S, Sugiyama T, Miyagishi M, Hara K, Tsunoda M, Murakami K, Ohteki T, Uchida S, Takekawa S, Waki H, Tsuno NH, Shibata Y, Terauchi Y, Froguel P, Tobe K, Koyasu S, Taira K, Kitamura T, Shimizu T, Nagai R, Kadowaki T: Cloning of adiponectin receptors that mediate antidiabetic metabolic effects. Nature 423: 762–769, 2003 [DOI] [PubMed] [Google Scholar]
- 19. Carling D: The AMP-activated protein kinase cascade—A unifying system for energy control. Trends Biochem Sci 29: 18–24, 2004 [DOI] [PubMed] [Google Scholar]
- 20. Hardie DG, Hawley SA, Scott JW: AMP-activated protein kinase development of the energy sensor concept. J Physiol 574: 7–15, 2006 [DOI] [PMC free article] [PubMed] [Google Scholar]
- 21. Woods A, Dickerson K, Heath R, Hong SP, Momcilovic M, Johnstone SR, Carlson M, Carling D: Ca2+/calmodulin-dependent protein kinase kinase-beta acts upstream of AMP-activated protein kinase in mammalian cells. Cell Metab 2: 31–33, 2005 [DOI] [PubMed] [Google Scholar]
- 22. Kume S, Uzu T, Araki S, Sugimoto T, Isshiki K, Chin-Kanasaki M, Sakaguchi M, Kubota N, Terauchi Y, Kadowaki T, Haneda M, Kashiwagi A, Koya D: Role of altered renal lipid metabolism in the development of renal injury induced by a high-fat diet. J Am Soc Nephrol 18: 2715–2723, 2007 [DOI] [PubMed] [Google Scholar]
- 23. Corton JM, Gillespie JG, Hawley SA, Hardie DG: 5-Aminoimidazole-4-carboxamide ribonucleoside. A specific method for activating AMP-activated protein kinase in intact cells. Eur J Biochem 229: 558–565, 1995 [DOI] [PubMed] [Google Scholar]
- 24. Lihn AS, Jessen N, Pedersen SB, Lund S, Richelsen B: AICAR stimulates adiponectin and inhibits cytokines in adipose tissue. Biochem Biophys Res Commun 316: 853–858, 2004 [DOI] [PubMed] [Google Scholar]
- 25. Peairs A, Radjavi A, Davis S, Li L, Ahmed A, Giri S, Reilly CM: Activation of AMPK inhibits inflammation in MRL/lpr mouse mesangial cells. Clin Exp Immunol 156: 542–551, 2009 [DOI] [PMC free article] [PubMed] [Google Scholar]
- 26. Furuichi K, Kaneko S, Wada T: Chemokine/chemokine receptor-mediated inflammation regulates pathologic changes from acute kidney injury to chronic kidney disease. Clin Exp Nephrol 13: 9–14, 2009 [DOI] [PubMed] [Google Scholar]
- 27. Eardley KS, Kubal C, Zehnder D, Quinkler M, Lepenies J, Savage CO, Howie AJ, Kaur K, Cooper MS, Adu D, Cockwell P: The role of capillary density, macrophage infiltration and interstitial scarring in the pathogenesis of human chronic kidney disease. Kidney Int 74: 495–504, 2008 [DOI] [PubMed] [Google Scholar]
- 28. Tarabra E, Giunti S, Barutta F, Salvidio G, Burt D, Deferrari G, Gambino R, Vergola D, Pinach S, Perin PC, Camussi G, Gruden G: Effect of the monocyte chemoattractant protein-1/CC chemokine receptor 2 system on nephrin expression in streptozotocin-treated mice and human cultured podocytes. Diabetes 58: 2109–2118, 2009 [DOI] [PMC free article] [PubMed] [Google Scholar]
- 29. Weisberg SP, Hunter D, Huber R, Lemieux J, Slaymaker S, Vaddi K, Charo I, Leibel RL, Ferrante AW, Jr: CCR2 modulates inflammatory and metabolic effects of high-fat feeding. J Clin Invest 116: 115–124, 2006 [DOI] [PMC free article] [PubMed] [Google Scholar]
- 30. Kirk EA, Sagawa ZK, McDonald TO, O'Brien KD, Heinecke JW: Monocyte chemoattractant protein deficiency fails to restrain macrophage infiltration into adipose tissue [corrected]. Diabetes 57: 1254–1261, 2008. Erratum in: Diabetes 57: 2252, 2008 [DOI] [PubMed] [Google Scholar]
- 31. Lee EY, Chung CH, Khoury CC, Yeo TK, Pyagay PE, Wang A, Chen S: The monocyte chemoattractant protein-1/CCR2 loop, inducible by TGF-beta, increases podocyte motility and albumin permeability. Am J Physiol Renal Physiol 297: F85–F94, 2009 [DOI] [PMC free article] [PubMed] [Google Scholar]
- 32. Wang S, Zhang M, Liang B, Xu J, Xie Z, Liu C, Viollet B, Yan D, Zou MH: AMPKalpha2 deletion causes aberrant expression and activation of NAD(P)H oxidase and consequent endothelial dysfunction in vivo: Role of 26S proteasomes. Circ Res 106: 1117–1128, 2010 [DOI] [PMC free article] [PubMed] [Google Scholar]
- 33. Wolf G, Haberstroh U, Neilson EG: Angiotensin II stimulates the proliferation and biosynthesis of type I collagen in cultured murine mesangial cells. Am J Pathol 140: 95–107, 1992 [PMC free article] [PubMed] [Google Scholar]
- 34. Morse E, Schroth J, You YH, Pizzo DP, Okada S, Ramachandrarao S, Vallon V, Sharma K, Cunard R: TRB3 is stimulated in diabetic kidneys, regulated by the ER stress marker CHOP, and is a suppressor of podocyte MCP-1. Am J Physiol Renal Physiol 299: F965–F972, 2010 [DOI] [PMC free article] [PubMed] [Google Scholar]
- 35. Kim HS, Lee G, John SW, Maeda N, Smithies O: Molecular phenotyping for analyzing subtle genetic effects in mice: Application to an angiotensinogen gene titration. Proc Natl Acad Sci U S A 99: 4602–4607, 2002 [DOI] [PMC free article] [PubMed] [Google Scholar]
- 36. RamachandraRao SP, Zhu Y, Ravasi T, McGowan TA, Toh I, Dunn SR, Okada S, Shaw MA, Sharma K: Pirfenidone is renoprotective in diabetic kidney disease. J Am Soc Nephrol 20: 1765–1775, 2009 [DOI] [PMC free article] [PubMed] [Google Scholar]
Associated Data
This section collects any data citations, data availability statements, or supplementary materials included in this article.


