

Abstract
Bacteria have evolved diverse defense mechanisms that allow them to fight viral attacks. One such mechanism, the clustered, regularly interspaced, short palindromic repeat (CRISPR) system, is an adaptive immune system consisting of genetic loci that can take up genetic material from invasive elements (viruses and plasmids) and later use them to reject the returning invaders. It remains an open question how, despite the ongoing evolution of attack and defense mechanisms, bacteria and viral phages manage to coexist. Using a simple mathematical model and a two-dimensional numerical simulation, we found that CRISPR adaptive immunity allows for robust phage-bacterium coexistence even when the number of virus species far exceeds the capacity of CRISPR-encoded genetic memory. Coexistence is predicted to be a consequence of the presence of many interdependent species that stress but do not overrun the bacterial defense system.
INTRODUCTION
Phages greatly outnumber bacteria on Earth (6, 19, 34). However, bacteria have developed several effective defense mechanisms against phages. Among these, the bacterial clustered, regularly interspaced, short palindromic repeat (CRISPR) phage response system—first discovered in Escherichia coli by Ishino et al. in 1987 (17)—has recently stirred considerable attention (7, 12, 15, 16, 27, 28, 38). The CRISPR system is characterized by arrays of short (24 to 47 bp) repeats that are interspersed by nonrepetitive spacer sequences (26 to 72 bp) (37). The number of repeats per array varies greatly ranging from 2 to 249 repeats, and these are usually identical within the same array (18). In contrast to the repeats, the spacers are generally unique. Moreover, the spacers were predominantly found to match “phages and other extrachromosomal elements” (37). The CRISPR system generally also involves a leader sequence of up to 550 bp, located upstream the CRISPR repeats. It is important to our study to note that new repeat-spacer units are “almost always added to the CRISPR array between the leader and the previous unit” (37).
CRISPR enables bacterial resistance against foreign genetic material. Although the details of its functioning are still under experimental investigation (7, 12, 15, 20, 27, 28), successful phage resistance has been found to depend on the presence of several CRISPR-associated (CAS) genes upstream of the leader sequence that are involved in the immunization process. It is thus far not clear how recognition of invasive elements, production of new repeats, and the integration of spacers into the CRISPR locus are carried out (15). However, several CAS genes may be involved in this process. The CRISPR leader sequence has been suggested to act as a promoter site for transcription of the repeat-spacer array. Transcription yields pre-crRNA (11, 26), which is cut into small spacer sequences bounded by partial repeats. Finally, in subsequent phage infections, the resulting crRNAs target viral motifs by Watson-Crick pairing and viral degradation may be triggered by mismatches between the viral sequence and the repeat sequence (29, 39).
Only roughly 40% of bacterial genomes are equipped with such response systems. Other effective defense mechanisms exist, e.g., receptor modification. However, the cost associated with the latter mechanism may lie in a reduction of bacterial metabolism (9). Further, due to their higher mutation rates, phages may easily be able to evade this defense (8, 39). Fast response to invading species may be an important reason why CRISPR defense has established itself as an alternative phage resistance strategy in nearly half of the bacterial genomes (28). On the other hand, even CRISPR is expected to come at a cost, since costless resistance would imply an ever-growing number of phage-derived spacers to be found in the bacterial genome (22, 39). Longer sequences of CRISPR spacers could lead to a reduction of growth rate or loss of replication fidelity (39). In fact, while the number of observed distinct spacer sequences in a single bacterium varies widely, sequence lengths of up to 2,000 unique spacers measured in an archaea population appear to constitute an extreme case (3).
Bacterium-phage systems have been investigated in the past using a variety of simple models (1, 4, 13, 14, 23, 24, 32, 33, 35, 36, 40–42). Heilmann et al. (14) examined the coexistence between bacteria and phage and explicitly discuss spatial effects. These authors found that phage are able to avoid their own extinction by opting to become “mediocre killers” as more aggressive strains quickly deplete local resources and die off.
In the spirit of that study (14), we explicitly include here spatial effects in our model, albeit in a somewhat more simplified fashion with a reduced number of parameters (see Materials and Methods). Our model reaches equivalent general conclusions as far as the effects of space on species coexistence are concerned. However, our model is intended to facilitate the understanding of the effect of CRISPR on bacterium-phage coexistence. Therefore, in our case, many competing phage species were incorporated. Further, our model allowed the bacteria to dynamically acquire resistance to phage strains. In this sense, our model captures essential features of the CRISPR defense mechanism. On the other hand, its simplicity allows us to obtain mean field solutions corresponding to a well-mixed system analytically.
MATERIALS AND METHODS
Spatial model.
Our simple model consisted of bacterium and phage populations that spread on a two-dimensional square lattice. Transport occurs by transitions to the nearest neighbor sites. At every site, a bacterial or phage population can reside, and its update time is drawn from the exponential probability density function exp(−t/τs)/τs, wherein s can be either b or p depending on whether bacteria or phage species are updated. The update procedure is implemented analogous to the Gillespie algorithm (10). The phage speed is then defined as the ratio w  τb/τp.
Bacteria.
We view lattice sites to be large enough to allow occupancy by a microcolony of bacteria (N0 × 105/site). Thus, growth and spreading of bacteria occur in these coarse-grained units. Nearest-neighbor sites that are already occupied by bacteria are left unaltered. Food resources for bacteria are assumed to be unlimited, and growth is thus only limited by spatial constraints.
Phage.
A site that is occupied by a bacterial population can now be invaded by the phage from any nearest-neighbor site, as shown schematically in Fig. 2a. The phage's likelihood of infecting the bacterial population is described by probability δ. The phage at a given site die once an attempt to spread to neighboring sites is made. If the phage succeeds in entering the bacterial population, it undergoes a latent phase: the bacteria enter the lytic state and become unable to reproduce. However, the space of the site remains occupied by bacterial cells until phage spreading occurs. When the phage population at a given site is updated, it spreads to the four nearest-neighbor sites. The transport mechanism is similar to the bacterial case; however, phage always die when empty sites are reached.
Fig. 2.

Phage density depends on phage aggressiveness and replication speed. (a) Schematic of phage (red symbols) spreading on lattice; solid (dashed) squares are bacteria colonies (space). (b) Mean-field model phage density. (c) Numerical results of lattice model for phage dynamics. (d) Schematic illustration of growth of phage (red) and bacteria (black) for two different values of phage speed w represented by the changing length of the red arrows. The color bar corresponds to density in panels b and c.
When multiple phage species are present, infected bacteria can no longer be invaded by other phages. Bacteria at any given site are always sacrificed to only one of the phage species and are not split between infections of distinct predators.
We have also explored the more sophisticated model of finite phage lifetime when no host is encountered. In this case, phage persist for some time even when no bacteria are present. The results for the phase diagram are qualitatively similar with generally larger phage densities but a similar coexistence regime (compare Fig. 2c to Fig. S2 in the supplemental material). Consequently, in order to simplify the mechanisms as much as possible, we used the simplest model.
Bacterial immunity.
Bacterial microcolonies can be infected at a given probability δ. By this we mean that the probability of one bacterium residing at a given lattice site being immune is 1 − δ. In this case, the immune bacteria will reproduce rapidly and subsequently occupy the entire site, hence removing the phage population. In the case of CRISPR-acquired immunity, the probability r (i.e., the frequency of becoming immune) refers to the entire population (N particles) at a given site, i.e., one of N individuals will become immune and subsequently spread over the entire lattice site. Hence, the probabilities given in the text always refer to a microcolony of bacteria.
Initial and boundary condition and convergence.
In our numerical simulations, the lattice is randomly populated by bacteria. When the bacterial density reaches 1/2, phage are randomly placed on the lattice. We present here the steady state achieved by the finite-size system. The linear system size varies between L = 150 and L = 1,500 subject to parameters, and the boundary conditions are periodic. Since bacterial and phage population densities are subject to temporal fluctuations, we consider the system to have reached a stationary state when the mean density over a finite time period becomes constant. We checked that this value was not influenced by the length of this time interval. In the case of multiple phage species, we considered a system stable when none of the species go extinct, i.e., when a system is initialized with np phage species, all np species must still have finite population densities in the steady state. To give a typical example, at a system size of 200 × 200 sites, two phage species and one immunity, the system has reached the steady state after 2.4 × 10⁷ iterations. Strictly speaking, in finite systems this state is in fact a long-lived intermediate state and will eventually collapse to the absorbing state, wherein all phage species become extinct. In our simulations we considered the long-lived intermediate state, which will have an arbitrarily long lifetime in the limit of very large system size.
RESULTS
Our objective is to describe the behavior of the bacterium-phage ecosystem when the number of distinct species is large. To give a general flavor of the system at hand, a snapshot of a typical state is presented in Fig. 1. The figure illustrates multiple phage species spreading on a bacterial ecosystem with various ages of immunity. We will discuss this figure at a later stage of this article. However, before addressing this case, we first consider a simpler situation. We later show that it can be used to better understand the more general case.
Fig. 1.

Snapshot image of phage-bacterium coexistence. np = 50, nres = 30. One phage species (of the 50 species present) is indicated in red, bacteria infectible by the red phage are indicated in black, and bacteria with resistance to the red phage shown are indicated in colors ranging from green (recent) to blue (less recent). All other phage species (the remaining 49) are indicated in gray. Unoccupied space is indicated in white. Overall, one observes that a given phage species (red) exists on the edge between bacteria that recently became immune and completely vulnerable bacteria. Note the areas of local extinction where red phage are completely enclosed by immune bacteria.
Consider bacteria that are partially resistant to a particular phage species. By “partially resistant” we mean that upon collision, the phage infect the bacteria at a given probability δ, which we call phage aggressiveness. This value can be understood as the effective infection rate for a microcolony of bacteria. We explore the coexistence range of the phage species with bacteria when phage aggressiveness is varied. Our second parameter is the ratio of phage and bacterial mean replication times w, e.g., at w = 2 the phage replicate twice as fast as the bacteria. The phage replication time should be understood as the mean latency time. To simplify, we refer below to this parameter as the phage speed. The effect of δ and w is shown schematically in Fig. 2a and d.
Throughout the text, we will contrast two extremes of the phage diffusion coefficient. (i) In the mean-field case phage individuals are placed at a random site in the system after they are released from the bacterial host. This corresponds to a stirred or well-mixed system. Although the mean-field equations can be solved directly in the steady-state (see the supplemental material), we have also performed a numerical simulation by assigning random neighbors in our lattice model with identical results. (ii) In the nearest-neighbor case, phage move by replication only: when released from the bacterial host, they simply spill over to all nearest neighbors. When encountering a host there, infection is attempted. If no host is encountered there, the phage die. (The supplemental material contains details on the effects of different values of phage lifetime.) This case corresponds to slow diffusion. It is useful to first consider the mean-field model. In this case the steady-state solutions for the bacteria and phage density can be obtained analytically as a function of the two parameters δ and w.
Partial bacterial resistance.
We discuss and contrast here the two extreme cases of a stirred (or well mixed) and a slow diffusion limit. In the well-mixed laboratory or industrial system (5, 30), displacement by diffusion or advection of individuals essentially assigns random neighbors to them on timescales shorter than the latency time. Slow diffusion corresponds to systems where the spreading of phage occurs more rapidly by infection processes than by the mixing, e.g., advection or diffusion in a lab system. The main parameters of our model—phage aggressiveness δ and phage speed w—are schematically illustrated in Fig. 2a and d, respectively. δ is the probability of infecting bacterial sites, and w is the speed of replication relative to that of the bacteria; hence, fronts of phage catch up with bacterial fronts at large w values, whereas they do not at low values.
(i) Stirred system.
In the mean-field case, the offspring is placed at random sites upon replication (Fig. 2b). To become familiar with the two parameters, we discuss the dependence of bacteria and phage density on δ and w in the steady state: the density of bacteria ρb = min{1/4δ, 1} (additional details are available in the supplemental material) becomes independent of phage speed and decreases monotonously with aggressiveness δ. The phage density (Fig. 2b) ρp = 4ρb (1 − ρb)/(w + 4ρb) is largest at a low phage speed w and high values of aggressiveness. A low phage speed allows bacterial resources to be abundant, and greater aggressiveness increases the number of offspring. ρp vanishes as δ ≤ 1/4. This threshold value is obtained by setting ρb = 1 and demanding that the mean number of offspring equal unity. To highlight optimal parameters for phage density, we emphasize maximal phage density for a given value of w by a white curve. As phage speed increases, optimal densities can be achieved by reducing aggressiveness.
(ii) Slow diffusion.
In this case, the system is not mixed, and phage spread only to neighboring sites. Space now requires the phage to accept lower infection rates in order to avoid depleting resources in its immediate surroundings. To understand this, we used the nearest-neighbor lattice model (see Materials and Methods). This model (Fig. 2c) is more appropriate than the mean-field model for systems where the speed of spreading is determined through replication. This may be the case in soil (21, 31), notwithstanding the complexity of the dynamics of viruses and their hosts in such heterogeneous environments. On the other hand, our model possibly also applies to some lab systems (2). Alvarez et al. have shown that “when microcolonies of bacteria occupy the major part of the medium, the spread of infection does not significantly depend on diffusion.” The density plot of the phage population with respect to the two parameters (the colored area in Fig. 2c) shows that coexistence is generally best (largest phage density) at small phage speed and intermediate aggressiveness. At low phage speed, the bacteria manage to quickly fill any space left behind by the dying phage and therefore increase the space available for phage to live in. A too-large aggressiveness depletes resources too quickly, while at low aggressiveness the phage suffer from replication rates that are too small. The small-w limiting value of δ ≈ 1/4 can be obtained by setting ρb = 1 and demanding an average of one offspring to be generated per phage replication step. As w increases, phage spread more rapidly and eliminate bacteria more quickly, and bacteria cannot regrow fast enough. In this way, phage deplete the space available for their own survival, namely, areas of contiguous bacterial population. Note, however, that at w = 1 (hence, equal replication speed of bacteria and phage) and δ = 1 (hence, maximally aggressive phage) coexistence is still robustly possible. To understand this, two neighboring bacterial sites should be considered, one of which is infected by phage. Replication of the uninfected bacteria site leads to occupation of three new sites by bacteria. However, phage replication leads to the invasion of only a single new bacterial site. More generally, bacterial population growth proceeds proportional to surface area of the occupied area (compare Fig. 2d). Phage population growth is proportional to the interface area of phage and bacteria area (shown in red), while bacterial growth is proportional to the surface area between bacteria and free space (shown in black and white, respectively). As the bacterial population becomes large, the fraction of surface area becomes small. However, phage will rapidly repartition the bacterial population into smaller segments that then grow faster again. This leads to self-organized typical cluster sizes. We note that these conclusions are similar to those obtained in the literature (14).
Bacteria have the inherent advantage that their growth is not a priori dependent on the existence of the phage. Consider bacterial population to be scarce (Fig. 2d). In this case, the relative population increase is largest since growth is proportional to the surface area. However, phage growth is proportional to the surface area of the phage population that further intersects the bacteria population. When a circular bacterial colony is invaded, phage growth will generally emerge from the edge of the bacterial population (as shown in Fig. 2d). Hence, a large section of the phage population is not in contact with the bacteria. We call this the bacteria's geometric advantage. Indeed, it allows the bacteria to survive up to roughly w = 2 at δ = 1.
Dynamic bacterial immunity and the CRISPR system.
We now turn to the situation of dynamically acquired immunity. In Fig. 3 we present our model for the bacterial CRISPR system. Bacterial populations are depicted as rectangular black objects, and their CRISPR systems are symbolized by CAS genes (green) and several phage immunities. For example, in Fig. 3 the bacteria initially have three immunities (yellow, blue, and brown) present in their CRISPR system. Hence, these three types would be successfully rejected by the bacteria. When a new phage attempts to infect (shown as a red symbol), there are two possible outcomes. At a small probability r, which is the insertion frequency, the bacteria acquire a new immunity and the phage die. At a probability 1 − r, the phage infect and use the bacteria to multiply. In our model, we treat the maximum number of CRISPR insertions nres as a parameter. Acquiring a new immunity yields an insertion at the beginning of the CRISPR array and a removal of the earliest insertion, if the total number of insertions exceeds nres. A similar model for such dynamical reshuffling of the CRISPR spacer sequences has been presented recently by He and Deem (13). This type of systematic insertion is consistent with previous experimental observations (see, for example, reference 38), where it was found that insertions are made preferably near the CAS gene complex. However, other types of reorganization of spacers are possible in some cases (25).
Fig. 3.

Acquisition of bacterial immunity using CRISPR. Oval black symbols represent bacteria, red symbols represent phage. Upon a phage attack, two outcomes are possible. (i) Bacteria acquire immunity to invading phage at a small probability r. In this case, the bacterium inserts new resistance into its CRISPR system. (ii) Bacteria are destroyed by phage at probability 1 − r, and phage offspring is generated. In this example, nres = 3 since the CRISPR system has a capacity of three immunity insertions. When a new insertion is made (red phage), the earliest insertion (shown in brown) is removed from the array.
Two competing phage strains and switching bacterial immunity.
We first consider the simplest case nres = 1, implying that a recent phage infection can lead to immunity to this phage. If there is only one phage species present, then eventually all surviving bacteria become immune, and the phage will go extinct. However, for more than one phage species nres = 1 implies that the bacteria that acquire a new immunity lose that to the other phage species. As a consequence, two different phage species can already coexist, because each of them removes the bacterial immunity against the other. In a real ecosystem, the number of phage species and the number of immunities is large, and coexistence depends on the extent to which bacteria lose or gain immunity against a fraction of the phages. To understand how coexistence is associated with reshuffled resistances, it is useful to first consider coexistence of this simple case in which immunity is limited to a single spacer.
In a first step, we also explore the dependence of the steady-state phage density on the rate r at which new spacers can be incorporated into the CRISPR system. As discussed above, if only a single phage species exists, immunity would rapidly be acquired, and the phage would die out. However, when a second species is introduced, our simulations show (Fig. 4a) that stable coexistence of the two phage species with the bacteria is possible in a wide range of parameters. This is a remarkable type of coexistence, since competitors—the two phage species—are also completely dependent upon one another.
Fig. 4.

Rapid bacterial immune reaction decreases phage aggressiveness. (a) Density plot of phage population as a function of w and the insertion frequency r with two phage species and one immunity. Note the logarithmic horizontal axis. (b) Partial reproduction of Fig. 2c. Solid and dashed black lines correspond to matching lines in panel a where δ was taken as effective infection probability δef f. The parameter region of panel a is emphasized in panel b by brighter shades of blue to red. Triangular symbols correspond to the mean-field δ for different values of r. The schematic in panel a illustrates the cooperative effect of two phage strains (shown in red and light blue): the red phage can infect bacteria with resistance to the blue phage and vice versa.
It is interesting that phage survival benefits from more rapid bacterial response (r). This is seen in Fig. 4b, where phage are shown to coexist with bacteria for a larger range of phage replication rates w when the spacer insertion rate r is ∼0.1 than when r is <0.1. Thus, when r is large, coexistence can be maintained even when phage replicate more than 7 times faster than the rate given by the bacterial generation time. This is perhaps unexpected, since a higher insertion frequency might appear to be a bacterial advantage. However, because bacterial immunities are spatially correlated, the chance that a phage in fact infects a host at a given site also becomes correlated. Denoting this chance as δef f, we found that δef f depends on w, since a high w reflects phages that spread fast on bacterial clusters, thereby sustaining the spatial correlations.
In Fig. 4b we show a partial reproduction of the phase diagram in Fig. 2c. However, we have now superimposed the trajectories defined by pairs [δef f (w,r), w] obtained by sampling different combinations of w and r. δef f generally increases as a function of w. Hence, accelerating allows phages to increase their chances of infecting a given host. At larger values of w it is even possible to obtain significantly larger values of δef f than in the mean-field system, where δef f = (1 − r)/(1 − 1/np). The reason for this is again that bacterial populations are spatially correlated. Hence, finding one infectible host increases the chances of finding another. Further, as r decreases, δef f increases: thus, when r tends to 0, bacteria more rarely adopt a new immunity, and the phage is more likely to spread to the nearest site. Therefore, large w and small r can drive the bacteria and subsequently the phage to extinction. The upper right corner of the phase diagram is accessed and phage locally deplete their own resources.
In Fig. 4b the mean field δef f is shown in black triangles for the four values of r. These δef f values are constant for different values of w, and their values are only weakly dependent on r. Note that in the mean-field case, δef f δ as spatial correlations are removed. We kept r fixed to a value of 0.1 in the following analyses.
Simulation of the CRISPR defense system.
In a real ecosystem, the number of distinct phage types per bacterial species is very large (6, 19, 34) and may well outnumber the resistances present in the bacterial CRISPR system. It is important to determine how beneficial CRISPR is in the case of such large diversity of predators and how it can possibly facilitate coexistence of a large number of species. We have already shown that two phage species are required for coexistence with bacteria with a single immunity. We now wanted to evaluate what happens if the number of species is large.
We therefore generalized our model (Fig. 3) by increasing the phage species number np and allowing multiple simultaneous immunities nres. We refer below to the ratio nres/np as relative immunity (RI), and we kept the phage speed fixed to w = 1/2 (see the supplemental material). In the mean-field case, bacterial density is generally lowest, and it only depends on RI. However, in the slow diffusion model, bacterial density depends both on RI and on the absolute number of phage species present (np). When np is small (e.g., np = 2 and nres = 1), a lower density is obtained than for larger np (e.g., np = 200 and nres = 100), even if the ratio RI nres/np remains unchanged.
To understand the origin of this behavior, consider again the snapshot of the dynamics of phage and bacteria in a system of 50 phage species and 30 CRISPR immunities (Fig. 1). The image highlights one phage strain in red; all others are shown in gray. Bacteria that are not immune to the red phage strain are shown in black. Those that have recently (less recently) acquired immunity are shown in colors ranging from green to blue. The long-term memory of the bacteria, resulting from the 30 resistances, forces the phage to essentially spread into a half space. The likelihood δef f of phage being able to infect a given host increases when RI is decreased. However, while the increase is linear in the mean-field case and δef f becomes almost unity when RI becomes zero, the increases of δef f are smaller in the spatial model when np is large.
Generally, the effective infection rate δef f is small, even for small RI ≪ 1. This is because a phage population creates a cloud of resistant bacteria in its vicinity, whereas bacteria located farther away gradually loose their resistance. As np becomes large, even bacteria that have spread away from the phage for long times can remain resistant due to the length of their memory. In short, when starting from a system with only a few phage species (say, two species as in the previous section) and adding more and more phage species in the course of evolution, RI can be reduced while maintaining the same bacterial density.
To quantify sustainability, we determined the RI that is needed to match a given bacterial density. Therefore, we kept the bacterial density fixed to the value obtained at np = 2 and nres = 1. We then gradually increased np and adjusted nres to maintain constant ρb (Fig. 5). RI decreases substantially when np is increased. Conversely, In the mean-field case (dashed vertical line) RI would remain constant. We found that a power law with nres ∼ n0.8 obtains, hence, there is a sublinear increase, whereas the mean-field case yields a linear nres ∼ np.
Fig. 5.
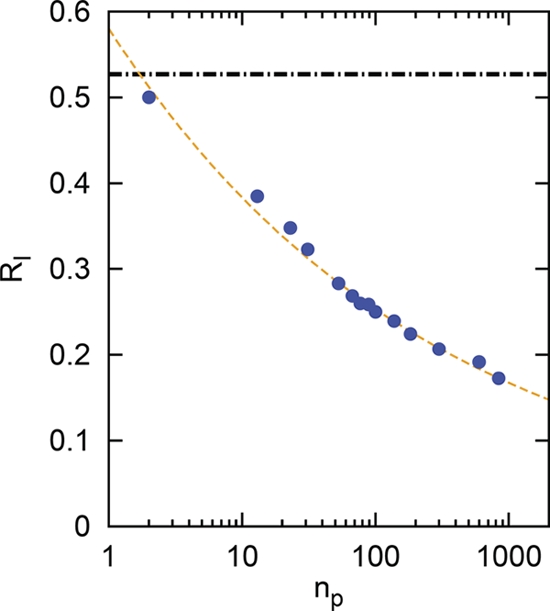
CRISPR buffers phage diversity. Blue circles indicate the relative immunity (RI) required to sustain a fixed bacterial population density (ρb = 0.587) as a function of the total number of phage species (np). The black horizontal dot-dashed line is the mean-field solution; the dashed orange line is a fit to the data. Note the logarithmic horizontal axis.
Note the complexity of the interaction. As nres increases, the likelihood of finding two bacterial individuals with the same CRISPR spacer sequence or even the exact same resistances becomes very small. This behavior is also found experimentally (38). Tyson and Banfield (38) state that “there is sufficient heterogeneity in spacer content to suggest that no two sampled individuals share the same CRISPR loci.”
DISCUSSION
We have explored the coexistence and coevolution of the phage-bacterium ecosystem within a two-dimensional square lattice model. Our results demonstrate that imperfect bacterial immunity, together with spatial self-organization, leads to robust phage-bacterium coexistence.
We have first presented the phase diagram for coexistence of a single phage species and a bacterial population with imperfect immunity to the phage. Using this framework we subsequently developed a model to deal with the CRISPR defense system found ubiquitously in procaryotes. Incorporating dynamical reshuffling within a limited immunity region, it was shown that stable coexistence of two competing phage strains is possible. This type of coexistence is remarkable, since either of the two phage strains would die out if independently exposed to the host.
This qualitative feature is also predicted when one allows np phage strains to infect bacteria that are resistant to up to nres < np different phage strains. The bacteria dynamically update their immunity memory by including new immunities at the cost of removing the oldest. Our results suggest that, using CRISPR, bacteria can adjust to large numbers of new phage species by relatively small improvements to the memory of their immune system.
We conclude that such a CRISPR defense system allows bacteria robust protection against phage, even when the relative number of resistances is very small compared to phage diversity. If metabolic cost were associated with an increase of the length of the CRISPR spacer array, the bacteria would likely opt for a small length nres ≪ np.
Therefore, we propose to carry out experiments in which the length of the CRISPR array is systematically studied in relation to the number of phage species present. Our results predict that in environments with a large phage species diversity, the CRISPR array should be longer than in systems with low diversity. However, the relative increase in the CRISPR sequence should be less than the relative increase in diversity. Overall, we have seen that CRISPR is a mechanism that indirectly promotes the coexistence of many distinct phage species and thus serves as a buffer for phage diversity.
Supplementary Material
ACKNOWLEDGMENTS
We acknowledge fruitful discussions with S. Brown, S. Heilmann, S. Svenningsen, and Q. She.
This work was supported by the Danish National Research Foundation through the Center for Models of Life.
Footnotes
Supplemental material for this article may be found at http://jvi.asm.org/.
Published ahead of print on 3 August 2011.
REFERENCES
- 1. Abedon S. T., et al. 2008. Bacteriophage ecology, population growth, evolution, and impact of bacterial viruses. Cambridge University Press, Cambridge, United Kingdom [Google Scholar]
- 2. Alvarez L. J., Thomen P., Makushok T., Chatenay D. 2006. Propagation of fluorescent viruses in growing plaques. Biotechnol. Bioeng. 96:615–621 [DOI] [PubMed] [Google Scholar]
- 3. Andersson A. F., Banfield J. F. 2008. Virus population dynamics and acquired virus resistance in natural microbial communities. Science 320:1047–1050 [DOI] [PubMed] [Google Scholar]
- 4. Avlund M., et al. 2009. Why do phage play dice? J. Virol. 83:11416–11420 [DOI] [PMC free article] [PubMed] [Google Scholar]
- 5. Bolotin A., et al. 2004. Complete sequence and comparative genome analysis of the dairy bacterium Streptococcus thermophilus. Nat. Biotechnol. 22:1554. [DOI] [PMC free article] [PubMed] [Google Scholar]
- 6. Breitbart M., Rohwer F. 2005. Here a virus, there a virus, everywhere the same virus? Trends Microbiol. 13:278–284 [DOI] [PubMed] [Google Scholar]
- 7. Brouns S. J. J., et al. 2008. Small CRISPR RNAs guide antiviral defense in prokaryotes. Science 321:960–964 [DOI] [PMC free article] [PubMed] [Google Scholar]
- 8. Drake J. W., Charlesworth B., Charlesworth D., Crow J. F. 1998. Rates of spontaneous mutation. Genetics 148:1667–1686 [DOI] [PMC free article] [PubMed] [Google Scholar]
- 9. Ferenci T., Brass J., Boos W. 1980. The role of the periplasmic maltose-binding protein and the outer-membrane phage lambda receptor in maltodextrin transport of Escherichia coli. Biochem. Soc. Trans. 8:680–681 [DOI] [PubMed] [Google Scholar]
- 10. Gillespie D. T. 1976. A general method for numerically simulating the stochastic time evolution of coupled chemical reactions. J. Comput. Phys. 22:403–434 [Google Scholar]
- 11. Hale C., Kleppe K., Terns R. M., Terns M. P. 2008. Prokaryotic silencing (psi)RNAs in Pyrococcus furiosus. RNA 14:2572–2579 [DOI] [PMC free article] [PubMed] [Google Scholar]
- 12. Hale C. R., et al. 2009. RNA-guided RNA cleavage by a CRISPR RNA-Cas protein complex. Cell 139:945–956 [DOI] [PMC free article] [PubMed] [Google Scholar]
- 13. He J., Deem M. W. 2010. Heterogeneous diversity of spacers within CRISPR (clustered regularly interspaced short palindromic repeats). Phys. Rev. Lett. 105:128102. [DOI] [PubMed] [Google Scholar]
- 14. Heilmann S., Sneppen K., Krishna S. 2010. Sustainability of virulence in a phage-bacteria ecosystem. J. Virol. 84:3016–3022 [DOI] [PMC free article] [PubMed] [Google Scholar]
- 15. Horvath P., Barrangou R. 2010. CRISPR/Cas, the immune system of bacteria and archaea. Science 327:167–170 [DOI] [PubMed] [Google Scholar]
- 16. Horvath P., et al. 2008. Diversity, activity, and evolution of CRISPR loci in Streptococcus thermophilus. J. Bacteriol. 190:1401. [DOI] [PMC free article] [PubMed] [Google Scholar]
- 17. Ishino Y., Shinagawa H., Makino K., Amemura M., Nakata A. 1987. Nucleotide sequence of the iap gene responsible for alkaline phosphatase isozyme conversion in Escherichia coli and identification of the gene product. J. Bacteriol. 169:5429–5433 [DOI] [PMC free article] [PubMed] [Google Scholar]
- 18. Jansen R., Embden J. D., Gaastra W., Schouls L. M. 2002. Identification of genes that are associated with DNA repeats in prokaryotes. Mol. Microbiol. 43:1565–1575 [DOI] [PubMed] [Google Scholar]
- 19. Jessup C. M., Forde S. E. 2008. Ecology and evolution in microbial systems: the generation and maintenance of diversity in phage-host interactions. Res. Microbiol. 159:382–389 [DOI] [PubMed] [Google Scholar]
- 20. Karginov F. V., Hannon G. J. 2010. The CRISPR system: small RNA-guided defense in bacteria and archaea. Mol. Cell Rev. 37:7–19 [DOI] [PMC free article] [PubMed] [Google Scholar]
- 21. Kimura M., Jia Z.-J., Nakayama N., Asakawa S. 2008. Ecology of viruses in soils: past, present, and future perspectives. Soil Sci. Plant Nutr. 54:1–32 [Google Scholar]
- 22. Lennon J. T., Khatana S. A., Marston M. F., Martiny J. B. 2007. Is there a cost of virus resistance in marine cyanobacteria? ISME J. 1:300–312 [DOI] [PubMed] [Google Scholar]
- 23. Levin B. R. 2010. Nasty viruses, costly plasmids, population dynamics, and the conditions for establishing and maintaining CRISPR-mediated adaptive immunity in bacteria. PLoS Genet. 6:e1001171. [DOI] [PMC free article] [PubMed] [Google Scholar]
- 24. Levin B. R., Stewart F. M., Chao L. 1977. Resource-limited growth, competition, and predation: a model and experimental studies with bacteria and bacteriophage. Am. Nat. 111:3–24 [Google Scholar]
- 25. Lillestol R. K., et al. 2006. A putative viral defense mechanism in archaeal cells. Archaea 2:59–72 [DOI] [PMC free article] [PubMed] [Google Scholar]
- 26. Lillestol R. K., et al. 2009. CRISPR families of the crenarchaeal genus Sulfolobus: bidirectional transcription and dynamic properties. Mol. Microbiol. 72:259. [DOI] [PubMed] [Google Scholar]
- 27. Marraffini L. A. 2010. Impact of CRISPR immunity on the emergence of bacterial pathogens. Future Microbiol. 5:693–695 [DOI] [PubMed] [Google Scholar]
- 28. Marraffini L. A., Sontheimer E. J. 2008. CRISPR interference limits horizontal gene transfer in staphylococci by targeting DNA. Science 322:1843–1845 [DOI] [PMC free article] [PubMed] [Google Scholar]
- 29. Marraffini L. A., Sontheimer E. J. 2010. Self- versus non-self-discrimination during CRISPR RNA-directed immunity. Nature 463:568–571 [DOI] [PMC free article] [PubMed] [Google Scholar]
- 30. Marx J. 2007. New bacterial defense against phage invaders identified. Science 315:1650–1651 [DOI] [PubMed] [Google Scholar]
- 31. Pantastico-Caldas M., Duncan K., Istoc C. A., Bell J. A. 1992. Population dynamics of bacteriophage and Bacillus subtilis in soil. Ecology 73:1888–1902 [Google Scholar]
- 32. Prado F., Sheih A., West J., Kerr B. 2009. Coevolutionary cycling of host sociality and pathogen virulence in contact networks. J. Theor. Biol. 261:561–569 [DOI] [PubMed] [Google Scholar]
- 33. Rabinovitch A., et al. 2003. Bacterial debris: an ecological mechanism for coexistence of bacteria and their viruses. J. Theor. Biol. 224:377–383 [DOI] [PubMed] [Google Scholar]
- 34. Rohwer F. 2003. Global phage diversity. Cell 113:141. [DOI] [PubMed] [Google Scholar]
- 35. Rosvall M., et al. 2006. Network models of phage-bacteria coevolution. Phys. Rev. E Stat. Nonlin. Soft Matter Phys. 74(Pt. 2):066105. [DOI] [PubMed] [Google Scholar]
- 36. Sneppen K., Trusina A., Jensen M. H., Bornholdt S. 2010. A minimal model for multiple epidemics and immunity spreading. PLoS One 5:e13326. [DOI] [PMC free article] [PubMed] [Google Scholar]
- 37. Sorek R., Kunin V., Hugenholtz P. 2008. CRISPR: a widespread system that provides acquired resistance against phages in bacteria and archaea. Nat. Rev. Microbiol. 6:181–186 [DOI] [PubMed] [Google Scholar]
- 38. Tyson G. W., Banfield J. F. 2008. Rapidly evolving CRISPRs implicated in acquired resistance of microorganisms to viruses. Environ. Microbiol. 10:200–207 [DOI] [PubMed] [Google Scholar]
- 39. Vale P., Little T. J. 2010. CRISPR-mediated phage resistance and the ghost of coevolution past. Proc. Biol. Sci. 277:2097–2103 [DOI] [PMC free article] [PubMed] [Google Scholar]
- 40. Weitz J. S. 2006. Size and scaling of predator-prey dynamics. Ecol Lett. 9:548–557 [DOI] [PubMed] [Google Scholar]
- 41. Weitz J. S. 2008. Evolutionary ecology of bacterial viruses. Microbe 3:171–178 [Google Scholar]
- 42. Weitz J. S., Hartman H., Levin S. A. 2005. Coevolutionary arms races between bacteria and bacteriophage. Proc. Natl. Acad. Sci. U. S. A. 102:9535–9540 [DOI] [PMC free article] [PubMed] [Google Scholar]
Associated Data
This section collects any data citations, data availability statements, or supplementary materials included in this article.