Abstract
In many brain areas, modulations in neuronal firing rates are thought to code information. However, in electrophysiological recording experiments, especially recordings in human patients, the type of information that is coded by a neuron’s discharge patterns is often not known, or difficult to determine. From our long experience with chronic recordings in humans, we have come to suspect that such unexplained modulations in firing rates are often due to state changes in the subject. We here present two case studies, with extensive data in one subject to illustrate the point that a change in the subject’s emotions, such as sudden fear, surprise, or happiness, may trigger substantial changes in firing rates.
Keywords: Human speech cortex, unit recordings, Neurotrophic Electrode, emotions, firing rate modulation
INTRODUCTION
The effect of emotion on the firing rate of individual cortical neurons over long time periods has not yet been examined in humans. We are engaged in the development of prosthetic devices to allow severely motor-impaired patients to directly control external devices, such as speech synthesizers or computers, by using neuronal electrical signals that are recorded via electrodes implanted in the patients’ brains. Under these circumstances, the stability of firing rates is essential. Variability in the neuronal firing rates greatly upsets the stability of the control signal, and undermines the dependability of the prosthetic unless these changes in firing rate can be understood and taken into account in decoding of the signals and hence stabilizing the control signal.
There are very few animal studies to guide us in this work. Single unit recordings in rat perirhinal cortex demonstrate changes in firing rates in response to fear conditioning (Furtak et al 2007). In addition, Baeg et al (2001) have investigated the role of the pre-limbic and infra-limbic cortices in rats during fear conditioning during a task that involved both conditional stimuli (CS: auditory tones) and contextual cues (conditioning box). They report significant changes in firing rates in response to the CS. Fast spiking units (putative inhibitory interneurons) showed transient increases in response to the CS whereas putative projection neurons did not. These data suggest that we might expect changes in cortical cell firings in response to fear stimuli in humans.
Over the past 14 years, we have recorded from five locked-in subjects chronically implanted with the Neurotrophic Electrode (Bartels et al 2008, Kennedy 1989) in premotor cortex, or area 4, motor cortex. These recordings were preceded by 10 years of rat and monkey recordings. Two of these subjects have provided data that are reported here. In one subject, a series of control studies were performed so most of this report deals with this subject. The data indicate that even after avoiding artifacts in the data and allowing for other sources of variability such as fatigue and boredom, emotional factors such as fear and happiness add to the observed variability in firing rates.
METHODS
The Neurotrophic Electrode
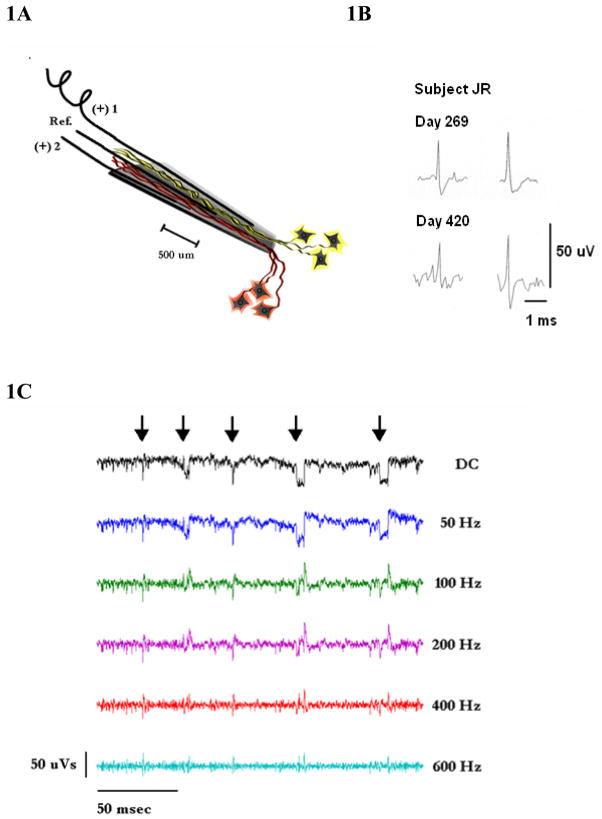
Assembly and implantation instructions for the electrode have recently been described (Bartels et al 2008, Kennedy 1989). A key feature is the glass conical tip shown diagrammatically in figure 1A (not to scale). The tip of the electrode is 50 μm in diameter, and the upper end where the wires enter is 300 – 400 μm in diameter. Three wires are shown entering the tip and are held in place with methacrylate glue. The distance between the recording sites at the exposed wire tips is approximately 500 μm. The electrode is implanted into a frontal cortex area (see below). Neurons within the surrounding cortex send axons into the tip which become electrically active. We have shown that these become myelinated over time (Bartels et al 2008, Kennedy et al 1992a). The electrical activity of these axons can be recorded using the implanted wires for differential recordings. The proximity of the neurites to each of the wires can be discerned from the initial deflection of the recorded potentials: Neurites close to one wire will depolarize in the direction opposite to the depolarizing direction of neurites close to the other wire. This provides some degree of spatial separation between the neurites, and eases the task of spike-sorting using records of the amplified signals.
Figure 1.
A: Schematic of the three-wire Neurotrophic Electrode indicating two populations of neurons growing neurites into the tip influenced by growth factors. The middle wire acts as reference for the other two. Each wire is coiled as it reaches up to the connector on the skull. The recording tips are 500 microns apart.
B: Examples of units acquired 269 and 420 days after implantation. Subject JR.
C:200 ms of data showing how the data changes when the high-pass filters are varied from DC to 600 Hz. Note that the artifactual, sharp transients are probably due to coil slippage and appear similar to single units at a filter setting of 600 Hz. We routinely use 300 Hz for the high pass filter and use the DC signal for rejecting these artifacts using a software program to detect these slippages. Subject ER.
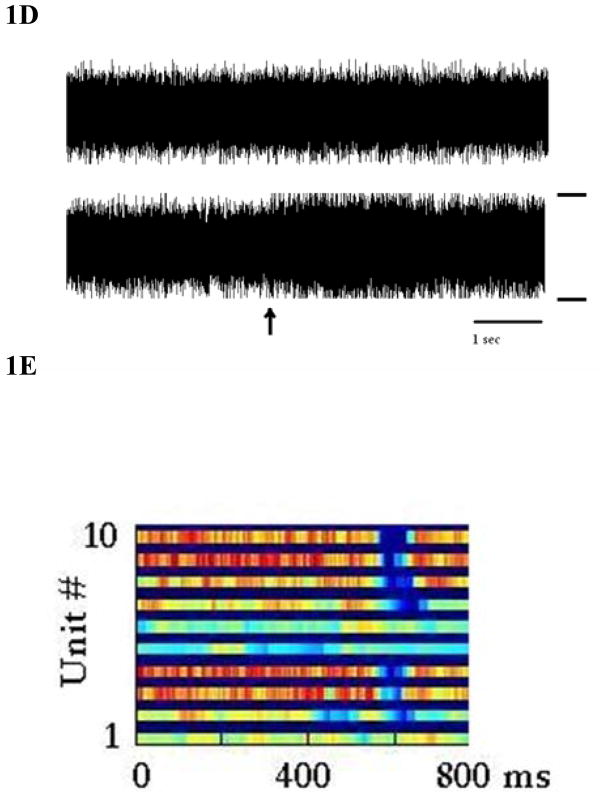
D: The top trace is continuous data over 7.33 seconds during rest. The lower trace shows similar rest data when a spasm occurs that begins at the arrow and becomes pronounced after the arrow. Note the subtle distortion of the data. The total amplitude between the rails (on right) is 60 uV. Subject ER.
E: In the raster panel, firing rates of 10 units (example from later data) are shown with red indicating the fastest rates, and deep blue indicating no firing. Note the loss of classified single units shown in blue during a spasm and the rapid reclassification of units after the spasm is over. Subject ER.
Another key feature of the Neurotrophic Electrode is shown at the upper end of the cone (at left) where one wire is shown with coiling. Other wires are also coiled. The coiling of the recording wires minimizes stress on the tip of the electrode by allowing movements in all three dimensions, thereby minimizing relative displacements between the wires and the neurites to be recorded.
Surgical targeting, implantation of electrode and electronic components
As described in more detail elsewhere (Bartels et al 2008) the brain area to be implanted is determined based on cortical activation patterns as identified by functional MRI scans during imagined arm movements or active speech articulatory movements. At the time of surgery, the implantation target for the electrode was chosen using a 3D stereotaxic system. In JR, the target was the hand area of primary motor cortex, and in ER, the target was speech premotor cortex.
The recording wires of the neurotrophic electrode are connected to a differential amplifier and an FM transmitter to facilitate data access. After connection to the wires, the electronics are implanted subcutaneously on the skull connected to the electrode and the scalp closed. The system is externally powered via a (wireless) power induction system via a coil placed over a subcutaneous resonant coil. In turn, the FM transmitter’s signals are received by another set of coils which are secured to the shaved scalp using EEG paste approved for human use (EC2, Grass Technologies, West Warwick, RI). The paste is only needed for adherence.
Methods of Recording& Artifact Rejection
Our recording techniques have been described elsewhere (Kennedy et al 2000, Kennedy 2006). Briefly, the implanted amplifiers have gains of 100x with a bandpass filter of 4 to 4,000 Hz. An external amplifier for each channel (CWE Inc.) have gains of 100x, with a bandpass filter of 1 to 10,000 Hz. The receivers (WinRadio Inc., Oakleigh, Australia) are tuned to the FM frequencies in the range of 30 to 50 MHz. Data are archived on a DDS digital tape recorder (SCSI 16 channel, 20 KHz for the neural signal inputs, from Cygnus Inc., PA, USA.). To separate the single units from the continuous data streams a filter setting of 300 to 6,000 Hz is used. Artifacts are rejected in a two-step process; in the first step, the continuous data are passed through a noise squelch algorithm, using a predetermined threshold of 10 μV. In the second step, we detect and eliminate sharp-transient artifacts through an automated process (Figure 1C). Sharp transients often occur during slight displacements of the power induction coil when the subject has a spasm or cough because the tethered receiving coils may be slightly dislodged when the subject moves forward out of the wheelchair. There is slack in the tether so that this displacement is usually slight or occurs not at all. When such artifacts are more severe, the recordings are automatically interrupted for a user-determined period of time (typically 1 second).
A more subtle type of artifact is illustrated in figure 1D. This occurs after receiving coils are displaced such as during a gentle and gradual spasm. The top trace shows stable multi-unit data over a 7.33 s period at rest, and the lower trace shows similar continuous data where the spasm begins at the time indicated by the arrow. With the displacement of the coil, the recording frequency changes and the interference begins. Ten units are displayed over 800 ms of time. The ‘blue gap’ indicates the drop in firing rates associated with the spasm caused by a temporary displacement of the coil. The firing rates recover after the spasm. The spike sorting program fails to classify units when distorted (figure 1E). These data are not then included in the analyses.
Spike sorting
Cheetah Spike Sorting software (Neuralynx Inc, Boseman, MT) was used to sort the continuous data streams into single or multi-units, using a convex hull algorithm which uses parameters such as peak, valley, or height of the presumptive spikes. The program first classifies units into upward or downward deflecting potentials, and then applies peak and valley parameters for unit separation. We have found that the potentials recorded with our system were very stable from recording session to recording session, likely because they were recorded from the same neural elements with the same electrodes in the same topographic arrangement. Once generated, the spike sorting parameters have therefore been used across multiple recording sessions. The cluster parameters are only re-determined when the recording system is disturbed (for instance, when electronic components are damaged and surgically replaced).
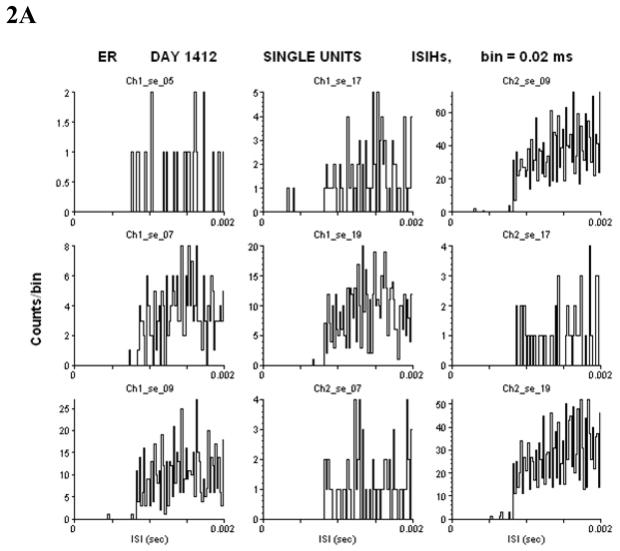
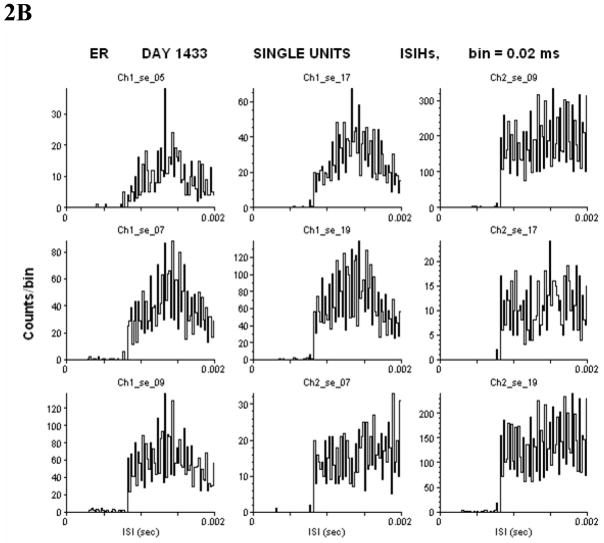
To determine if the detected units are single or multi-units, inter-spike interval histograms (ISIHs) are used. Given the fact that neurons have a refractory period of > 1 ms, the presence of very short ISIs (< 1 ms) is taken as an indicator that potentials from more than one axon contributed to the spiking pattern consideration. Examples of the 0–2 ms range of ISIHs from the same units from days 1412 and 1435 are shown in figure 2A and 2B over a 2 ms time span (units with no events in this time window are not shown). Change is defined as an increase (or decrease) in rate that is twice (or half) the baseline. Not all changes shown below were changes in state: Some were transient.
Figure 2.
Interspike interval histograms from day 1412 (A) and day 1433 (B) demonstrate single units whose firing rates fall to zero within the first 1 ms time bin. Other units with rates too low to include in a meaningful histogram also fall to zero (not shown). All other units on these days did not fall to zero implying multi-units (not shown). ISIH of the non-clustered (noise) data also did not fall to zero (not shown). Subject ER.
Subjects and Recording Sessions
The data presented here are from two subjects. One of these, JR, was a 52 year old patient who was locked-in after having suffered a brainstem stroke (see also Kennedy et al 2000). This patient was bedbound and on a ventilator, sessions were conducted three times per week and each continued for several hours, interrupted by suctioning the tracheal tube, rest periods, and terminated due to fatigue. This patient was able to communicate ‘yes’ by double blinking, and ‘no’ by a single blink. For part of the recordings, he was on multiple medications (including sedating agents).
The other patient, ER, was 26 years old at the time of recording, suffered a brainstem stroke when he was 16 years old and is locked-in. He has been implanted for five years (see also Guenther et al 2009, Brumberg et al 2009). This patient was involved in a speech production task. The specifics of the task are not further described here, as they are irrelevant to the topic of this report. Recording sessions began on a three-day-per-week schedule three months after implantation on December 22, 2004 and still continue as of this writing. ER communicates, unlike JR, by moving his eyes up for ‘yes’ and down for ‘no’. He takes modafinil to increase wakefulness at the beginning of each session and 30 minutes before any data is recorded. He does not take other medications, and is not artificially ventilated. In this case, the recording sessions are terminated if the subject becomes fatigued. To minimize fatigue, the patient at times listens to music for approximately 2 to 3 minutes after each 10 minutes of data collection. He indicates that he enjoys the sessions, though they are ‘hard work’. During most sessions his father remains with him to encourage him, stretch his limbs and suction his throat as necessary. Spasms are a daily occurrence but minimized by stretching.
All studies are approved by the FDA, the IRB of the Gwinnett Medical Center where the implantation was performed and the IRB of Neural Signals Inc. The studies are also supervised by the Data Monitoring and Safety Committee of Neural Signals Inc. The patient’s legal representative gave written consent to all procedures after the subject used eye movements to give his consent.
The subjects’ emotions are determined not by observation or vocalization, since they are paralyzed, but by interrogation. This was particularly true for ER who is quizzed after each session using questions that he could affirm ordeny, and then re-questioned by asking the question in reverse so as to confirm veracity.
RESULTS
The recordings in JR over four years (1998 to 2002) were highly variable. For example, during the initial phase of each recording session, the neuronal activity was much higher than at the start of task-training later in the session when it often ceased entirely. However, within a short period of task performance, single and multi-unit activity typically re-appeared. Quietude followed by increased activity has already been reported in similar experiments in monkeys (Kennedy et al, 1993, Kennedy and Bakay 1997).
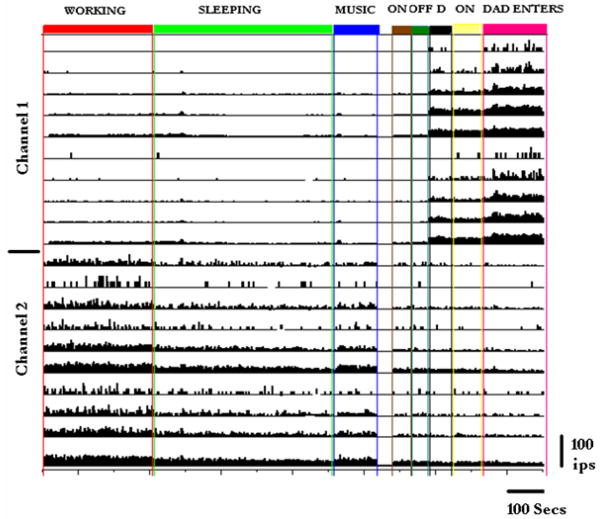
The same type of activity changes were seen in our present subject, ER. An example is shown in figure 3: On day 1412 after implantation, subject ER was performing a task for five minutes as illustrated (red panel on left, titled ‘WORKING’). Channel 1 data are above and channel 2 data below in the figure where each row represents the firing rate of recorded units. He then took a break as illustrated in the green panel, when he nodded off to sleep (green panel ‘SLEEPING’). Sleep was defined as slow breathing with eyes closed. Upon arousal he was questioned as regards his level or alertness. Activity on all channels became quieter than during working. Eight minutes later we turned on music to wake him up (blue panel, ‘MUSIC’): Channel 2 became active again, but not channel 1. We then induced various changes in the ambient lighting condition. Turning the light first up for one minute and then off (brown area indicates ‘on’ and dark green area indicates ‘off’) produced little change in firing rates. During this period, the background room lights were still on, as were colored lights from the electronics behind him so darkness was not complete. We next switched all lights off, except for some light associated with the recording equipment. This had a marked effect on the firing rates of units in channel 1, but little effect on channel 2. When the room lights were turned back on (yellow area, ‘ON’) there was only a small effect on the firing rates in either channel mainly affecting the slower firing units. When his father entered the room, however, there was a dramatic general increase in channel 1 firing. There was minimal effect on channel 2 firings.
Figure 3.
The long 23 minute sequence of recording is described in detail in the text. Channel 1 unit firings are in the upper half of the figure and channel 2 unit firings are in the lower half. All units are single units. Firing rates are calibrated on the same scale. Day 1412. Subject ER.
To understand this unusual sequence, especially the increase in firing associated with darkness, we questioned the patient. He stated (by moving his eyes up for ‘yes’ and down for ‘no’) that he was afraid of the dark, and relieved and happy when his father entered the room. These and other observations appeared to indicate that the units in channel 1 appear to strongly respond to emotions, such as fear or relief, while the ones in channel 2 appear to be more active during work and less responsive to emotion.
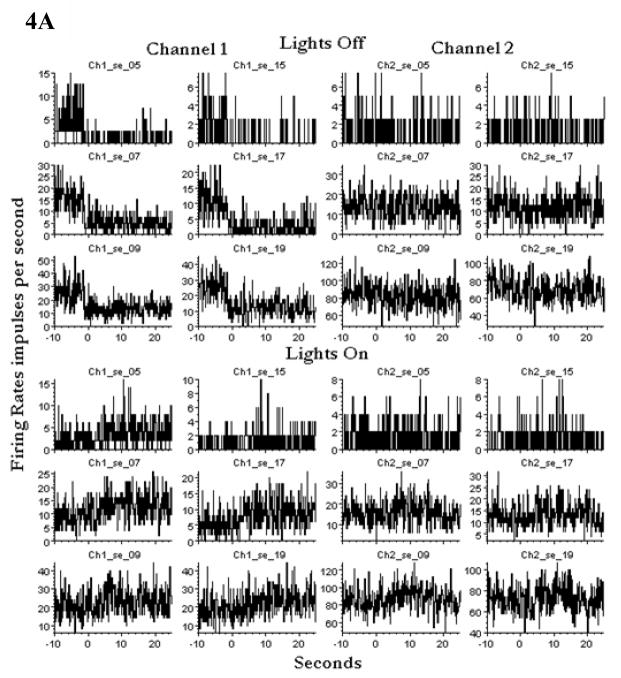
To assess the effect of darkness, on days 1431 and 1433, the projector light was turned on and off suddenly four times, plunging the room in and out of darkness. As shown for day 1433 in figure 4A, the average firing rates of selected units decreased when the light was turned off and increased less markedly when turned on, with all changes on channel 1 mainly. These results appeared to be inconsistent with the increase in firing rate when lights were turned off on day 1412 in figure 3, and suggested that perhaps light itself was the cause of the increased firing rates.
Figure 4.
A: Room lights were turned off and on, and the averages of four episodes of each are presented here. The channel 1 units that did not change firing rates are omitted from the figure. Changes occurred in channel 1 but minimally in channel 2. Note the different abscissa values. Lowest firing units(40%)are omitted because their rates did not change. Day 1433. Subject ER.
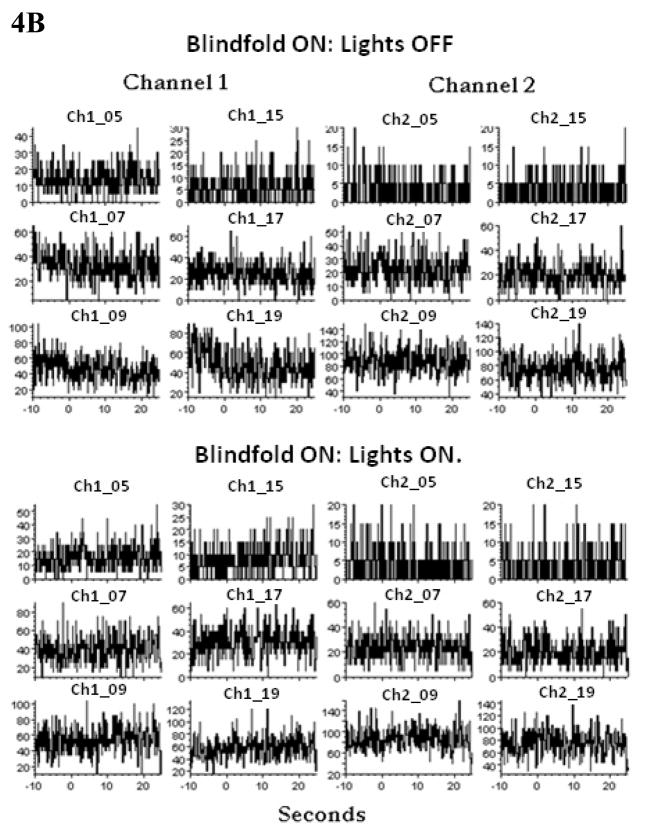
B. After the subject was blindfolded, the ambient and room lights were turned off and on, three times each and the averages are presented here. The same units that changed firing rates in the panel A above are presented here for comparison. Note the different Y axis values. The firing rates did not change defined as an increase (or decrease) that is twice (or half) the baseline. Day 1435. Subject ER. Again the lowest firing units are omitted (40%).
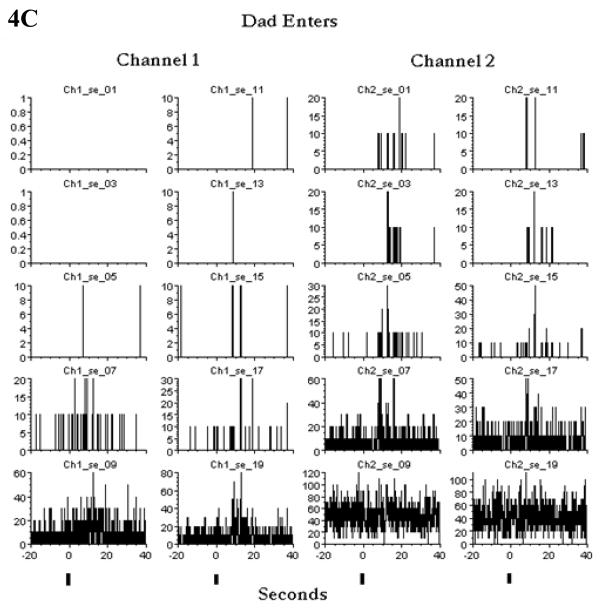
C: Channel 1 and channel 2 units on day 1431 produce increases in firing rates when his Dad enters the room. The increase occurs even in those units that usually do not fire at high rates. Unlike the data from day 1412 (figure 3), the channel 2 units are also involved on this day 1431. The vertical dash marks indicate the approximate time when his Dad enters the room. Day 1431. Subject ER. All units included because changes occurred in most units. Not all changes shown below were changes in state: Some were transient.
On day 1435 (figure 4B), the subject was blindfolded with his and his father’s permission so he saw no light at all. The room lights were turned on and off three times: There was no effect on the firing rates as shown in figure 4B. Thus the presence of the light had no artifactual effect on recording or spike detection. In comparison to the firing rates on the Day 1433 (figure 4A), the average firing rates are higher, however. In other experiments, we turned the lights on and off each three times before and three times after the blindfold section of data collection. There were no appreciable changes in firing rates. Taken together, these results suggest that the increase in firing rates seen in figure 3 was due to fear (as he later confirmed) and not due to the light itself.
To further examine whether emotions other than fear would also affect neuronal activity, we examined possible firing rate changes at those times at which his father entered the room. His father should not produce a fear reaction. On day 1412 (figure 3, above), a large increase in firing rate coincided with his father entering the room. A repeat of this response was seen on day 1431 (figure 4C), when the entrance of his father resulted in a large response in the units in both channels 1 and 2 (including fast and slow firing units).
DISCUSSION
These observations suggest that unexplained modulations in neuronal firing rates may (among other influences) be associated with emotional responses, such as fear or happiness. Other factors such as drowsiness, fatigue, boredom may also affect neuronal firing, as illustrated in the example of sleep-related reductions in firing in the green panel in figure 3. The polarity of such arousal-related responses appears to be variable; while decreases were seen in subject ER, the opposite occurred in subject, JR. The observations made at that time suggested that this increase occurred only when JR was deeply asleep such as stage 3 or 4, as indicated by the presence of large amplitude delta waves of 3 to 4 Hz in the EEG. Our present subject, ER, slept for much shorter periods of time (figure 3, green panel) which would not suffice to achieve deep sleep, especially in a person treated with modafinil. It is possible that stage 1 or 2 sleep produces a decrease in neuronal firing rates, while deep sleep may result in an increase in firing. Further studies are of course needed for verification of these observations.
The question of state changes in firing rates during fear and happiness still appears open. The data presented here are merely observational and require confirmation. Nevertheless, the results suggest the intriguing possibility that emotion can have an unexpected effect on firing rates. The phenomenon of habituation may have occurred with respect to the ambiguous result obtained when testing for responses to the presumed fear stimuli during session 1433. This session was many sessions after the initial lights off session and the subject’s responses may have habituated.
The neural basis of emotional localization is being studied in humans. A large meta-analysis of 1600 healthy subjects involving 105 studies (Fusar-Poli et al 2009) concludes that neural responses associated with emotional face processing are activated in the visual, limbic, temporo-parietal and prefrontal cortices, the putamen and the cerebellum. It is of interest that our target, the premotor speech cortex in subject ER, is one of the areas included. However, the other subject (JR), was implanted in the area 4 hand area. However, neither JR nor ER were subjected to face-associated emotions.
Unexplained modulations in firing rates of the kind described in this paper have not often been studied in non-human recordings but some studies are available in monkeys. The monkey’s behavior can result in variable firing. Lack of firing is usually assumed to be due to losing the recorded unit. But this is not always so. An example of how behavior affects unit firing is found in studies of the monkey magnocellular red nucleus using single tungsten microelectrodes inserted each day (Kennedy 1987). Operantly trained monkeys reached and grasped for food pellets during these recordings. Units from the intermediate part of the nucleus that were shown to contain medium sized cells on histological reconstruction modulated strongly to movements but had no baseline firing rates during rest periods. This lack of firing surprised visitors to the recording room who assumed the cell had been lost or destroyed by the electrode until the unit fired again during movement. The silent units would have been missed entirely except that advancement of the electrode was made while the monkey reached and grasped for food pellets. It is easy to see how so called ‘silent’ units can be missed due to the behavior or lack of behavior of the subject.
The issue of quiet units is illustrated by another example from monkey studies during chronic recordings with the Neurotrophic Electrode (Kennedy and Bakay 1997). In these studies, a stimulating electrode was placed close to the tip of the Neurotrophic Electrode. The same units were repeatedly recorded from the Neurotrophic Electrode during reaching and grasping for food over many sessions. During electrical stimulation through the adjacent electrode tips using trains of biphasic pulses (20 μA, 30 Hz, train duration 100 –200 ms), increased unit firing was entrained by the stimulation shown in figure 5 of Kennedy and Bakay (1997). When caffeine was then administrated, another large unit appeared, entrained by the stimulation. This unit had been totally silent during previous recordings with or without stimulation. The surprise appearance of this unit lends credence to the data in figure 3 where units can be silent and reappear unexpectedly. In monkey studies, this reappearance may be due to artificial stimulation and medication (Kennedy and Bakay 1997), or due to lack of baseline firing rate (Kennedy 1987). In human studies, it may have a variety of causes, such as emotional factors of fear, surprise and happiness described in this paper.
An important corollary conclusion to be deduced from these data is that monkey recordings are unreliable in their sampling of units: Quiet units that have not been activated are not included in the statistical analysis simply because they are not found. Thus it could be concluded that virtually all monkey recordings using single metal electrodes consist of biased samples. The situation is much better nowadays with tine type electrodes implanted for long-term recordings (Hochberg et al 2006, Kennedy 2006, Maynard et al 1997, Nicholelis et al 2003, Velliste et al 2008). An additional implication is that the gradual loss of signal in these tine type systems may not always be due to the destruction of units or due to moving away from units, but alternatively it may be due to unit firing becoming quiet for the reasons enumerated above.
The data in figure 3 are intriguing because the channel 1 single units are quiet during work but active during the later times when his father enters the room. The channel 2 units are active during the work period and less active when his father enters the room. On day 1431, however, the channel 2 units did increase firing rates when his dad entered the room. Taking into account the control experiments described in results, and the discussion above, the difference would appear to be due to a difference in function. In other words, channel 1 units were more responsive to emotional stimuli on that specific day. The populations of neurons that supply the myelinated axons that grow through the electrode tip arise from different and widespread areas of the cortex. Rat histological analysis demonstrates that neurons of origin arise at least 600 microns from the electrode tip (Kennedy 1989). Thus channel 1 and 2 units may arise from functionally different cortical neurons or those neurons of origin may receive afferents from brain regions where emotional responses are localized (Fusar-Poli et al 2009).
Techniques for controlling firing rate variability
To improve consistency of recordings in humans, we have used various techniques. In our earlier subject, JR, we simply recorded when he was awake and had not recently been given an analgesic or sedative. In our present subject, ER, we have attempted to control for these factors as follows. 30 minutes before acquiring data we provide him with modafinil to enhance wakefulness. He did indicate that this medication increases his alertness. In addition, his favorite music is played for two minutes between trials. His father is almost always with him during the session to encourage him and to understand his needs and emotions. Extraneous noises or other surprises are minimized. Finally, during some sessions we fed back his resting alpha waves via the recordings and music. When we wanted to rouse him, we related the volume of the music directly to the amplitude of the resting 8–12 Hz alpha waves so that as his EEG frequency changed from slow theta to resting alpha, the music turned on and woke him up. As alpha disappeared when he became fully awake, the music volume turned down.
In attempts to develop brain-machine interfaces based on chronic neuronal recordings, it is obviously desirable to minimize variability in firing during recording. The techniques described above are an attempt to minimize emotional and fatigue related variables, but are not always sufficient. A strategy of developing decoding paradigms that recognize the variables and minimize their effects on the data is also essential. Recording from the human brain is like sailing on the ocean: Sometimes it is calm, but more often it is not.
Acknowledgments
The author thanks Thomas Wichman (Emory Univ., Dept. Neurology, Atlanta, GA)and Meel Velliste (Dept of Neurobiology, University of Pittsburgh, Pittsburgh, PN)for reviewing the MS. He also thanks Dinal Andreasen (electronic development, Georgia Institute of Technology, Cobb Co. Atlanta, Georgia, 30319), Prince will Ehirim (subject ER implantation, Dept. Neurosurgery, Gwinnett Medical Center, Lawrenceville, Georgia 30350), Dr. Roy Bakay (subject JR implantation), Hui Mao (functional MRI, Dept. Radiology, Emory University Hospital, Atlanta, Georgia 30332), and E. Joe Wright (Software programming, Neural Signals Inc).
Supported by grants from the NIDCD R43&R44-DC007050.
References
- Allen TA, Furtak SC, Brown TH. Single-unit responses to 22 kHz ultrasonic vocalizations in rat perirhinal cortex. Behav Brain Res. 2007;4;182(2):327–36. doi: 10.1016/j.bbr.2007.03.009. Epub. [DOI] [PMC free article] [PubMed] [Google Scholar]
- Baeg EH, Kim YB, Jang J, Kim HT, Mook-Jung I, Jung MW. Fast spiking and regular spiking neural correlates of fear conditioning in the medial prefrontal cortex of the rat. Cereb Cortex. 2001;11(5):441–51. doi: 10.1093/cercor/11.5.441. [DOI] [PubMed] [Google Scholar]
- Bartel J, Andreasen D, Ehirim P, Mao H, Seibert S, Wright EJ, Kennedy P. Neurotrophic electrode: method of assembly and implantation into human motor speech cortex. J Neurosci Methods. 2008;174(2):168–176. doi: 10.1016/j.jneumeth.2008.06.030. [DOI] [PMC free article] [PubMed] [Google Scholar]
- Fusar-Poli P, Placentino A, Carletti F, Landi P, Surguladze S, Benedetti F, Abbamonte M, Gasparotti R, Barale F, Perez J, McGuire P, Politi P. Functional atlas of emotional faces processing: a voxel-based meta-analysis of 105 functional magnetic resonance imaging studies. J Psychiatry Neurosci. 2009;34(6):418–32. [PMC free article] [PubMed] [Google Scholar]
- Hochberg LR, Serruya MD, Friehs GM, Mukand JA, Saleh M, Caplan AH, Branner A, Chen D, Penn RD, Donoghue JP. Neuronal ensemble control of prosthetic devices by a human with tetraplegia. Nature. 2006;442(7099):164–171. doi: 10.1038/nature04970. [DOI] [PubMed] [Google Scholar]
- Kennedy PR, Bakay RAE, Moore MM, Adams K, Goldwaithe J. Direct control of a computer from the human central nervous system. IEEE Transactions on Rehabilitation Engineering. 2000;8(2):198–202. doi: 10.1109/86.847815. [DOI] [PubMed] [Google Scholar]
- Kennedy PR, Bakay RAE. Activity of single action potentials in monkey motor cortex during long-term task learning. Brain Research. 1997;760:251–4. doi: 10.1016/s0006-8993(97)00051-6. [DOI] [PubMed] [Google Scholar]
- Kennedy PR, Mirra S, Bakay RAE. The Cone Electrode: Ultrastructural Studies Following Long-Term Recording. Neuroscience Letters. 1992a;142:89–94. doi: 10.1016/0304-3940(92)90627-j. [DOI] [PubMed] [Google Scholar]
- Kennedy PR, Bakay RAE, Sharpe SM. Behavioral correlates of action potentials recorded chronically inside the Cone Electrode. Neuro Report. 1992b;3:605–608. doi: 10.1097/00001756-199207000-00015. [DOI] [PubMed] [Google Scholar]
- Kennedy PR, Howell LL, Bakay RAE, Verellan R, Echard J. The quietude of primate cerebral cortex is interrupted by microstimulation plus caffeine administration during chronic Cone Electrode recordings. Soc Neurosci Abstr. 1993;19(1):777. [Google Scholar]
- Kennedy PR. A long-term electrode that records from neurites grown onto its recording surface. J Neuroscience Methods. 1989;29(1989):81–193. doi: 10.1016/0165-0270(89)90142-8. [DOI] [PubMed] [Google Scholar]
- Kennedy PR. Parametric Relationships of Individual Digit Movements to Neuronal Discharges in Primate Magnocellular Red Nucleus. Brain Research. 1987;417:185–9. doi: 10.1016/0006-8993(87)90198-3. [DOI] [PubMed] [Google Scholar]
- Maynard EM, Nordhausen CT, Normann RA. The UtahIntracortical Electrode Array: A recording structure for potential brain-computer interfaces. Electroencephalography and Clinical Neurophysiology. 1997;102(3):228–239. doi: 10.1016/s0013-4694(96)95176-0. [DOI] [PubMed] [Google Scholar]
- Nicolelis MAL, Dimitrov D, Carmena JM, Crist R, Lehew G, Kralik JD, Wise SP. Chronic, multisite, multielectrode recordings in macaque monkeys. Proceedings of the National Academy of Sciences of the United States of America. 2003;100(19):11041–11046. doi: 10.1073/pnas.1934665100. [DOI] [PMC free article] [PubMed] [Google Scholar]
- Velliste M, Perel S, Spalding MC, Whitford AS, Schwartz AB. Cortical control of a prosthetic arm for self-feeding. Nature. 2008;453(7198):1098–101. doi: 10.1038/nature06996. [DOI] [PubMed] [Google Scholar]


