

Abstract
The zebra finch is an important model organism in several fields1,2 with unique relevance to human neuroscience3,4. Like other songbirds, the zebra finch communicates through learned vocalizations, an ability otherwise documented only in humans and a few other animals and lacking in the chicken5—the only bird with a sequenced genome until now6. Here we present a structural, functional and comparative analysis of the genome sequence of the zebra finch (Taeniopygia guttata), which is a songbird belonging to the large avian order Passeriformes7. We find that the overall structures of the genomes are similar in zebra finch and chicken, but they differ in many intrachromosomal rearrangements, lineage-specific gene family expansions, the number of long-terminal-repeat-based retrotransposons, and mechanisms of sex chromosome dosage compensation. We show that song behaviour engages gene regulatory networks in the zebra finch brain, altering the expression of long non-coding RNAs, microRNAs, transcription factors and their targets. We also show evidence for rapid molecular evolution in the songbird lineage of genes that are regulated during song experience. These results indicate an active involvement of the genome in neural processes underlying vocal communication and identify potential genetic substrates for the evolution and regulation of this behaviour.
As in all songbirds, singing in the zebra finch is under the control of a discrete neural circuit that includes several dedicated centres in the forebrain termed the ‘song control nuclei’ (for an extensive series of reviews see ref. 8). Neurophysiological studies in these nuclei during singing have yielded some of the most illuminating examples of how vocalizations are encoded in the motor system of a vertebrate brain9,10. In the zebra finch, these nuclei develop more fully in the male than in the female (who does not sing), and they change markedly in size and organization during the juvenile period when the male learns to sing11. Analysis of the underlying cellular mechanisms of plasticity led to the unexpected discovery of neurogenesis in adult songbirds and life-long replacement of neurons12. Sex steroid hormones also contribute to songbird neural plasticity, in part by influencing the survival of new neurons13. Some of these effects are probably caused by oestrogen and/or testosterone synthesized within the brain itself rather than just in the gonads14.
Song perception and memory also involve auditory centres that are present in both sexes, and the mere experience of hearing a song activates gene expression in these auditory centres15. The gene response itself changes as a song becomes familiar over the course of a day16 or as the context of the experience changes17. The act of singing induces gene expression in the male song control nuclei, and these patterns of gene activation also vary with the context of the experience18. The function of this changing genomic activity is not yet understood, but it may support or suppress learning and help integrate information over periods of hours to days19.
The chicken genome is the only other bird genome analysed to date6. The chicken and zebra finch lineages diverged about 100 million years ago near the base of the avian radiation7. By comparing their genomes we can now discern features that are shared (and thus generally characteristic of birds), and features that are most conspicuously different between the two lineages—some of which will be related to the distinctive neural and behavioural traits of songbirds.
We sequenced and assembled a male zebra finch genome using methods described previously6,20. A male (the homogametic sex in birds) was chosen to maximize coverage of the Z chromosome. Of the 1.2 gigabase (Gb) draft assembly, 1.0 Gb has been assigned to 33 chromosomes and three linkage groups, by using zebra finch genetic linkage21 and bacterial artificial chromosome (BAC) fingerprint maps. The genome assembly is of sufficient quality for the analysis presented here (see Supplementary Note 1 and Supplementary Table 1). A total of 17,475 protein-coding genes were predicted from the zebra finch genome assembly using the Ensembl pipeline supplemented by Gpipe gene models (Supplementary Note 1). To extend further the characterization of genes relevant to brain and behaviour, we also sequenced complementary DNAs from the forebrain of zebra finches at 50 (juvenile, during the critical song learning period) and 850 (adult) days post-hatch, mapping these reads (Illumina GA2) to the protein-coding models (Supplementary Note 1). Of the 17,475 protein-coding gene models we find 9,872 (56%) and 10,106 (57%) genes expressed in the forebrain at these two ages (90.7% overlap), respectively. In addition to evidence for developmental regulation, these reads show further splice forms, new exons and untranslated sequences (Supplementary Figs 1 and 2).
To address issues of large-scale genome structure and evolution, we compared the chromosomes of zebra finch and chicken using both sequence alignment and fluorescent in situ hybridization. These analyses showed overall conservation of synteny and karyotype in the two species, although the rate of intrachromosomal rearrangement was high (Supplementary Note 2). We were also surprised to see genes of the major histocompatibility complex (MHC) dispersed across several chromosomes in the zebra finch, in contrast to the syntenic organization of both chicken and human MHCs (Supplementary Note 2).
We assessed specific gene losses and expansions in the zebra finch lineage by constructing phylogenies of genes present in the last common ancestor of birds and mammals (Supplementary Note 2 and Supplementary Fig. 3). Both the zebra finch and the chicken genome assemblies lack genes encoding vomeronasal receptors, casein milk proteins, salivary-associated proteins and enamel proteins—not surprisingly, as birds lack vomeronasal organs, mammary glands and teeth. Unexpectedly, both species lack the gene for the neuronal protein synapsin 1 (SYN1); comparative analyses suggest that the loss of SYN1 and flanking genes probably occurred in an ancestor to modern birds, possibly within the dinosaur lineage (Supplementary Note 2, Supplementary Table 2 and Supplementary Fig. 4). Both zebra finch and chicken have extensive repertoires of olfactory receptor-like sequences (Supplementary Note 2 and Supplementary Fig. 5), proteases (Supplementary Table 3), and a rich repertoire of neuropeptide and pro-hormone genes.
Compared to mammals, zebra finch has duplications of genes encoding several proteins with known neural functions, including growth hormone, (Supplementary Fig. 3), caspase-3 and β-secretase (Supplementary Table 3). Two large expansions of gene families expressed in the brain seem to have occurred in the zebra finch lineage after the split from mammals. One involves a family related to the PAK3 (p21-activated kinase) gene. Thirty-one uninterrupted PAK3-like sequences have been identified in the zebra finch genome, of which 29 are expressed in testis and/or brain (Supplementary Note 2). The second involves the PHF7 gene, which encodes a zinc-finger-containing transcriptional control protein. Humans only have a single PHF7 gene, but remarkably the gene has been duplicated independently, many times in both the zebra finch and chicken lineages to form species-specific clades of 17 and 18 genes, respectively (Supplementary Fig. 6). In the zebra finch these genes are expressed in the brain (Supplementary Note 2).
An intriguing puzzle in avian genomics has been the evident lack of a chromosome-wide dosage compensation mechanism to balance the expression of genes on the Z sex chromosome, which is present in two copies in males but only one in females22,23. The chicken has been suspected of exerting dosage compensation on a more local level, by the non-coding RNA MHM (male hypermethylated)24,25, to cause a characteristic variation of gene expression along the Z chromosome. The zebra finch genome assembly, however, lacks an MHM sequence, and genes adjacent to the comparable MHM chromosomal position show no special cluster of dosage compensation (Fig. 1 and Supplementary Note 2). Thus, the putative MHM-mediated mechanism of restricted Z-chromosome dosage compensation is not common to all birds. Chromosomal sex differences in the brain could have a direct role in the sex differences so evident in zebra finch neuroanatomy and singing behaviour.
Figure 1. Divergent patterns of dosage compensation in birds.

a, b, The male to female (M/F) ratio of gene expression, measured by species-specific microarrays, is plotted along the Z chromosome of chicken (a) and zebra finch (b). Each point represents the average M/F ratio of a sliding window of 30 genes plotted at the median gene position and stepping one gene at a time along the chromosome. Note region of lower M/F ratios in chicken surrounding the locus of the MHM (male hypermethylated) ncRNA. In zebra finch, genes adjacent to the comparable MHM position (asterisk) show no special cluster of dosage compensation (low M/F ratios), and no MHM sequence appears in the genome assembly. bp, base pairs.
In mammals, as much as half of their genomes represent interspersed repeats derived from mobile elements, whereas the interspersed repeat content of the chicken genome is only 8.5%. We find that the zebra finch genome also has a low overall interspersed repeat content (7.7%), containing a little over 200,000 mobile elements (Supplementary Tables 4 and 5). The zebra finch, however, has about three times as many retrovirus-derived long terminal repeat (LTR) element copies as the chicken, and a low copy number of short interspersed elements (SINEs), which the chicken lacks altogether. Expressed sequence tag (EST) analysis shows that mobile elements are present in about 4% of the transcripts expressed in the zebra finch brain, and some of these transcripts are regulated by song exposure (next section, Table 1). Figure 2 shows an example of an RNA that was identified in a microarray screening for genes specifically enriched in song control nuclei26 and now seems to represent a long non-coding RNA (ncRNA) containing a CR1-like mobile element. These results indicate that further experiments investigating a possible role of mobile-element-derived repeated sequences in vocal communication are warranted.
Table 1. Structural features of the song responsive genome.
| All genes analysed | Novel up | Novel down | Habituate up | Habituate down | |
|---|---|---|---|---|---|
| All ESTs | 17,877 | 145 | 461 | 1,531 | 1,774 |
| Mapped loci | 15,009 | 125 | 435 | 1,217 | 1,112 |
| Ensembl genes | 8,438 | 136 | 301 | 1,138 | 1,136 |
| Mobile element content* | |||||
| Number with mobile elements | 688 | 2 | 40 | 32 | 38 |
| Percentage mobile elements | 4 | 1 | 9 | 2 | 2 |
| P-value | 2 | 0.18 | 1.4×10⁻⁵ | 0.005 | 0.004 |
| Coding and non-coding content† | |||||
| mRNA transcripts (% (P-value)) | 59 | 86 (0.05) | 32 (1 × 10⁻¹⁰) | 65 (0.05) | 71 (0.001) |
| EST loci mapped to introns (% (P-value)) | 6 | 1 (0.05) | 21 (1 × 10⁻¹⁰) | 3 (0.001) | 6 |
| Intergenic loci (% (P-value)) | 33 | 12 (0.001) | 45 (0.05) | 31 | 21 (0.001) |
| Protein-coding gene territories‡ | |||||
| Mean gene length (kb) | 30.4 | 21.7 | 78.8 | 34.8 | 31.2 |
| Intergenic length (kb) | 57.4 | 42.3 | 108.0 | 64.9 | 55.3 |
| Territory size (kb) | 87.8 | 64.1 | 186.8 | 99.7 | 86.4 |
| P-value | – | 3.9 × 10⁻³ | 1.7 × 10⁻²⁸ | 9.3 × 10⁻¹⁰ | 1.4 × 10⁻⁴ |
A microarray made from non-redundant brain-derived ESTs34 was used to define four subgroups of RNAs that show different responses in auditory forebrain to song exposures (novel up and down, habituated up and down)27. These ESTs were mapped to genome positions as described (Supplementary Note 3).
All ESTs were analysed for mobile element content using RepeatMasker (Supplementary Note 2). P-value is for the comparison to all genes (Fisher's exact test).
All ESTs that could be mapped uniquely to the genome assembly were assessed for overlap with Ensembl annotations of mRNA transcripts (protein coding and UTRs), intronic regions, or intergenic regions. P-value is for comparison to all mapped loci (Fisher's exact test). Results are the percentage with P values in parentheses where shown.
The size of each unique protein-coding gene territory was determined by combining the length of the Ensembl gene model with its intergenic spacing. The P-value is for the comparison to all genes, using a two-tailed Wilcoxon rank sum test.
Figure 2. Enriched expression of a CR1-like element in the zebra finch song system.
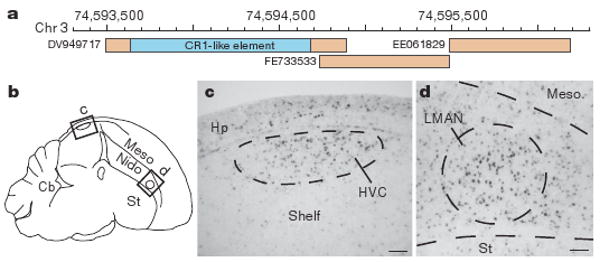
a, Genomic alignment of an RNA containing a CR1-like retrotransposon element (in blue) and adjacent ESTs, with respective GenBank accession numbers. b–d, DV949717 is expressed in the brain of adult males with enrichment in song nuclei HVC (letter-based name) and LMAN (lateral magnocellular nucleus of the anterior nidopallium), as revealed by in situ hybridization. The diagram in b indicates areas shown in photomicrographs in c and d. Cb, cerebellum; Hp, hippocampus; Meso, mesopallium; Nido, nidopallium; Shelf, nidopallial shelf region; St, striatum. Scale bars, 0.1 mm.
A large portion of the genome is directly engaged by vocal communication. A recent study27 defined distinct sets of RNAs in the auditory forebrain that respond in different ways to song playbacks during the process of song-specific habituation, a form of learning16. We now map each of these song-responsive RNAs to the genome assembly (Table 1 and Supplementary Note 3). Notably, we find evidence that ∼40% of transcripts in the unstimulated auditory fore-brain are non-coding and derive from intronic or intergenic loci (Table 1). Among the RNAs that are rapidly suppressed in response to new vocal signals (‘novel down’), two-thirds are ncRNAs.
The robust involvement of ncRNAs in the response to song led us to ask whether song exposure alters the expression of microRNAs—small ncRNAs that regulate gene expression by binding to target messenger RNAs. Indeed we find that miR-124, a conserved microRNA implicated in neurological function in other species28, is rapidly suppressed in response to song playbacks (Fig. 3). We independently measured this effect by direct Illumina sequencing of small RNAs in the auditory forebrain, and also identified other known and new microRNAs, several of which also change in expression after song stimulation (Supplementary Note 2).
Figure 3. miR-124 in the auditory forebrain is suppressed by exposure to new song.

TaqMan assays comparing samples from the auditory lobule of adult male zebra finches in silence (open bars) or 30 min after onset of new song playback (filled bars). a, Comparison of two sample pools, each containing auditory forebrains of 20 birds. b, Comparisons of paired individual subjects, n = 6 pairs (P = 0.03, Wilcoxon paired test). Error bars denote s.e.m. of triplicate TaqMan assays. Parallel TaqMan analyses of the small RNA RNU6B were performed with all samples and showed no significant effect of treatment for this control RNA.
A potential site of action for microRNAs was shown by genomic mapping of transcripts that increase rapidly after new song exposure (Table 1, ‘novel up’). Two of the cDNA clones that measured the most robust increases27 align to an unusually long (3 kilobases (kb)) 3′ untranslated region (UTR) in the human gene that encodes the NR4A3 transcription factor protein (Fig. 4a). The entire UTR is similar in humans and zebra finches, with several long segments of >80% identity (Fig. 4b). Within these segments we find conserved predicted binding sites for 11 different microRNAs, including five new microRNAs found by direct sequencing of small RNAs from the zebra finch forebrain (Fig. 4b). These findings indicate that this NR4A3 transcript element may function in both humans and songbirds to integrate many conserved microRNA regulatory pathways.
Figure 4. Conserved NR4A3 3′ UTR is a potential region for microRNA integration.

a, zPicture alignment of 3′ portion of zebra finch to human gene35 showing UTR region of high similarity beyond the coding exons. Dark red bars, regions with the highest sequence conservation; black rectangles, position of song-regulated ESTs27 within the conserved UTR but outside the Ensembl gene model (ENSTGUG00000008853). b, Alignment of zebra finch and human 3′ UTR sequences showing the per cent sequence identity for each evolutionarily conserved region. Dots indicate positions of conserved new (‘n-’) or established (‘miR-’) microRNA-binding sites in both species within these regions.
The act of singing also alters gene expression in song control nuclei29, and we used the genome assembly to analyse the transcriptional control structure of this response. Using oligonucleotide microarrays, we identified 807 genes in which expression significantly changed as a result of singing. These were grouped by k-means clustering into 20 distinct expression profile clusters (Fig. 5a and Supplementary Note 3). Gene regulatory sequences (transcription-factor-binding sites) were predicted across the genome using a new motif-scanning approach (Supplementary Note 1), and we observed significant correlation between changes in expression of transcription factor genes and their predicted targets (Fig. 5b and Supplementary Table 6). Thus, the experience of singing and hearing song engages complex gene regulatory networks in the forebrain, altering the expression of microRNAs, transcription factor genes, and their targets, as well as of non-coding RNA elements that may integrate transcriptional and post-transcriptional control systems.
Figure 5. Transcriptional control network in area X engaged by singing.

a, Clustered (1–20) temporal expression profiles of 807 genes (rows) that change with time and amount of singing; red, increases; blue, decreases; white, no change relative to average 0-h control. Grey/coloured bars on left, clusters with enrichment of specific promoter motifs (P < 0.01). b, Enriched transcription-factor-binding motifs (abbreviations) found in the promoters of late response genes, clusters 9–12 (coloured as in a); bold, binding sites for known activity-dependent transcription factors (for example, CREBP1) or transcription factor complexes (for example, CREBP1–CJUN); black, sites for post-translationally activated transcription factors; brown, sites for transcriptionally activated transcription factors including by singing (for example, in cluster 1). Graph shows time course of average expression of all genes in the late response clusters, normalized to average 0 h for that cluster. Also plotted is the average expression of the C-FOS transcription factor mRNA, which binds to the AP-1 site over-represented in the promoters of cluster 10 genes.
Learned vocal communication is crucial to the reproductive success of a songbird, and this behaviour evolved after divergence of the songbird lineage5. Thus, it seems likely that genes involved in the neurobiology of vocal communication have been influenced by positive selection in songbirds. With this in mind, we examined the intersection of two sets of genes: (1) those that respond to song exposure in the auditory forebrain as discussed in the previous section; and (2) those that contain residues that seem to have been positively selected in the zebra finch lineage, as determined using phylogenetic analysis by maximum likelihood (PAML) (Supplementary Note 4). There are 214 genes that are common to both lists. Of these, 49 are suppressed by song exposure (Supplementary Table 7), and 6 of these 49 are explicitly annotated for ion channel activity (Table 2). This yields a highly significant statistical enrichment for the term ‘ion channel activity’ (P = 0.0016, false discovery rate (FDR) adjusted Fisher's exact test) and other related terms in this subset of genes (Supplementary Tables 8 and 9). Independent evidence has also demonstrated differential anatomical expression of ion channel genes in song control nuclei26,30. Ion channel genes have important roles in many aspects of behaviour, neurological function and disease31. This class of genes is highly likely to be linked to song behaviour and should be a major target for future functional studies.
Table 2. Song-suppressed ion channel genes under positive selection.
| Gene | Description | Branch Δω | Sites PS/total |
|---|---|---|---|
| CACNA1B | Voltage-dependent N-type calcium channel subunit α-1B | 0.016 | 9/2,484 |
| CACNA1G | Voltage-dependent T-type calcium channel subunit α-1G | 0.044* | 2/2,468 |
| GRIA2 | Glutamate receptor 2 precursor (GluR-2, AMPA 2) | 0.231* | 17/948 |
| GRIA3 | Glutamate receptor 3 precursor (GluR-3, AMPA 3) | −0.010 | 4/894 |
| KCNC2 | Potassium voltage-gated channel subfamily C member 2 (Kv3.2) | 0.315* | 32/654 |
| TRPV1 | Transient receptor potential cation channel subfamily V member 1 | −0.067 | 3/876 |
These six genes are suppressed by song exposure (FDR = 0.05)27 and they show evidence of positive selection in the zebra finch relative to chicken (P < 10−3, Supplementary Note 3). Branch Δω denotes the difference in the non-synonymous to synonymous substitution ratio (dN/dS) between zebra finch and other birds (chicken and the ancestral branch leading to chicken and zebra finch). Positive values indicate that the gene is rapidly evolving, whereas negative values indicate genes evolving more slowly. Sites PS/total denotes the number of individual sites with empirical Bayes posterior probability greater than 0.95 of ω > 1 (positive selection) in the finch versus the total number of residues in the protein, from branch-site model analysis implemented in PAML. Note that genes can show overall slower evolution in the branch model yet show evidence of significant positive selection at specific sites.
Gene-wide differences that were significant (P < 0.05) by a likelihood ratio test.
Passerines represent one of the most successful and complex radiations of terrestrial animals7. Here we present the first, to our knowledge, analysis of the genome of a passerine bird. The zebra finch was chosen because of its well-developed status as a model organism for a number of fields in biology, including neurobiology, ethology, ecology, biogeography and evolution. In the zebra finch as in the chicken, we see a smaller, tighter genome compared to mammals, with a marked reduction of interspersed repeats. The zebra finch presents a picture of greater genomic plasticity than might have been expected from the chicken and other precedents, with a high degree of intrachromosomal rearrangements between the two avian species, gene copy number variations and transcribed mobile elements. Yet we also see an overall similarity to mammals in protein-coding gene content and core transcriptional control systems.
Our analysis suggests several channels through which evolution may have acted to produce the unique neurobiological properties of songbirds compared to the chicken and other animals. These include the management of sex chromosome gene expression, accelerated evolution of neuronal ion transport genes, gene duplications to produce new variants of PHF7, PAK3 and other neurobiologically important genes, and a new arrangement of MHC genes. Most notably, our analyses suggest a large recruitment of the genome during vocal communication, including the extensive involvement of ncRNAs. It has been proposed that ncRNAs have a contributing role in enabling or driving the evolution of greater complexity in humans and other complex eukaryotes32. Seeing that learned vocal communication itself is a phenomenon that has emerged only in some of the most complex organisms, perhaps ncRNAs are a nexus of this phenomenon.
Much work will be needed to establish the actual functional significance of many of these observations and to determine when they arose in avian evolution. This work can now be expedited with the recent development of a method for transgenesis in the zebra finch33. An important general lesson, however, is that dynamic and serendipitous aspects of the genome may have unexpected roles in the elaborate vocal communicative capabilities of songbirds.
Methods Summary
Sequence assembly
Sequenced reads were assembled and attempts were made to assign the largest contiguous blocks of sequence to chromosomes using a genetic linkage map21, fingerprint map and synteny with the chicken genome assembly Gallus_gallus-2.1, a revised version of the original draft6 (Supplementary Note 1).
Genes
Gene orthology assignment was performed using the EnsemblCompara GeneTrees pipeline and the OPTIC pipeline (Supplementary Note 1). Orthology rate estimation was performed with PAML (pairwise model = 0, Nssites = 0). In all cases, codon frequencies were estimated from the nucleotide composition at each codon position (F3X4 model).
Gene expression and evolution
Methods for Illumina read counting, in situ hybridization, TaqMan RT–PCR, microarrays, regulatory motif and evolutionary rate analyses are given in Supplementary Notes 1–4.
Supplementary Material
Acknowledgments
Acknowledgements The sequencing of zebra finch was funded by the National Human Genome Research Institute (NHGRI). Further research support included grants to D.F.C. (NIH RO1 NS045264 and RO1 NS051820), H.E. (Swedish Research Council and Knut and Alice Wallenberg Foundation), E.D.J. (HHMI, NIH Directors Pioneer Award and R01 DC007218), M.A.B. (NIH RO1 GM59290) and J.S. (Biotechnology and Biological Sciences Research Council grant number BBE0175091). Resources for exploring the sequence and annotation data are available on browser displays available at UCSC (http://genome.ucsc.edu), Ensembl (http://www.ensembl.org), the NCBI (http://www.ncbi.nlm.nih.gov) and http://aviangenomes.org. We thank K. Lindblad-Toh for permission to use the green anole lizard genome assembly, the Production Sequencing Group of The Genome Center at Washington University School of Medicine for generating all the sequence reads used for genome assembly, and the Clemson University Genome Institute for the construction of the BAC library. We would like to recognize all the important published work that we were unable to cite owing to space limitations.
Accessory Figure 1. Predicted motif genome location distribution.
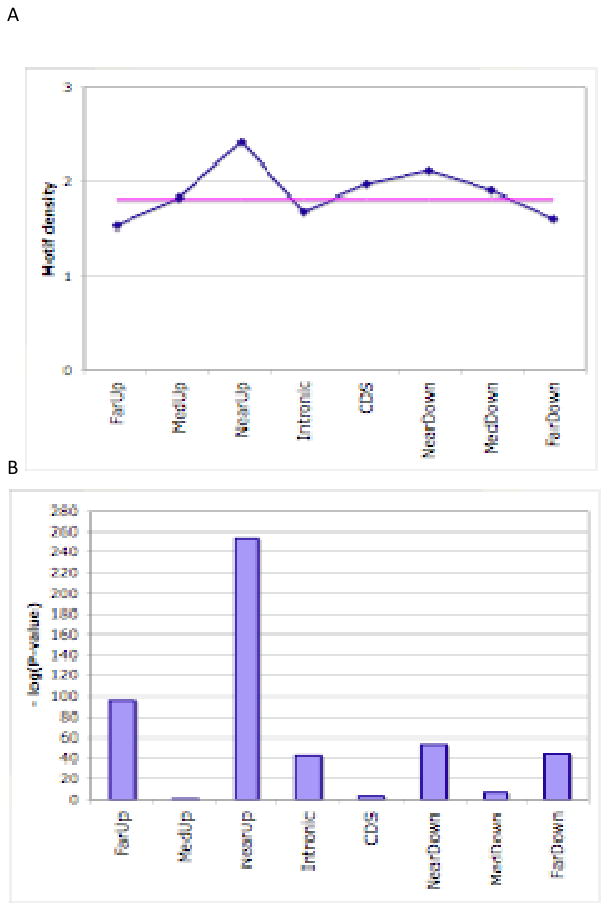
(A) Density of predicted motifs (y axis) for different categories of regions (x axis) in terms of location with respect to their nearest genes, shown in blue. The horizontal pink line is the genome-wide average. See text for definitions of motif density and various region categories. (B) P-values of enrichment or depletion of motif occurrence in each category of regions, using one-tailed Fishers exact tests. Negative logarithms are shown.
Accessory Figure 2. Motif target counts by defined location.

Counts of targets windows of individual motifs in different categories of regions are compared to the respective expected values, with colors shown indicating whether the count is greater or less than expectation. Green cells correspond to counts that are higher than the average and red cells correspond to regions with below-average counts.
Accessory Figure 3.

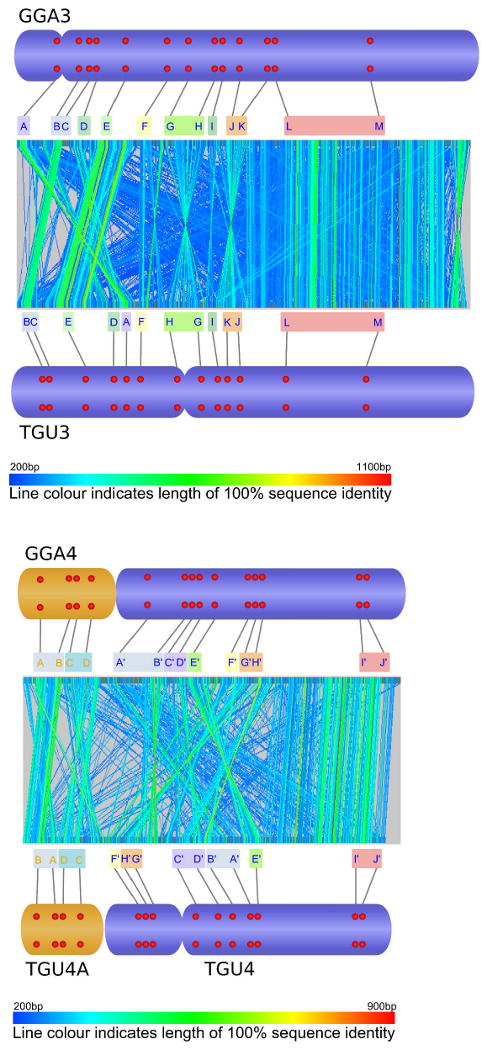
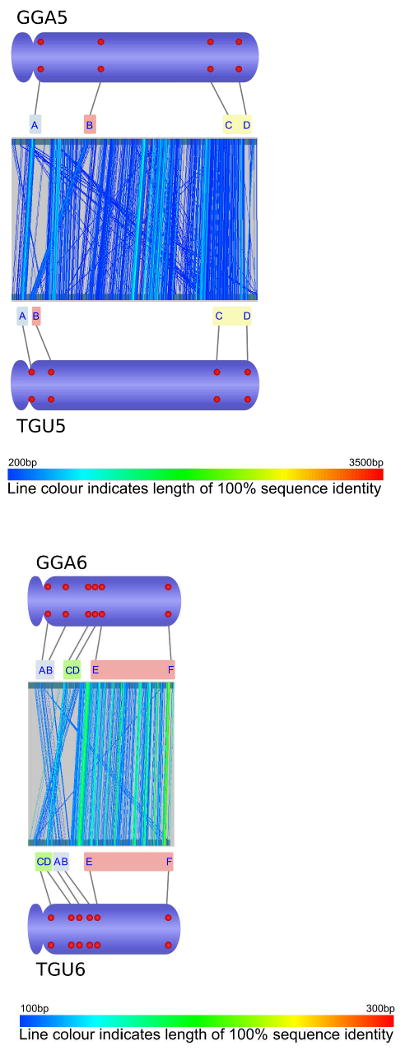
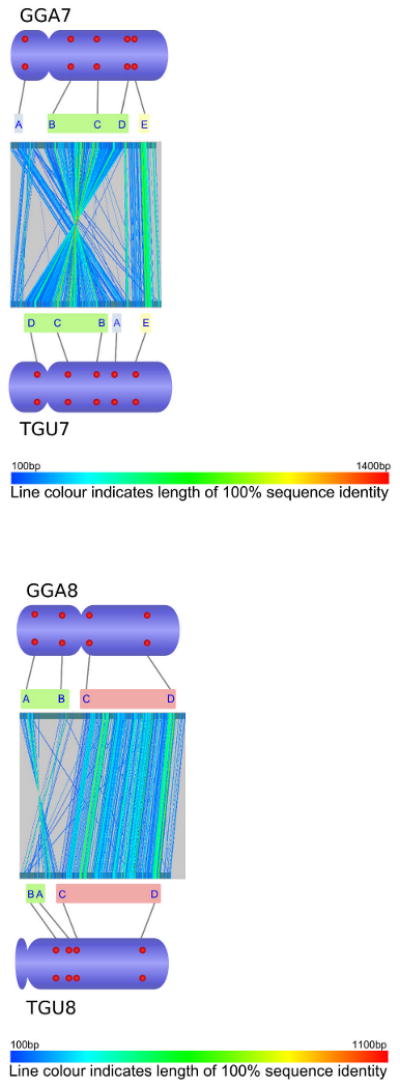
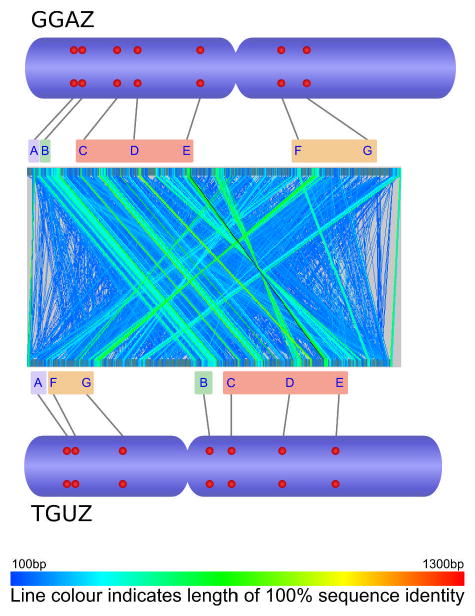
Comparative analysis of marker order on chicken chromosomes 2-8 and Z (GGA2-8, GGAZ) and their zebra finch orthologues (TGU2-8, TGUZ). The central part of each figure was created by aligning whole chromosomal sequences using the program GenAlyzer. Line colour indicates the length of sequences with 100% sequence identity. The tentative chromosomal rearrangements suggested by this analysis were verified using fluorescent in situ hybridization (FISH). Letters indicate the position of chicken and zebra finch BACs with orthologous sequence content in the genome sequences of both species (see accessory file Physical mapping table 2009-09-16.xls for details on the FISH probes used). Red dots on the ideograms illustrate the physical chromosomal position as determined by FISH.
Accessory Figure 4. Bayesian phylogenies of zebra finch MHC genes.
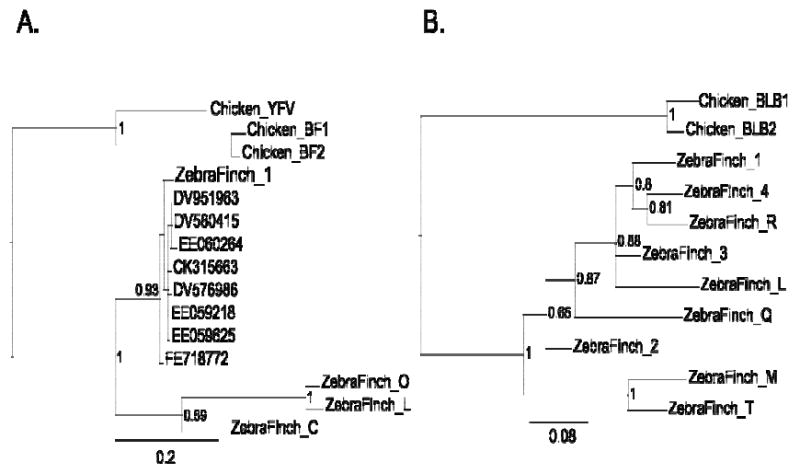
(A) Class I genes and (B) Class IIB genes were compared to sequences from the chicken MHC-B complex. Putatively functional zebra finch genes with open reading frames are given numerical suffixes and putative pseudogenes are given lettered suffixes. For Class I we also include a chicken sequence from the MHC-Y region (YFV). For zebra finch class I, we show the placement of eight brain ESTs (indicated by their GenBank accession numbers) supporting the expression of MHC Class I genes in the brain. Posterior probabilities are given for well-supported nodes in the tree.
Accessory Figure 5.

General view showing WGAC (>5kb) and WSSD on all chromosomes. Grey above lines is WSSD and red below lines is WGAC. ChrUn was treated as a “distinct” chromosome.
Accessory Figure 6.
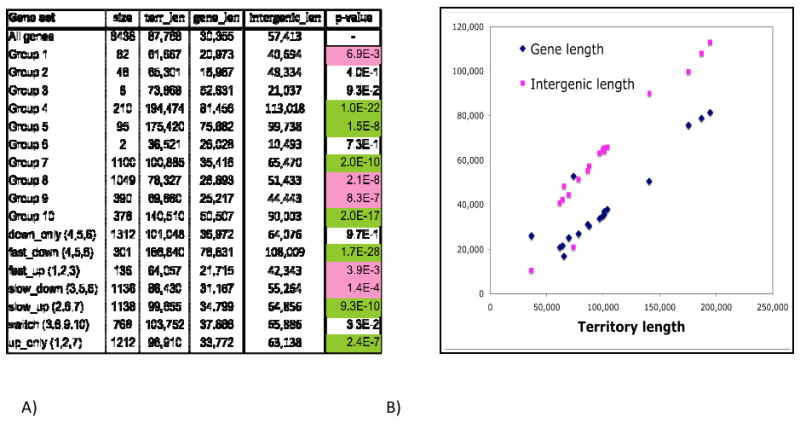
(A) Characteristics of co-expressed gene sets from Dong et al. 58 (See S3 supplementary notes). “Gene set”: name of the gene set, as in the original paper. “All genes” refers to the genes on the array in Dong et al. Numbers in parentheses indicate component subsets of a set. “Size”: number of genes in set. “terr_len”: average gene territory length of a gene set. “gene_len”: average coding sequence length. “intergenic_length”: average of (territory length – gene length). “p-value”: statistical significance of enrichment for short (pink cells) or long (green cells) territories, as measured by 2-tailed Wilcoxon Rank Sum tests. (B) Average gene length and intergenic length of a gene set (y axis) versus average gene territory length. Each point corresponds to a gene set.
Accessory Table 1. Zebra finch chromosome nomenclature and length.
Chicken (GGA) and finch (TGU) chromosome names suggested by Itoh et al., 2005 (Supplementary Notes 1).
| Ordered | Random | |||||
|---|---|---|---|---|---|---|
| TGU | GGA | Itoh et al., 2005 | TGU length | TGU %GC | TGU length | TGU %GC |
| Tgu1 | 1 | 3 | 118548696 | 0.39 | 1193292 | 0.4 |
| Tgu1A | 1 | 4 | 73657157 | 0.39 | 689636 | 0.46 |
| Tgu1B | 1 | NA | 1083483 | 0.5 | 142794 | 0.45 |
| Tgu2 | 2 | 1 | 156412533 | 0.39 | 1793874 | 0.39 |
| Tgu3 | 3 | 2 | 112617285 | 0.39 | 1378982 | 0.46 |
| Tgu4 | 4 | 5 | 69780378 | 0.39 | 5148506 | 0.4 |
| Tgu4A | 4 | micro | 20704505 | 0.43 | 258280 | 0.44 |
| Tgu5 | 5 | 6 | 62374962 | 0.41 | 2517995 | 0.42 |
| Tgu6 | 6 | 7 | 36305782 | 0.41 | 2096744 | 0.43 |
| Tgu7 | 7 | 8 | 39844632 | 0.41 | 603983 | 0.44 |
| Tgu8 | 8 | 9 | 27993427 | 0.41 | 5113623 | 0.46 |
| Tgu9 | 9 | 10 | 27241186 | 0.43 | 369730 | 0.42 |
| Tgu10 | 10 | NA | 20806668 | 0.43 | 559132 | 0.46 |
| Tgu11 | 11 | NA | 21403021 | 0.42 | 295904 | 0.44 |
| Tgu12 | 12 | NA | 21576510 | 0.43 | 345412 | 0.43 |
| Tgu13 | 13 | NA | 16962381 | 0.44 | 2653678 | 0.47 |
| Tgu14 | 14 | NA | 16419078 | 0.45 | 252098 | 0.5 |
| Tgu15 | 15 | NA | 14428146 | 0.46 | 359589 | 0.46 |
| Tgu16 | 16 | NA | 9909 | 0.48 | 187953 | 0.49 |
| Tgu17 | 17 | NA | 11648728 | 0.48 | 210589 | 0.48 |
| Tgu18 | 18 | NA | 11201131 | 0.46 | 474824 | 0.48 |
| Tgu19 | 19 | NA | 11587733 | 0.46 | 200344 | 0.46 |
| Tgu20 | 20 | NA | 15652063 | 0.46 | 300503 | 0.47 |
| Tgu21 | 21 | NA | 5979137 | 0.46 | 1862743 | 0.49 |
| Tgu22 | 22 | NA | 3370227 | 0.48 | 803674 | 0.5 |
| Tgu23 | 23 | NA | 6196912 | 0.49 | 548500 | 0.48 |
| Tgu24 | 24 | NA | 8021379 | 0.48 | 186162 | 0.49 |
| Tgu25 | 25 | NA | 1275379 | 0.52 | 472805 | 0.48 |
| Tgu26 | 26 | NA | 4907541 | 0.5 | 1627540 | 0.49 |
| Tgu27 | 27 | NA | 4618897 | 0.49 | 208747 | 0.49 |
| Tgu28 | 28 | NA | 4963201 | 0.5 | 199714 | 0.51 |
| TguLGE22 | LGE22C19W28_E50C23 | NA | 883365 | 0.51 | 454016 | 0.5 |
| TguLGE22A | LGE22C19W28_E50C23 | NA | ||||
| Tgun2 | NA | NA | 109741 | 0.49 | ||
| Tgun5 | NA | NA | 16416 | 0.42 | ||
| TguZ | Z | Z | 72861351 | 0.39 | 2969867 | 0.41 |
| TguUn | Un | Un | 175225315 | 0.42 | ||
Abbreviations are as follows TGU – zebra finch, GGU – chicken, ordered presents linkage or other ordering information that allowed unambiguous contig or supercontig chromosomal placement, random – represents partial ordering information that only allows chromosome placement but not order on the chromosome. GC% is the percentage of G and C bases per total bases counted.
Accessory Table 2.
Summary of gene orthologs defined from sequence homology, gene trees and conservation of synteny.
| Species Comparison | No Homologs | 1:1 Orthologs | 1:M Orthologs | M:M Orthologs | Total Orthologs | Total Genes |
|---|---|---|---|---|---|---|
| Zebra finch/Chicken | 3,863 | 10,161 | 3,563 | 135 | 13,859 | 17,722 |
| Zebra finch/Human | 4,695 | 10,861 | 2,028 | 140 | 13,029 | 17,724 |
| Chicken/Human | 5,035 | 11,429 | 1,141 | 119 | 12,689 | 17,724 |
Accessory Table 3.
All (motif, region category) pairs with z-scores greater than 3 or less than -3 are shown.
| Factor | Region | Z-Score | Factor | Region | Z-Score | Factor | Region | Z-Score |
|---|---|---|---|---|---|---|---|---|
| FOXL1 | NearUp | 8.33 | Arnt | Intronic | 3.58 | MIZF | FarDown | -3.09 |
| CREB1 | CDS | 7.75 | NFYA | FarDown | 3.58 | Klf4 | Intronic | -3.14 |
| FOXC1 | Intronic | 7.25 | STAT1 | NearDown | 3.58 | Myf | NearUp | -3.27 |
| YY1 | CDS | 6.83 | Evi1 | NearDown | 3.45 | Sox5 | NearDown | -3.35 |
| Gata1 | CDS | 6.76 | GATA3 | FarDown | 3.42 | REL | FarDown | -3.36 |
| NFYA | NearUp | 6.03 | USF1 | Intronic | 3.38 | ETS1 | FarUp | -3.39 |
| ZEB1 | CDS | 5.07 | MIZF | Intronic | 3.36 | PPARG | NearUp | -3.41 |
| NF-kappaB | NearDown | 4.06 | PPARG | FarDown | 3.32 | Arnt | FarDown | -3.45 |
| E2F1 | NearUp | 3.93 | MAX | Intronic | 3.23 | ZEB1 | NearUp | -3.47 |
| RORA_1 | FarUp | 3.92 | Mycn | Intronic | 3.23 | ETS1 | FarDown | -3.49 |
| NFIL3 | Intronic | 3.87 | GABPA | CDS | 3.22 | TFAP2A | Intronic | -3.5 |
| Sox5 | MedDown | 3.82 | SRF | MedDown | 3.17 | Mycn | FarDown | -3.59 |
| Myf | Intronic | 3.8 | Myb | CDS | 3.09 | REST | NearUp | -3.88 |
| Evi1 | FarDown | 3.78 | TFAP2A | NearUp | 3.08 | MZF1_5-13 | Intronic | -3.91 |
| Ar | Intronic | 3.76 | Myf | CDS | 3.01 | SRF | NearUp | -4.02 |
| SOX9 | FarUp | 3.75 | FOXC1 | MedDown | -3.04 | GATA2 | Intronic | -4.09 |
| RELA | NearDown | 3.71 | TBP | CDS | -3.04 | FOXC1 | FarDown | -4.23 |
| RORA_1 | FarDown | 3.71 | REL | FarUp | -3.05 | NFYA | Intronic | -5.18 |
| TBP | NearUp | 3.65 | MIZF | MedDown | -3.09 | Evi1 | Intronic | -5.56 |
Accessory Table 4. Comparison of motif – region preferences.
Comparisons were made to human (see S1 Supplementary notes; Blanchette et al. 2006). Shown are the z-scores for motifs that were common to the two studies. We note that Blanchette et al. studied only one “FOX” motif, one “GATA” motif and one “RORA” motif, whereas our compendium includes multiple versions (marked in gray, column 1). Columns 2 – 6 are z-scores from this study, columns 7 – 9 indicate overrepresentation (“u”, pink) or depletion (“d”, green) of a motif in a particular region category as reported by Blanchette et al. Cells with bold outlines in columns 7 – 9 are cases where our findings agree with those of Blanchette et al (our z-score is > 2 or < -2). Cells with bold outlines in columns 2 – 6 are cases where our findings disagree with those of Blanchette et al. In all other cases, either of the two studies reports a non-significant enrichment or depletion.
| Songbird (this study) | Human (Blanchette et al.) | |||||||
|---|---|---|---|---|---|---|---|---|
| factor | FarUp | MedUp | NearUp | CDS | Intronic | farup | nearup | intron |
| CREB1 | -2.72 | -0.98 | 2.31 | 7.75 | -0.39 | u | ||
| E2F1 | 0.2 | 0.52 | 3.93 | -1.09 | -2.16 | d | u | u |
| ELK1 | -1.02 | 1.01 | 1.82 | -0.6 | -2.49 | u | ||
| Foxa2 | 2.4 | 0.27 | -1.18 | -0.67 | -1.29 | d | u | |
| FOXC1 | -2.36 | -2.15 | 0.17 | 1.15 | 7.25 | d | u | |
| FOXD1 | -1.11 | -0.9 | 1.74 | -0.9 | 1.23 | d | u | |
| Foxd3 | 0.5 | -1.13 | 0.03 | -0.79 | -0.88 | d | u | |
| FOXF2 | 0.43 | 0.21 | 0.07 | -0.55 | 0.19 | d | u | |
| FOXI1 | -0.55 | -0.59 | 2.11 | -0.09 | 0.9 | d | u | |
| FOXL1 | -2.71 | -0.23 | 8.33 | -2.58 | -2.87 | d | u | |
| Foxq1 | -1.44 | 2.23 | -0.8 | -0.9 | -0.2 | d | u | |
| GABPA | 0.4 | 0.9 | 0.67 | 3.22 | 0.29 | u | ||
| Gata1 | -0.67 | -0.7 | -0.86 | 6.76 | 0.4 | u | d | |
| GATA2 | 1.12 | -1.24 | 1.41 | 2.15 | -4.09 | u | d | |
| GATA3 | 1.7 | -0.4 | -0.03 | -1.09 | -3 | u | d | |
| MEF2A | -1.56 | 1.63 | 2.66 | -1.13 | -0.16 | d | u | |
| NFYA | 0.65 | -2.9 | 6.03 | -2.84 | -5.18 | u | d | |
| NR2F1 | -0.41 | 0.11 | 0.19 | -0.29 | 1.23 | u | ||
| Pbx | 2.6 | -0.13 | -1.25 | 0.46 | -0.83 | u | ||
| RORA_1 | 3.92 | -0.85 | -1.68 | 0.09 | -1.66 | u | d | |
| RORA_2 | 0.03 | 2.17 | -0.91 | -0.46 | -0.95 | u | d | |
| Spz1 | -0.3 | 0.62 | -0.71 | -0.87 | -0.6 | d | u | |
| SRY | 0.67 | -1.86 | -0.53 | 0.01 | -1.06 | d | u | |
| TAL1-TCF3 | 0.48 | 1.04 | -2.7 | 0.96 | 1.18 | u | d | |
| TBP | -0.88 | -0.55 | 3.65 | -3.04 | -1.23 | d | u | |
Accessory Table 5. Orthologs predicted with the OPTIC pipeline.
Orphaned genes have no ortholog predicted in any of the other species. These often represent rapidly evolving genes or those in large families whole phylogeny may not have been inferred accurately.
| Species | Genes | Transcripts | Genes with orthologs | Orphaned genes | |
|---|---|---|---|---|---|
| H. sapiens | 20,907 | 46,259 | 18,485 | 88% | 2,422 |
| M. musculus | 22,848 | 40,052 | 19,067 | 83% | 3,781 |
| C. familiaris | 19,292 | 25,546 | 17,436 | 90% | 1,856 |
| M. domestica | 19,458 | 32,544 | 17,025 | 87% | 2,433 |
| O. anatinus | 17,936 | 26,821 | 14,879 | 83% | 3,057 |
| G. gallus | 16,723 | 22,181 | 14,465 | 86% | 2,258 |
| T. guttata | 17,475 | 18,191 | 15,820 | 91% | 1,655 |
| T. nigroviridis | 19,581 | 23,097 | 15,371 | 78% | 4,210 |
Accessory Table 6. Strict 1:1 orthologs across eight species.
Each set contains exactly one gene of each species.
| Species | (1:1)n ortholog sets | Species | (1:1)n ortholog sets | |
|---|---|---|---|---|
| Human | 20,907 | 100% Zebrafinch | 17,475 | 100% |
| +Mouse | 15,272 | 73% +Chicken | 10,868 | 62% |
| +Dog | 14,229 | 68% +Platypus | 8,024 | 46% |
| +Opossum | 12,411 | 59% +Opossum | 7,238 | 41% |
| +Platypus | 9,508 | 45% +Dog | 6,850 | 39% |
| +Chicken | 7,884 | 38% +Mouse | 6,615 | 38% |
| +Zebrafinch | 5,262 | 25% +Human | 6,474 | 37% |
| +Tetraodon | 4,344 | 21% +Tetraodon | 4,344 | 25% |
Accessory Table 7. Location of novel transcript models with respect to ENSEMBL gene models.
Associated transcript models are within 1kb of an ENSEMBL exon, while intergenic sequences are more than 1kb distant from the closest ENSEMBL exon. Note that the numbers do not sum to 100% as some transcript models contain both intronic and intergenic
| Set | total | Intronic | Associated | Intergenic | |||
|---|---|---|---|---|---|---|---|
| array | 8,409 | 915 | 11% | 2,275 | 27% | 5,019 | 60% |
| chicken | 24,249 | 7,844 | 32% | 1,970 | 8% | 14,020 | 58% |
| estima | 13,036 | 1,778 | 14% | 3,230 | 25% | 7,651 | 59% |
| Embryo | 110,634 | 28,349 | 26% | 13,324 | 12% | 68,464 | 62% |
| Liver | 176,210 | 49,068 | 28% | 8,971 | 5% | 117,604 | 67% |
| Muscle | 128,814 | 34,783 | 27% | 6,704 | 5% | 86,892 | 67% |
| Skin | 107,841 | 26,999 | 25% | 11,035 | 10% | 69,348 | 64% |
| Spleen | 108,492 | 28,411 | 26% | 9,922 | 9% | 69,673 | 64% |
| Testes | 63,418 | 12,223 | 19% | 10,486 | 17% | 40,307 | 64% |
Accessory Table 8.
Annotation of transcribed loci (TL). Based on the overlap with ENSEMBL exons TL are annotated first into “known”, “novel”, and “ambiguous” sets. This first level annotation is followed by a second level annotation. Known TL are annotated as protein coding (“pc”), pseudogene (“pseudo”), non-protein coding (“npc”) or UTR (“utr”) depending on the kind or part of an ENSEMBL gene with which they overlap. Novel TL are classified by their location as gene-associated (“assoc”), “intronic” or “intergenic” TL. The category “assoc” contains TL that extend at least partially within 1kb of either terminal exon of an ENSEMBL gene.
| set | total | known | novel | ambiguous | pc | pseudo | npc | utr | intronic | associated | intergenic |
|---|---|---|---|---|---|---|---|---|---|---|---|
| all | 15009 | 3301 | 8409 | 3299 | 3253 | 5 | 3 | 40 | 915 | 2275 | 5019 |
| unchanged | 12248 | 2565 | 7060 | 2623 | 2525 | 4 | 3 | 33 | 741 | 1902 | 4258 |
| FastDown | 435 | 34 | 343 | 58 | 34 | 0 | 0 | 0 | 90 | 46 | 194 |
| FastUp | 125 | 44 | 34 | 47 | 42 | 0 | 0 | 2 | 1 | 16 | 15 |
| SlowDown | 1112 | 371 | 442 | 299 | 367 | 1 | 0 | 3 | 70 | 120 | 239 |
| SlowUp | 1217 | 318 | 630 | 269 | 314 | 0 | 0 | 4 | 36 | 205 | 372 |
Accessory Table 9.
Novel TL are statistically significantly depleted in intronic sequences. The only exception is the set FastDown.
| set | depletion | P-Value |
|---|---|---|
| Fastdown | 8.00% | 0.1300 |
| FastUp | 82.00% | 0.0001 |
| SlowDown | 42.00% | 0.0010 |
| SlowUp | 79.00% | 0.0001 |
| unchanged | 64.00% | 0.0001 |
Footnotes
Supplementary Information is linked to the online version of the paper at www.nature.com/nature.
Author Contributions W.C.W., D.F.C., H.E. and A.P.A. comprise the organizing committee of the zebra finch genome sequencing project. Project planning, management and data analysis: W.C.W., D.F.C., H.E. and A.P.A. Assembly annotation and analysis: L.W.H., P.M., S.-P.Y., L.Y., J.N., A.C., S.H., J.Sl., J.St., D.B. and S.-P.Y. Protein coding and non-coding gene prediction: S.S., C.B., P.F., S.W., A.H., C.P.P. and L.K. SNP analysis: P.F. and W.M.M. Orthology prediction and analysis: A.J.V., A.H., C.P.P., S.F. and L.K. Repeat element analysis: M.A.B., A.F.A.S., R.H., M.K.K., J.A.W., W.G. and D.D.P. Segmental duplication and gene duplication analysis: L.C., Z.C., E.E.E., L.K., C.P.P., M.F., C.N.B., R.E., J.G. and S.E.L. Protease annotation and analysis: X.S.P., V.Q., G.V. and C.L.-O. Neuropeptide hormone annotation: J.Sw. and B.S. Small non-coding RNA analysis: Y-C.L., Y.L., P.G., M.W. and X.L. Comparative mapping: D.K.G., M.V. and B.M.S. Singing induced gene network analysis: E.D.J., A.R.P., O.W. and J.H. Z-chromosome analysis: Y.I. and A.P.A. Gene expression and in situ analysis and synapsin synteny/loss analysis: C.V.M., P.L. and T.A.F.V. Adaptive evolution analysis: A.K., K.N., N.B., L.S., B.N. and C.N.B. Gene expression in the brain analysis: C.S., I.A., A.S., H.L., H.R. and M.S. MHC analysis: S.E., C.N.B. and R.E. Olfactory receptor analysis: T.O., D.L. and L.K. Sequencing management: R.K.W., E.R.M. and L.F. Physical map construction: T.G. Zebra finch tissue resources: T.Bu. and T.Bi. Zebra finch cDNA resources: D.F.C., E.D.J. and X.L.
Author Information The Taeniopygia guttata whole-genome shotgun project has been deposited in DDBJ/EMBL/GenBank under the project accession ABQF00000000.
Reprints and permissions information is available at www.nature.com/reprints.
This paper is distributed under the terms of the Creative Commons Attribution-Non-Commercial-Share Alike licence, and is freely available to all readers at www.nature.com/nature.
The authors declare no competing financial interests.
References
- 1.Zann RA. The Zebra Finch: A Synthesis of Field and Laboratory Studies. Oxford Univ, Press; 1996. [Google Scholar]
- 2.Clayton DF, Balakrishnan CN, London SE. Integrating genomes, brain and behavior in the study of songbirds. Curr Biol. 2009;19:R865–R873. doi: 10.1016/j.cub.2009.07.006. [DOI] [PMC free article] [PubMed] [Google Scholar]
- 3.Nottebohm F. In: Hope For a New Neurology. Nottebohm F, editor. New York Academy of Science; 1985. [Google Scholar]
- 4.Doupe AJ, Kuhl PK. Birdsong and human speech: common themes and mechanisms. Annu Rev Neurosci. 1999;22:567–631. doi: 10.1146/annurev.neuro.22.1.567. [DOI] [PubMed] [Google Scholar]
- 5.Jarvis ED. Learned birdsong and the neurobiology of human language. Ann NY Acad Sci. 2004;1016:749–777. doi: 10.1196/annals.1298.038. [DOI] [PMC free article] [PubMed] [Google Scholar]
- 6.Hillier LW, et al. Sequence and comparative analysis of the chicken genome provide unique perspectives on vertebrate evolution. Nature. 2004;432:695–716. doi: 10.1038/nature03154. [DOI] [PubMed] [Google Scholar]
- 7.Hackett SJ, et al. A phylogenomic study of birds reveals their evolutionary history. Science. 2008;320:1763–1768. doi: 10.1126/science.1157704. [DOI] [PubMed] [Google Scholar]
- 8.Zeigler HP, Marler P. Behavioral Neurobiology of Bird Song. Vol. 1016. New York Academy of Sciences; 2004. [DOI] [PubMed] [Google Scholar]
- 9.Hahnloser RH, Kozhevnikov AA, Fee MS. An ultra-sparse code underlies the generation of neural sequences in a songbird. Nature. 2002;419:65–70. doi: 10.1038/nature00974. [DOI] [PubMed] [Google Scholar]
- 10.Mooney R. Neural mechanisms for learned birdsong. Learn Mem. 2009;16:655–669. doi: 10.1101/lm.1065209. [DOI] [PubMed] [Google Scholar]
- 11.Konishi M, Akutagawa E. Neuronal growth, atrophy and death in a sexually dimorphic song nucleus in the zebra finch brain. Nature. 1985;315:145–147. doi: 10.1038/315145a0. [DOI] [PubMed] [Google Scholar]
- 12.Goldman SA, Nottebohm F. Neuronal production, migration, and differentiation in a vocal control nucleus of the adult female canary brain. Proc Natl Acad Sci USA. 1983;80:2390–2394. doi: 10.1073/pnas.80.8.2390. [DOI] [PMC free article] [PubMed] [Google Scholar]
- 13.Nottebohm F. The road we travelled: discovery, choreography, and significance of brain replaceable neurons. Ann NY Acad Sci. 2004;1016:628–658. doi: 10.1196/annals.1298.027. [DOI] [PubMed] [Google Scholar]
- 14.London SE, Remage-Healey L, Schlinger BA. Neurosteroid production in the songbird brain: A re-evaluation of core principles. Front Neuroendocrinol. 2009;30:302–314. doi: 10.1016/j.yfrne.2009.05.001. [DOI] [PMC free article] [PubMed] [Google Scholar]
- 15.Mello CV, Vicario DS, Clayton DF. Song presentation induces gene expression in the songbird forebrain. Proc Natl Acad Sci USA. 1992;89:6818–6822. doi: 10.1073/pnas.89.15.6818. [DOI] [PMC free article] [PubMed] [Google Scholar]
- 16.Dong S, Clayton DF. Habituation in songbirds. Neurobiol Learn Mem. 2009;92:183–188. doi: 10.1016/j.nlm.2008.09.009. [DOI] [PMC free article] [PubMed] [Google Scholar]
- 17.Woolley SC, Doupe AJ. Social context-induced song variation affects female behavior and gene expression. PLoS Biol. 2008;6:e62. doi: 10.1371/journal.pbio.0060062. [DOI] [PMC free article] [PubMed] [Google Scholar]
- 18.Jarvis ED, Scharff C, Grossman MR, Ramos JA, Nottebohm F. For whom the bird sings: context-dependent gene expression. Neuron. 1998;21:775–788. doi: 10.1016/s0896-6273(00)80594-2. [DOI] [PubMed] [Google Scholar]
- 19.Clayton DF. The genomic action potential. Neurobiol Learn Mem. 2000;74:185–216. doi: 10.1006/nlme.2000.3967. [DOI] [PubMed] [Google Scholar]
- 20.Warren WC, et al. Genome analysis of the platypus reveals unique signatures of evolution. Nature. 2008;453:175–183. doi: 10.1038/nature06936. [DOI] [PMC free article] [PubMed] [Google Scholar]
- 21.Stapley J, Birkhead TR, Burke T, Slate J. A linkage map of the zebra finch Taeniopygia guttata provides new insights into avian genome evolution. Genetics. 2008;179:651–667. doi: 10.1534/genetics.107.086264. [DOI] [PMC free article] [PubMed] [Google Scholar]
- 22.Itoh Y, et al. Dosage compensation is less effective in birds than in mammals. J Biol. 2007;6:2. doi: 10.1186/jbiol53. [DOI] [PMC free article] [PubMed] [Google Scholar]
- 23.Ellegren H, et al. Faced with inequality: chicken do not have a general dosage compensation of sex-linked genes. BMC Biol. 2007;5:40. doi: 10.1186/1741-7007-5-40. [DOI] [PMC free article] [PubMed] [Google Scholar]
- 24.Teranishi M, et al. Transcripts of the MHM region on the chicken Z chromosome accumulate as non-coding RNA in the nucleus of female cells adjacent to the DMRT1 locus. Chromosome Res. 2001;9:147–165. doi: 10.1023/a:1009235120741. [DOI] [PubMed] [Google Scholar]
- 25.Arnold AP, Itoh Y, Melamed E. A bird's-eye view of sex chromosome dosage compensation. Annu Rev Genomics Hum Genet. 2008;9:109–127. doi: 10.1146/annurev.genom.9.081307.164220. [DOI] [PubMed] [Google Scholar]
- 26.Lovell PV, Clayton DF, Replogle KL, Mello CV. Birdsong “transcriptomics”: neurochemical specializations of the oscine song system. PLoS One. 2008;3:e3440. doi: 10.1371/journal.pone.0003440. [DOI] [PMC free article] [PubMed] [Google Scholar]
- 27.Dong S, et al. Discrete molecular states in the brain accompany changing responses to a vocal signal. Proc Natl Acad Sci USA. 2009;106:11364–11369. doi: 10.1073/pnas.0812998106. [DOI] [PMC free article] [PubMed] [Google Scholar]
- 28.Makeyev EV, Maniatis T. Multilevel regulation of gene expression by microRNAs. Science. 2008;319:1789–1790. doi: 10.1126/science.1152326. [DOI] [PMC free article] [PubMed] [Google Scholar]
- 29.Wada K, et al. A molecular neuroethological approach for identifying and characterizing a cascade of behaviorally regulated genes. Proc Natl Acad Sci USA. 2006;103:15212–15217. doi: 10.1073/pnas.0607098103. [DOI] [PMC free article] [PubMed] [Google Scholar]
- 30.Wada K, Sakaguchi H, Jarvis ED, Hagiwara M. Differential expression of glutamate receptors in avian neural pathways for learned vocalization. J Comp Neurol. 2004;476:44–64. doi: 10.1002/cne.20201. [DOI] [PMC free article] [PubMed] [Google Scholar]
- 31.Cooper EC, Jan LY. Ion channel genes and human neurological disease: recent progress, prospects, and challenges. Proc Natl Acad Sci USA. 1999;96:4759–4766. doi: 10.1073/pnas.96.9.4759. [DOI] [PMC free article] [PubMed] [Google Scholar]
- 32.Mattick JS. RNA regulation: a new genetics? Nature Rev Genet. 2004;5:316–323. doi: 10.1038/nrg1321. [DOI] [PubMed] [Google Scholar]
- 33.Agate RJ, Scott BB, Haripal B, Lois C, Nottebohm F. Transgenic songbirds offer an opportunity to develop a genetic model for vocal learning. Proc Natl Acad Sci USA. 2009;106:17963–17967. doi: 10.1073/pnas.0909139106. [DOI] [PMC free article] [PubMed] [Google Scholar]
- 34.Replogle K, et al. The Songbird Neurogenomics (SoNG) Initiative: community-based tools and strategies for study of brain gene function and evolution. BMC Genomics. 2008;9:131. doi: 10.1186/1471-2164-9-131. [DOI] [PMC free article] [PubMed] [Google Scholar]
- 35.Ovcharenko I, Loots GG, Hardison RC, Miller W, Stubbs L. zPicture: dynamic alignment and visualization tool for analyzing conservation profiles. Genome Res. 2004;14:472–477. doi: 10.1101/gr.2129504. [DOI] [PMC free article] [PubMed] [Google Scholar]
Associated Data
This section collects any data citations, data availability statements, or supplementary materials included in this article.