

Abstract
Motivation
Traditional phylogenetic methods assume tree-like evolutionary models and are likely to perform poorly when provided with sequence data from fast-evolving, recombining viruses. Furthermore, these methods assume that all the sequence data are from contemporaneous taxa, which is not valid for serially-sampled data. A more general approach is proposed here, referred to as the Sliding MinPD method, that reconstructs evolutionary networks for serially-sampled sequences in the presence of recombination.
Results
Sliding MinPD combines distance-based phylogenetic methods with automated recombination detection based on the best-known sliding window approaches to reconstruct serial evolutionary networks. Its performance was evaluated through comprehensive simulation studies and was also applied to a set of serially-sampled HIV sequences from a single patient. The resulting network organizations reveal unique patterns of viral evolution and may help explain the emergence of disease-associated mutants and drug-resistant strains with implications for patient prognosis and treatment strategies.
1 INTRODUCTION
RNA viruses such as HIV exploit numerous genetic and evolutionary mechanisms to ensure their survival; some of these include high mutation rates, high yields (increased replication) and short replication cycles resulting in a diverse array of mutants (Flint et al., 2000). This implies that because RNA viruses evolve fast, when their sequences are sampled at time intervals of a year or less, they already exhibit several substitution patterns in contrast to what one would observe in slow-evolving genomes of higher organisms. It is this aspect of their evolution that demands for an approach different from traditional phylogenetic methods, which were conceived for the study of contemporaneous data.
Furthermore, these standard phylogenetic methods do not consider the effects of genetic recombination in shaping the evolutionary relationships. Recombination is a critical mechanism in the evolution of HIV-1 and is thought to help the virus escape from immune pressures and adapt to the effects of antiviral therapies.
In this article, we present a new method called Sliding MinPD, which takes existing recombination methods and automates them with respect to selection of donor candidates, breakpoint and donor identification without the need for any user interaction. Sliding MinPD constructs an ‘evolutionary network’ based on the ‘evolutionary framework’ by Holmes et al. (1992) and uses it to represents recombination events and ancestor–descendant relationships. Recombination events can also be represented in a phylogenetic network structure such as the networks inferred by the Splitstree program (Huson and Bryant, 2006).
An ever-growing number of recombination detection tools have been published in recent years. A comprehensive, up-to-date list of over 40 programs can be found at http://bioinf.man.ac.uk/recombination/programs.shtml. Sliding MinPD makes use of recombination detection, but its automated detection feature and its network output puts it in a different category altogether. The lack of automation resulted in earlier comparison studies that consisted of simple pass or fail tests (Posada and Crandall, 2001; Wiuf et al., 2001). An automated solution was added to the RDP2 program in recent years (Martin et al., 2005a). Other automated solutions have been proposed based on hidden Markov models and probabilistic approaches with automatic removal of similar sequences (Milne et al., 2004) and on a genetic algorithm approach whose results are based on small data sets of up to 10 sequences (Kosakovsky et al., 2006). One group of the traditional recombination detection tools, which includes the online tool RIP (Siepel and Korber, 1995), uses pairwise sequence comparisons; another large group uses phylogenetic trees, and includes methods such as the popular bootscanning method implemented in Simplot and RDP2 (Lole et al., 1999; Salminen et al., 1995). The bootscanning and RIP methods represent the earliest and most popular approaches on which many of the newer methods have been built upon. A modification of the bootscanning method was published recently (Martin et al., 2005a), as was a method called RAT (Recombination Analysis Tool), which is comparable to the RIP method, but uses genetic distances (Etherington et al., 2005). A third method that combines both methods was implemented in RDP2 (Martin et al., 2005b). The goal of these methods is to identify the putative recombinant ancestor sequences of a query sequence from a set of aligned sequences.
Several methods that estimate the phylogenetic relationships or evolutionary parameters of date-labeled serially-sampled data have been published since 2000 (Buendia and Narasimhan, 2004; Drummond and Rambaut, 2003; Drummond and Rodrigo, 2000; Ogishima et al., 2001; Rambaut, 2000; Ren et al., 2001; Yang et al., 2007). The performance of many of the methods (including a preliminary version of MinPD) was compared in two earlier studies. Of the programs used in the comparison studies, only MinPD took recombination into account although the feature was turned off in that study. The comparison studies suggest that although many of the methods specially designed for the study of serially-sampled data are based on the molecular clock, they do not perform well with serially-sampled data unless the data has evolved in a clock-like manner.
Sliding MinPD represents a clear improvement over the original MinPD with several significant modifications, including:
the use of multiple alignments instead of pairwise alignments,
the use of a sliding window approach,
the automation of three different recombination detection approaches (based on distance or topology comparisons),
a new approach to detect one or more crossover points, and
the option of calculating statistical significance for all predictions (in terms of bootstrap values, for both recombinant and non-recombinant relationships).
This article will focus on the new features of Sliding MinPD not present in the original MinPD, mainly the automation of three standard recombination detection methods, a feature only offered by one other program, RDP2, (Martin et al., 2005a) that unlike Sliding MinPD, analyzes contemporaneous data and shows its predictions in a plot-based graphical output.
2 METHODS
Sliding MinPD combines a minimum pairwise distance approach, a sliding window method, and automated recombination detection to study the ancestor–descendant relationships of serially-sampled nucleotide sequences. Our method presents the results in an evolutionary network structure. Sliding MinPD implements the recombination detection approach of identifying parental sequences for a given query sequence and places these sequences as direct ancestors in the network. The network has been described earlier (Buendia and Narasimhan, 2004) and is used to represent recombination events and breakpoint positions, genetic distances and linking relationships, while also respecting the time order of the sampled data.
2.1 Recombination detection in Sliding MinPD
The standard recombination detection methods rely on a visual approach in which it is left to the user to decide (by looking at the graphical output) if a sequence is a recombinant and to determine the ancestral donor sequences and the location of the breakpoint positions. A notable new feature in Sliding MinPD is the identification of recombinants, ancestors and breakpoints as an automated sliding window process with no need for user input. Three existing methods were automated and implemented as user options in Sliding MinPD. The basic approach is the same for all three methods: a sliding window is moved along the aligned input sequences, and at every position the query sequence is compared to each of the background representatives with the goal of finding the ‘closest’ (or most similar) sequence using an appropriate scoring measure. A plot of the measure of closeness between pairs of query and reference sequences can be obtained as a function of the position in the alignment. Recombination breakpoints can be found at the intersection of the plots. The difference between the three methods lies in the scoring mechanism used; the three options are described subsequently.
RIP option: in Recombination Identification Program (RIP), similarity between two sequences is quantified as the percentage of identical base pairs (Siepel and Korber, 1995). Sliding MinPD does not use a similarity score, but instead uses a corrected distance measure (three choices are provided: JC69, K2P or TN93).
SB option: this involves a standard Bootscanning method (SB). Bootstrapped phylogenetic trees are built for each window segment and finally the bootstrap value for placing the query sequence with each of the reference sequences/sequence groups is tabulated and plotted along the sequence. It requires a minimum of 4 sequences (Lole et al., 1999; Salminen et al., 1995).
B-RIP option: This alternative approach to the standard Bootscanning (B-RIP) was implemented in RDP2 (Martin et al., 2005b). Here only the bootstrapped corrected distances are calculated and plotted in the graph.
All three methods have been previously implemented elsewhere. The two bootscanning methods were implemented in RDP2 (Martin et al., 2005b). The recently developed RAT implements the RIP method using genetic distances (Etherington et al., 2005). The significant modification introduced in Sliding MinPD is the automation of these methods, using a different approach than in RDP2. The performance of this automated determination process is tested extensively on simulated data (see Section 3.2).
2.2 The Sliding MinPD algorithm
Sliding MinPD underwent considerable changes from its original MinPD version. The algorithm has three phases. In the first one, every sequence that is not from the first sampling time point is deemed a query sequence and the pairwise distances (corrected distances or topological distances) are calculated for every pair of sequences for the entire length of the sequences (step 1 of algorithm). The process is straightforward for the RIP option. For the B-RIP and SB options, however, the process involves creating bootstrap replicates of the entire sequence alignment and calculating a distance matrix for each replicate. When the SB option is selected, NJ trees have to be constructed for each replicate and the positions of the sequences have to be stored in a topology distance matrix. In the second phase, the ancestors and breakpoints for the recombinant sequences are automatically determined. It is in this phase that a query sequence is identified as a recombinant or not. The same procedure from phase 1 is carried out, but this time it is applied to every window along the alignment (step 2). Potential ancestors from previous sampling times (older than query sequence) are identified in step 3. For non-recombinants, the sequence at minimum genetic distance is chosen as the ancestor sequence by accessing the distance information calculated in step 1. In the final phase of the algorithm the evolutionary network is constructed (step 4 of algorithm).
An evolutionary network has tree edges and network edges. Tree edges link a single ancestor sequence to a descendant query sequence (indicating that it is the closest ancestor for the whole length of the sequence). Network edges are edges that join two or more ancestor sequences with one descendant query sequence and represent a recombination event.
Main Algorithm
For each pair of sequences si and sj in input S calculate distances Dist(si, sj) and bootstrap values Boot(SB,si,s) for the whole alignment.
For each pair of sequences si and sj and for every window wx along the alignment do step [1] for window wx and compute Distw (si, sj, wx) and bootstrap values Boot(SB, si, s, wx).
-
For each query sequence si do
if (si is judged a recombinant) then identify its ancestors and breakpoints with associated bootstrap value.
else choose as ancestor of si the single closest ancestor sequence with associated bootstrap value.
For each set of sequences with the same chosen ancestor, construct an NJ tree with the chosen ancestor as the outgroup.
In step 3a above, the automated recombination detection is performed on all query sequences s that are not from the first sampling time point.
Automated Recombination Detection for query sequence s
For each of the w windows of s, select the sequence si that is closest to it in that window. Sequence si is said to dominate in the ith window. Put all selected sequences in a list called Candidates.
For each pair of sequences si and sj in Candidates, apply the PCC rule to reduce pool of Candidates.
-
If SB or B-RIP option, then do
for all s from Candidates do step [2] from the main Sliding MinPD algorithm after replacing the reference set S by the set Candidates.
Apply bootstrap spikes rule to reduce pool of Candidates.
If any sequences were discarded, then redo step [3a] with the updated Candidates.
For each breakpoint bkp, do calculate average bootstrap value (if SB or B-RIP) or average distance value (if RIP) for the corresponding combination of left and right ancestor sequences and compare to a user-specified threshold to identify s as recombinant.
In the recombination detection, step 1 identifies sequences that are at minimum distance in each of the w windows and constructs distance vectors containing the distance of every window of si to the corresponding window of s. Ties are broken by picking the sequence with minimum distance in the windows where either sequence dominates or by applying the PCC rule in step 2. In step 2, if two sequences have highly similar distance vectors (from s), then it is probably because they are very similar. In this case, if the Pearson Correlation Coefficient (PCC) between the distance vectors of two sequences si and sj is above a distance threshold, then discard the sequence si or sj whichever has the larger average distance in the windows where either sequence dominates.
Step 3 describes the automated selection of candidates for the SB and B-RIP options. In step 3a, the step 1 from the main algorithm is carried out for each window. Step 3b is needed to discard false positives with short bootstrap spikes (short segment of consecutive windows in which a given sequence has the highest bootstrap value). An increase in the number of false positives was observed when such sequences were left in the candidate pool (see Supplementary Material—graphs of simulation studies).
For the SB or BRIP options in step 4, the combinations of left and right ancestor sequences with a high average bootstrap value that exceed the bootstrap threshold are identified as recombinant donors and the query sequence is identified as a recombinant. For the RIP option in step 4, it is the minimum distance for combinations of left and right ancestor sequences that has to be less than the RIP threshold.
As an alternative procedure to the standard bootstrap, a procedure that we called the ‘bootknife’, a hybrid between the bootstrap and the jackknife, was also implemented. The same procedure was implemented in RDP2 (Martin et al., 2005b). With the bootknife, a percentage p of the sites (25–50%) is picked at random and removed and is replaced by other randomly picked sites.
2.3 Detecting multiple breakpoints
The algorithm presented above finds recombination events with only one breakpoint. (Note that we use the terms ‘breakpoint’ and ‘crossover point’ interchangeably.) We propose a method based on the weighted interval scheduling algorithm (Kleinberg and Tardos, 2005) to find recombination events with one or more crossovers. We define a chain of windows to be a set of consecutive windows that would be obtained if one were to slide a window over a portion of the sequence. If a chain of windows corresponds to an interval, and if its average bootstrap value over the interval corresponds to its weight, then it is easy to see that the problem of finding an optimal set of (multiple) breakpoints corresponds to the problem of finding an optimal set of weighted intervals. Each chain has a start point, the first window position, and an end point, the first window position plus the nucleotides covered by the length of the chain. The weight per chain is either the average modified distance (RIP) or the average bootstrap value (SB or B-RIP) of the chain. With more crossovers, more spikes are possible, and therefore a penalty is assessed to short spikes. The penalty decreases when longer chains are chosen and is subtracted from the average bootstrap value to keep the number of false positives at a minimum. The modified distance for the RIP option is modDist = Largest-Dist, where Largest is the largest distance value of all windows. This allows for a standardized algorithm in which the maximum distance is preferred. Section 4 of the Sliding MinPD recombination detection will perform the following steps:
For each of the w-1 breakpoints bkp, with w the number of windows, and all sequences in Candidates do
Prepare chains that end at bkp. There are m = n*bkp chains ci that end at bkp, with n the number of sequences in Candidates and 1 ≤ i ≤ m.
Calculate maximum average modified distance or bootstrap value for bkp as M[bkp] = max(weight(ci) + M[start(ci)]) for all 1 ≤ i ≤ m.
The position start (ci), where a chain ci starts, is a position where another chain ends, and is therefore an earlier breakpoint position. The range of the inspected breakpoints goes from 1 to w – 1. M[start(ci)] contains the best result up to breakpoint start(ci). The penalty function p is designed to decrease the weight in the following manner:
We therefore propose to use the following exponential penalty function:
where x is the length of the chain of consecutive windows ci and a = log2 w. The penalty is a function of the length of the chain and tends to zero for larger chains as its purpose is to diminish the effect of spikes.
2.4 Evaluation methods
The performance of Sliding MinPD was tested with simulated sequence data generated by the program Serial NetEvolve 1.0 (Buendia and Narasimhan, 2006). Serial NetEvolve is a simulation tool that takes a specified set of parameters and generates a coalescent tree (Kingman, 1982) or recombinant network structure (Hudson, 1983) and evolves serially-sampled nucleotide sequences along the structure. As in real viral samples, the simulated data need not contain all direct ancestors. Seven data sets of 100 replicates were generated, each data set with different rates of recombination. Sliding MinPD was run repeatedly on the data sets with different combinations of parameters in order to evaluate the best choice of program parameters. Cutoff values for the analysis of the empirical data were chosen so as to maximize Sliding MinPD’s success using a cross-validation approach in which the program was tested on different test data sets (different models of evolution, mutation rates and recombination rates) using fixed parameters.
The evaluation process for Sliding MinPD is based on the recombination detection principle of identifying parental sequences for a given query sequence (Buendia and Narasimhan, 2007). In accordance with the concepts used in the recombination detection methods employed by Sliding MinPD, the ancestor–descendant evaluation score, referred to as the A-D Score, uses two different measures: one based on path length, the other based on topological distance (network position). For a query sequence q in the true network, the closest parental sequence s was determined using two distance measures as follows (Buendia and Narasimhan, 2007):
Topology measure: number of nodes traversed from q;
Edge distance measure: total path length traversed from q.
If two sequences are at the same distance from q, then the alternative criteria is used as a tie-breaker. The A-D score was calculated as the percentage of correctly inferred ancestor–descendant tuples (q, s1, …, sw), where s1, …, sw are the closest ancestors of query sequence q for different portions of the sequence. If q is non-recombinant then there is only one ancestor s1 for the whole length of the sequence, and if Sliding MinPD identifies q as a non-recombinant with only one ancestor a1, then it is counted as a true negative (TN). If s1 matches a1, the match is counted towards the TN A-D score. If q is a recombinant sequence and is identified as such by Sliding MinPD, then it is counted as a true positive (TP). False positives (FP) and false negatives (FN) are determined correspondingly and express the association between the presence or absence of recombination. The A-D score goes further and calculates the percentage of ancestors identified by Sliding MinPD that match the true ancestors. The A-D Score for the other values are calculated in the same way as that of the TN A-D score described above. Specificity (SP), sensitivity (SE) and positive predictive values (PPV) were calculated for different combination of parameters. Specificity SP = TN/(TN+FP) is the proportion of true negatives, while sensitivity SE = TP/(TP+FN) is the proportion of true positives. The positive predictive value PPV = TP/(TP+FP) is the proportion of sequences correctly identified as recombinant.
3 RESULTS
Serial NetEvolve 1.0 was used to generate data sets with seven different recombination rates (see graphs). The sequence length was set to 1000, the model of evolution to HKY, with the rate heterogeneity alpha parameter set to 0.5, mutation rate to 0.00001, internal node sampling rate to 0.5 (only half of the direct ancestors were sampled) and exponential rate to 0.0005. Breakpoints were added uniformly between the positions 150 and 850, the breakpoint margins. A sample size of 8 sequences per sampling time was chosen with six sampling time points, which resulted in a sequence alignment containing 48 sequences with 40 query sequences.
The goal of the simulation study was to find the settings for which Sliding MinPD could obtain the highest specificity, albeit at the expense of lower sensitivity values.
3.1 Analysis of simulation study
Table 1 shows the results for the default parameters of the three recombination detection options. The SB option was evaluated with the A-D topology criterion, and the RIP and B-RIP options with the A-D path length criterion. The Sliding MinPD default values for SB and B-RIP were: 100 bootstrap replicates, a window size of 200, a step size of 20 and a seed of −3. The PCC threshold values were set to 0.4 for B-RIP and RIP, and 0.2 for SB. The bootstrap thresholds were 88 for SB and 90 for B-RIP. RIP used a window size of 100 and a step size of 30. All three options used the TN93 distance and an alpha parameter of 0.5. Six different recombination rates were used, namely 1 × 10⁻⁸ (10%), 2 × 10⁻⁸ (18%), 3 × 10⁻⁸ (27%), 4 × 10⁻⁸ (30%), 5 × 10⁻⁸ (39%) and 6 × 10⁻⁸ (44%); the parenthesized percentage values correspond to the rough percentage of sequences that were recombinant. The first three recombination rates were classified as being ‘Low’, while the last three were classified as ‘High’. The results for these recombination rates are shown in Table 1. The values of TN, TP, FN and FP and the corresponding A-D scores were obtained as described previously at the end of Section 2.4. The BKP Score gives the percentage of breakpoints that were correctly identified (a margin of error of 60 nt was allowed for the breakpoint position predictions). An overall decline in all scores could be observed for the data sets simulated with larger recombination rates, with sensitivity values suffering a larger decline than specificity values. The SB option was less accurate at identifying ancestral donors as indicated by lower A-D scores. This suggests that methods based on phylogeny comparisons do not perform as well, a result also obtained by Posada and Crandall (2001).
Table 1.
Benchmark results of the simulation studies
| Recombination rate | Option | TN | TP | FN | FP | SP | SE | PPV | TN A-D score | TP A-D score | FN A-D score | FP A-D score | BKP (60) score |
|---|---|---|---|---|---|---|---|---|---|---|---|---|---|
| LOW | BRIP | 9635 | 1359 | 923 | 83 | 0.991 | 0.596 | 0.942 | 0.895 | 0.653 | 0.862 | 0.855 | 0.480 |
| SB | 9725 | 1301 | 861 | 113 | 0.989 | 0.602 | 0.920 | 0.795 | 0.596 | 0.698 | 0.726 | 0.467 | |
| RIP | 9637 | 1358 | 924 | 81 | 0.992 | 0.595 | 0.944 | 0.896 | 0.658 | 0.858 | 0.926 | 0.514 | |
| HIGH | BRIP | 7284 | 2467 | 2161 | 88 | 0.988 | 0.533 | 0.966 | 0.916 | 0.588 | 0.879 | 0.795 | 0.380 |
| SB | 7396 | 2421 | 2063 | 120 | 0.984 | 0.540 | 0.953 | 0.814 | 0.537 | 0.712 | 0.758 | 0.371 | |
| RIP | 7303 | 2532 | 2096 | 69 | 0.991 | 0.547 | 0.973 | 0.914 | 0.599 | 0.882 | 0.855 | 0.414 |
The graphs in Figure 1 show various measures of performance for different choices of the parameters (see also Supplementary Material). Based on the results, the best combination of parameters was compiled for the analysis of the empirical data. The three different program options as well as the two different evaluation criteria were tested for different recombination rates (see Supplementary Material). Based on the results the SB option was always used in conjunction with the A-D topology criterion, and the RIP and B-RIP options in conjunction with the A-D path length criterion.
Fig. 1.
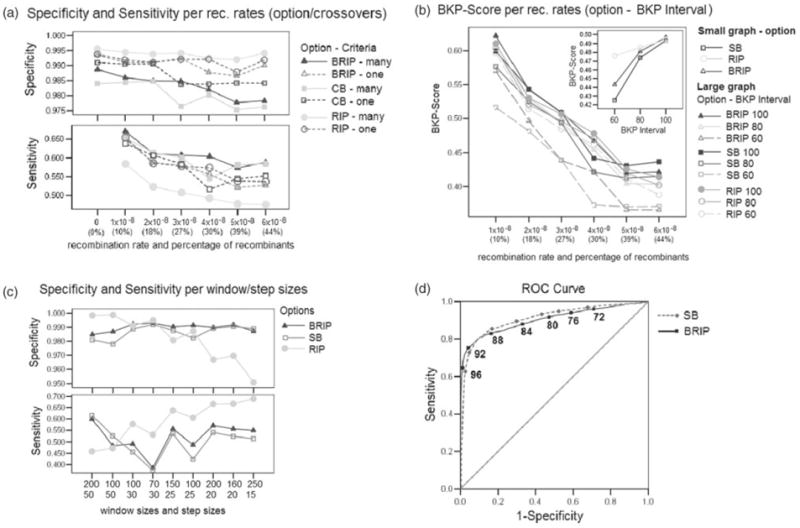
Graphs representing the relationship between different recombination rates for the three recombination detection options in Sliding MinPD and combinations of other MinPD parameters.
3.1.1 Crossovers
We tested the ability of our algorithm to correctly detect more than one crossover (recombination event) with different recombination rates (Fig. 1a). The detection of the multiple crossovers algorithm showed considerably improved performance with the B-RIP and SB options, with the sensitivity increasing by as much as 5% points for a small decrease in specificity; it did, however, have an adverse effect with the RIP option. The sensitivity values with the RIP option decreased considerably, while the specificity values increased marginally. It is possible that the weight penalty adversely affected the computation with the RIP option, in which no bootstraps are performed.
3.1.2 BKP score
The BKP score is clearly affected by the choice of the recombination rate, with the SB option showing poor performance at higher rates (Fig. 1b). However, when the evaluation interval around the breakpoint position (i.e. the margin of error) was increased (from 60 sites to 80 sites, and then to 100 sites), the performance with the SB option improved markedly and was better than that of the other methods for 100 sites. The small graph shows a comparison for different breakpoint intervals averaged over all recombination rates.
3.1.3 Window and step sizes
Different combinations of window and step sizes were chosen for comparing the three program options (Fig. 1c). The X-axis shows combinations of window sizes (top) and step sizes (bottom) ordered by increasing number of windows. The program showed improved performance with the B-RIP and SB options at the default window size of 200 and step size of 20. The performance with the RIP option, however, was drastically affected by the choice of these parameters, with lower specificity and higher sensitivity for the smaller step sizes, and higher specificity and lower sensitivity for larger step sizes. The default values chosen with the RIP option in all other studies were a window size of 100 and a step size of 30. The performance with the RIP option can be explained by the observation that it does not generate bootstrap replicates and that therefore the distance values between windows fluctuated more for larger step sizes when the sequences were sufficiently divergent (default mutation rate: 0.00001) and the distances were not averaged over all bootstrap replicates. The study also showed that smaller window sizes negatively affected the sensitivity but improved the specificity values with all scoring options, but specially that with the SB and B-RIP options.
3.1.4 Bootstrap threshold
We evaluated the performance of step 4 of the recombination detection through a ROC curve (AUC) analysis, and assessed the sensitivity and specificity for the different bootstrap values (Fig. 1d). To avoid excessive data imbalance, we analyzed only low recombination data. The overall prediction performance is at 0.903 for B-RIP and 0.908 for SB (Std Error: 0.006, asymptotic significance P = 0.000). Additional studies for the bootstrap threshold as used in steps 3b and 4 with all recombination rates (see Supplementary Material) led to the choice of bootstrap thresholds of 88 and 90 for SB and B-RIP options, respectively.
3.2 Analysis of within-host HIV-1 evolution study
Sliding MinPD was applied (using the default options) to serially-sampled HIV-1 data of patient 8 from the 1999 Shankarappa study (Shankarappa et al., 1999). Figure 2 shows the evolutionary network for patient 8. A maximum-likelihood (ML) tree of the same data is shown in the Supplementary Material. The Shankarappa et al. (1999) study showed a strong correlation between the emergence of the syncytium-inducing (SI) X4 mutant phenotype and the rapid decline of CD4+ T-cells and a more rapid disease progression. The evolutionary network (Fig. 2) makes it convenient to understand how widespread the X4 genotype is in each sampling period. A comparison of the ML tree and the network yields some remarkable observations: 3 sequences with the X4 mutation can be found separated from the large group (subtree) of X4 mutants in the ML tree (Supplementary Material). As previously shown (Schierup and Hein, 2000), trees from data sets with recombination have long terminal branches and a more star-shaped genealogy. All 3 sequences were predicted as recombinants by Sliding MinPD (Fig. 2). Sequences are referred to by their sampling time followed by a dash and a unique identifier. In the case of sequence 95-07 (sequence 07(96) at 95 months) the ancestral donors are from two different lineages and in the case of 81-14 one of the ancestral donors was predicated to be from a much earlier sampling time. In fact, the network of patient 8 suggests that the closest ancestors of several sequences (41-a, 46-b, 70-12, 95-08, etc.) have been sampled more than 3 years earlier, which in turn may be evidence of the resurgence of reservoir virus after a period of latency. The presence of different types of HIV reservoirs cells that harbor dormant virus has been discussed in many studies (Chun and Fauci, 1999; Imamichi et al., 2001). A complete discussion of another patient’s network as well as a description of the guidelines used in the network construction can be found at the Supplementary Material.
Fig. 2.
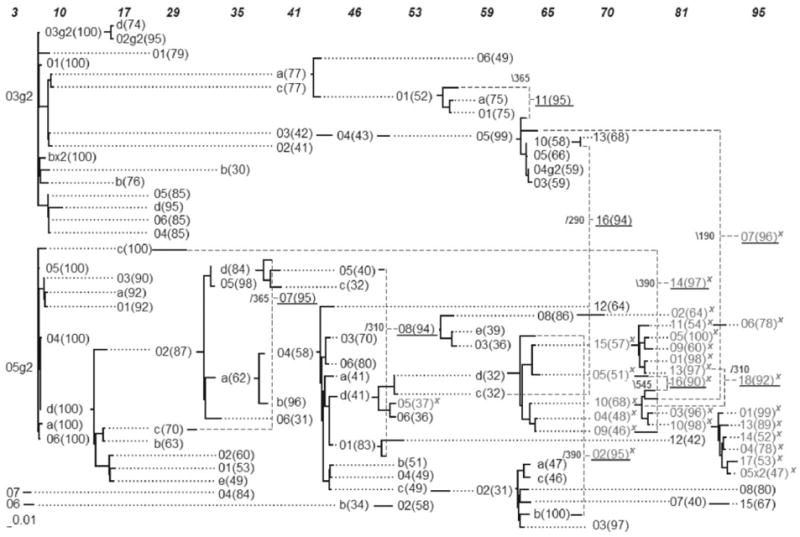
Proposed visualization of the consensus serial evolutionary network showing the relationships of serially-sampled HIV-1 sequences from patient 8 of Shankarappa’s study. The sequence IDs are unique within a sampling time point (shown on top), but not across the whole network. Bootstrap values are shown in parenthesis. Sequences with the X4 mutation are marked with an ‘x’. Solid lines indicate distances, while dotted lines serve to extend the linking relationships. Dashed lines are used to link recombinant sequences with their predicted donor sequences and breakpoint positions are shown in small font next to the underlined recombinant sequences.
4 CONCLUSIONS
In this article, we have described a new method that implements an automated recombination detection approach to study the phylogenetic relationships between serially-sampled data. The method constructs an evolutionary network reflecting these relationships. The results of extensive computer simulations are provided, resulting in an evaluation of recombination detection methods that is more comprehensive than in previous studies.
Previous comparison studies consisted of measuring the number of data sets for which the presence or absence of recombination were correctly identified, because the existing detection methods leave it to the user to decide whether or not a given sequence is recombinant (Posada and Crandall, 2001). With the automated recombination detection in Sliding MinPD we were able to carry out an evaluation study that is therefore unique, in that it measures specificity and sensitivity values and accurate detection of breakpoint positions. Sliding MinPD automates the detection process and outputs a list of the inferred recombinant sequences along with statistical significance values associated with the inference. Sliding MinPD uses this output to construct a network that describes the evolutionary relationship of the data.
Applying our method to simulated data returned an average sensitivity score of 0.60 for low recombination rates (up to 27% of recombinants) and few false positives with all rates (specificity rates of 0.98). About 50% of breakpoint positions were correctly detected for the low recombination rates, this rate increased by an average of 6% when the interval to the left and right of the true breakpoint position was increased from 60 to 100 in the evaluation process. We presented two versions of our algorithm—one that detects only one crossover and another that detects multiple crossovers. The multiple crossover alternative increased the accuracy of detection for two of the options (SB and B-RIP).
Sliding MinPD is a method that can be applied to recombining, fast-evolving viruses such as HIV-1. While traditional phylogenetic methods assume a tree-like model of evolution, MinPD seeks to recover the evolutionary relationships within a network structure that represents recombination events. The network facilitates the study of viral evolutionary relationships, evolutionary patterns, splitting and merging of lineages, and helps to determine how these correlate with the disease status of the patient. The analysis of the network may provide insight into within-host viral evolution and helps find patterns that may explain the emergence of harmful mutants associated with disease progression, such as shown here with the X4 mutants.
Sliding MinPD is a versatile tool, which offers different options of recombination detection. An analysis study of serially-sampled data with the multiple options implemented in Sliding MinPD provides a complete approach in which the main aspects of serially-sampled viral data are considered, such as the temporal nature of the data, the ancestor–descendant relationships and the detection of recombinants.
Supplementary Material
Acknowledgments
The work of P.B. was supported by MBRS-RISE Fellowship (NIH/NIGMS R25 GM61347). The work of G.N. was supported in part by NIH Grants P01 DA15027-01 and NIH/NIGMS S06 GM008205.
Footnotes
Conflict of Interest: none declared.
Supplementary information: http://biorg.cis.fiu.edu/SlidingMinPD
References
- Buendia P, Narasimhan G. MinPD: distance-based phylogenetic analysis and recombination detection of serially-sampled HIV quasispecies. Proceedings of the IEEE Computational Systems Bioinformatics Conference; Stanford, CA. 2004. [PMC free article] [PubMed] [Google Scholar]
- Buendia P, Narasimhan G. Serial NetEvolve: a flexible utility for generating serially-sampled sequences along a tree or recombinant network. Bioinformatics. 2006;22:2313–2314. doi: 10.1093/bioinformatics/btl387. [DOI] [PubMed] [Google Scholar]
- Buendia P, Narasimhan G. Searching for recombinant donors in a phylogenetic network of serial samples. To appear in International Symposium on Bioinformatics Research and Applications (ISBRA); Atlanta, Georgia. 2007. [Google Scholar]
- Chun T, Fauci A. Latent reservoirs of HIV: obstacles to the eradication of virus. Proc Natl Acad Sci USA. 1999;96:10958–10961. doi: 10.1073/pnas.96.20.10958. [DOI] [PMC free article] [PubMed] [Google Scholar]
- Drummond A, Rambaut A. BEAST v1.0. 2003 http://evolve.zoo.ox.ac.uk/beast/
- Drummond A, Rodrigo AG. Reconstructing genealogies of serial samples under the assumption of a molecular clock using serial-sample UPGMA (sUPGMA) Mol Biol Evol. 2000;17:1807–1815. doi: 10.1093/oxfordjournals.molbev.a026281. [DOI] [PubMed] [Google Scholar]
- Etherington G, et al. Recombination analysis tool (RAT): a program for the high-throughput detection of recombination. Bioinformatics. 2005;21:278–281. doi: 10.1093/bioinformatics/bth500. [DOI] [PubMed] [Google Scholar]
- Flint SJ, et al. Principles of Virology. ASM Press; Washington: 2000. Virus evolution and the emergence of new viruses; pp. 717–748. [Google Scholar]
- Holmes EC, et al. Convergent and divergent sequence evolution in the surface envelope glycoprotein of human immunodeficiency virus type 1 within a single infected patient. Proc Natl Acad Sci USA. 1992:4835–4839. doi: 10.1073/pnas.89.11.4835. [DOI] [PMC free article] [PubMed] [Google Scholar]
- Hudson RR. Properties of a neutral allele model with intragenic recombination. Theor Popul Biol. 1983;23:183–201. doi: 10.1016/0040-5809(83)90013-8. [DOI] [PubMed] [Google Scholar]
- Huson DH, Bryant D. Application of phylogenetic networks in evolutionary studies. Mol Biol Evol. 2006;23:254–267. doi: 10.1093/molbev/msj030. [DOI] [PubMed] [Google Scholar]
- Imamichi H, et al. Human immunodeficiency virus type 1 quasi species that rebound after discontinuation of highly active antiretroviral therapy are similar to the viral quasi species present before initiation of therapy. J Infect Dis. 2001;183:36–50. doi: 10.1086/317641. [DOI] [PubMed] [Google Scholar]
- Kingman JFC. The coalescent. Stochastic Process Appl. 1982;13:235–248. [Google Scholar]
- Kleinberg J, Tardos E. Algorithm Design. Addison Wesley; 2005. 6.1 Weighted interval scheduling: a recursive procedure; p. 864. [Google Scholar]
- Kosakovsky P, et al. Automated phylogenetic detection of recombination using a genetic algorithm. Mol Biol Evol. 2006;23:1891–1901. doi: 10.1093/molbev/msl051. [DOI] [PubMed] [Google Scholar]
- Lole KS, et al. Full-length human immunodeficiency virus type 1 genomes from subtype C-infected seroconverters in India, with evidence of inter-subtype recombination. J Virol. 1999;73:152–160. doi: 10.1128/jvi.73.1.152-160.1999. [DOI] [PMC free article] [PubMed] [Google Scholar]
- Martin DP, et al. A modified bootscan algorithm for automated identification of recombinant sequences and recombination breakpoints. AIDS Res Hum Retroviruses. 2005a;21:98–102. doi: 10.1089/aid.2005.21.98. [DOI] [PubMed] [Google Scholar]
- Martin DP, et al. RDP2: recombination detection and analysis from sequence alignments. Bioinformatics. 2005b;21:260–262. doi: 10.1093/bioinformatics/bth490. [DOI] [PubMed] [Google Scholar]
- Milne I, et al. TOPALi: software for automatic identification of recombinant sequences within DNA multiple alignments. Bioinformatics. 2004;20:1806–1807. doi: 10.1093/bioinformatics/bth155. [DOI] [PubMed] [Google Scholar]
- Ogishima S, et al. Reconstruction and analysis of within-host longitudinal HIV-1 evolution by a distance-based sequential-linking algorithm. Chem-Bio Informatics J. 2001;1:73–83. [Google Scholar]
- Posada D, Crandall KA. Evaluation of methods for detecting recombination from DNA sequences: computer simulations. Proc Natl Acad Sci USA. 2001;98:13757–13762. doi: 10.1073/pnas.241370698. [DOI] [PMC free article] [PubMed] [Google Scholar]
- Rambaut A. Estimating the rate of molecular evolution: incorporating non-contemporaneous sequences into maximum likelihood phylogenies. Bioinformatics. 2000;16:395–399. doi: 10.1093/bioinformatics/16.4.395. [DOI] [PubMed] [Google Scholar]
- Ren F, et al. A new algorithm for analysis of within-host HIV-1 evolution. Pac Symp Biocomput. 2001:595–605. doi: 10.1142/9789814447362_0057. [DOI] [PubMed] [Google Scholar]
- Salminen M, et al. Identification of recombination breakpoints in HIV-1 by bootscanning. AIDS Res Hum Retroviruses. 1995;11:1423–1425. doi: 10.1089/aid.1995.11.1423. [DOI] [PubMed] [Google Scholar]
- Schierup M, Hein J. Consequences of recombination on traditional phylogenetic analysis. Genetics. 2000;156:879–891. doi: 10.1093/genetics/156.2.879. [DOI] [PMC free article] [PubMed] [Google Scholar]
- Shankarappa R, et al. Consistent viral evolutionary changes associated with the progression of HIV-1 infection. J Virol. 1999;73:10489–10502. doi: 10.1128/jvi.73.12.10489-10502.1999. [DOI] [PMC free article] [PubMed] [Google Scholar]
- Siepel A, Korber B. Scanning the Database for Recombinant HIV-1 Genomes. Los Alamos National Laboratory; Los Alamos: 1995. pp. 35–60. [Google Scholar]
- Wiuf C, et al. A simulation study of the reliability of recombination detection methods. Mol Biol Evol. 2001;18:1929–1939. doi: 10.1093/oxfordjournals.molbev.a003733. [DOI] [PubMed] [Google Scholar]
- Yang Z, et al. Tree and rate estimation by local evaluation of heterochronous nucleotide data. Bioinformatics. 2007;23:169–176. doi: 10.1093/bioinformatics/btl577. [DOI] [PMC free article] [PubMed] [Google Scholar]
Associated Data
This section collects any data citations, data availability statements, or supplementary materials included in this article.