

Abstract
Our recent finding that insulin increased the expression of glutamate cysteine ligase catalytic subunit (GCLc) and coincident increases in GCL activity and cellular glutathione (GSH) in human brain microvascular endothelial cells (IHECs) suggests a role for insulin in vascular GSH maintenance. Here, using IHECs stably transfected with promoter-luciferase reporter vectors, we found that insulin increased GCLc promoter activity, which required a prerequisite increase or decrease in media glucose. An intact antioxidant response element-4 (ARE4) was essential for promoter activation that was attenuated by inhibitors of PI3kinase/Akt/mTOR signaling. Interestingly, only at low glucose conditions did promoter activation correlated with increased GCLc expression and GSH synthesis. Low tert-butyl hydroperoxide (tBH) concentrations similarly mediated promoter activation, but the maximal activation dose was decreased 10-fold by insulin. Insulin-tBH co-administration abrogated the low or high glucose requirement for promoter activation, suggesting possible ROS involvement. ROS production was elevated at low glucose without or with insulin; however GSH increases were not inhibited by tempol, suggesting that ROS did not or achieve the threshold for driving GCLc promoter activation and de novo GSH synthesis. The minor effect of pyruvate also ruled out a major role for hypoglycemia (± insulin)-induced metabolic stress on GSH induction under these conditions.
Introduction
Regulation of cellular glutathione (GSH) levels can occur through redox cycling between glutathione disulfide (GSSG) and reduced GSH, enzymatic and nonenzymatic conjugation to various electrophilic and xenobiotic compounds, protein thiolation, and transmembrane flux [1]. However, de novo synthesis is by far quantitatively, the most important pathway of controlling cellular GSH concentration. GSH biosynthesis is carried out by two ATP-dependent enzymatic processes beginning with the formation of γ-glutamylcysteine; this rate limiting is catalyzed by γ-glutamylcysteine ligase (GCL) with subsequent addition of glycine catalyzed by glutathione synthetase [2].
GCL is a heterodimeric holoenzyme composed of a catalytic (GCLc) and modulatory (GCLm) subunit. While GCLc alone possesses all of the catalytic activity of the enzyme and can function monomerically in vivo, dimerization with GCLm lowers the Km for glutamate and ATP and increases the Ki for GSH feedback inhibition [3]. Thus holoenzyme formation is one way of increasing GCL activity and GSH synthesis while post-translational phosphorylation [4] and feedback inhibition by GSH [5] serve to decrease enzyme activity. The primary means by which GCL activity and GSH synthesis are increased is through transcriptional upregulation of one or both subunits. In 1997, Mulcahy et al. cloned and characterized roughly 4.2 kb of the human GCLc promoter and found that both constitutive and electrophile induced promoter activity were dependent upon an intact antioxidant response element 4 (ARE4) [6].
A number of cardiovascular diseases (CVDs) are characterized by decreased endothelial dependent vascular reactivity associated with endothelial oxidative stress stemming from increased enzymatic generation of reactive oxygen species (ROS) [7]. Coincident with this increase in ROS production is a decrease in endothelial antioxidant capacity reflected in decreased aortic GSH content in animal models of hypertension [8], atherosclerosis [9], and diabetes [10]. An associated attenuation in vascular insulin signaling [11] suggests that insulin could play an important role in maintaining normal endothelial GSH redox homeostasis. Previous work from our laboratory has shown that insulin mediated transcriptional upregulation of GCLc and increased GSH synthetic capacity in a brain microvascular endothelial cell line (IHEC) cultured under conditions of chronic high glucose (7 days) [12] or acute low glucose (8h) [13]. We therefore hypothesized that insulin signaling increases GCLc promoter activity in IHEC under conditions of altered glycemic status. Using IHEC stably transfected with promoter-luciferase reporter vectors, we show here the requirement of ARE4 within the GCLc promoter for its induction by insulin as well as tert-butyl hydroperoxide (tBH). Furthermore, our results are consistent with a role for the PI3 kinase/Akt/mTOR pathway in the insulin effect under hypo- and hyperglycemic status. Interestingly, despite insulin induced GCLc promoter activation at low and high glucose, corresponding increases in endothelial GCLc expression and de novo GSH synthesis occurred only under low glucose conditions. Moreover, although ROS production was elevated by hypoglycemia, the requirement of low glucose for the insulin-induced promoter activation and cellular GSH synthesis appeared to be ROS-independent.
Methods
Reagents
Medium 199, hygromycin B, tert-butyl hydroperoxide (tBH), porcine insulin, insulin-transferrin-sodium selenite solution, rapamycin B, leupeptin, aprotonin, PMSF, L-buthionine-(S,R)-sulfoximine (BSO), pyruvate, and tempol were purchased from Sigma-Aldrich (St. Louis, MO). LY294002, okadaic acid and Akt Inhibitor (SH-5) were purchased from Calbiochem (San Diego, CA). Dihydrorhodamine 123 (DHR) was from Molecular Probes (Eugene, OR). Fetal bovine serum (FBS) was obtained from Atlanta Biologicals (Atlanta, GA). Glucose-free M199 powdered media was from US Biologicals (Swampscott, MA). Anti-GCLc rabbit polyclonal antibody was obtained from Neo-Markers (Fremont, CA), and anti-actin mouse monoclonal antibody from BD Biosciences (San Jose, CA). The pGL3Basic vector (pGL3B) and luciferase assay kit were purchased from Promega (Madison, WI). pGL3B vectors containing the human γ-glutamylcysteine ligase catalytic subunit (GCLc) promoter and various truncations of this promoter were kindly provided by Dr. Jeffrey Johnson, University of Wisconsin, Madison.
Creation and Culture of Stable Cell Lines
An immortalized human brain endothelial cell line (IHEC) was kindly provided by Dr. Danica Stanimirovic (Cellular Neurobiology Group, Institute for Biological Sciences, NRC, Canada) and propagated by Dr. Steven J. Alexander at LSUHSC-Shreveport, LA. IHECs were cultured in M199 media with 10% FBS, 1% insulin-transferrin-sodium selenite solution, and 1× antibiotic/antimycotic (complete M199 media) at 37°C in 5% CO2. IHECs were used for the generation of stable cell lines expressing different luciferase vectors containing various portions of the human GCLc promoter. The vectors were constructed by Mulcahy et al [6]. In brief, 4.2 kB of the human GCLc promoter (from −3802 to +465, where +1 is the transcription start site) were cloned into the pGL3B luciferase reporter construct. A series of vectors containing truncations of this promoter sequence were generated via progressive deletion from its 5′ end [6]. Additionally, a vector was created which contained the full length, 4.2 kB GCLc promoter with a single T → G mutation in the antioxidant response element 4 (ARE4) located approximately 3.1 kB upstream of the transcription start site [6] (Figure 1). In this study, the following vectors were used in the generation of stable IHEC lines: fully functional GCLc promoter, the truncated promoter sequences −2752 to +465, −814 to +465, and −511 to +465, and the ARE4 point mutant. The resultant IHEC clones expressing these vectors are herein referred to as WT GCLc cells, −2752 GCLc cells, −814 GCLc cells, −511 GCLc cells, and ARE4 mut GCLc cells, respectively. Generation of the lines was as follows: 1.0 × 10⁶ IHEC were resuspended in 100 μL Amaxa nucleofector solution with 2.0 μg of luciferase vector and 0.2 μg of a hygromycin resistance vector (pTK-Hyg). After nucleofection, the cells were seeded into three 100 mL dishes and cultured in complete M-199 media containing 100 μg/mL hygromycin B and cultured at 37° C and 5% CO2. After 4-6 weeks, isolated colonies were removed from the dishes and expanded under identical conditions with the exception that hygromycin B was decreased to 50μg/mL. Clones were verified by measuring luciferase activity on a Promega GloMax 20/20 luminometer. Experiments were performed in M-199 base media supplemented with 1× antibiotic-antimycotic and 50 μg/mL hygromycin B only. M-199 base media was used in all experiments for serum starvation and incubations unless otherwise stated.
Figure 1. Luciferase Reporter Constructs Used to Generate Stable Cell Lines.
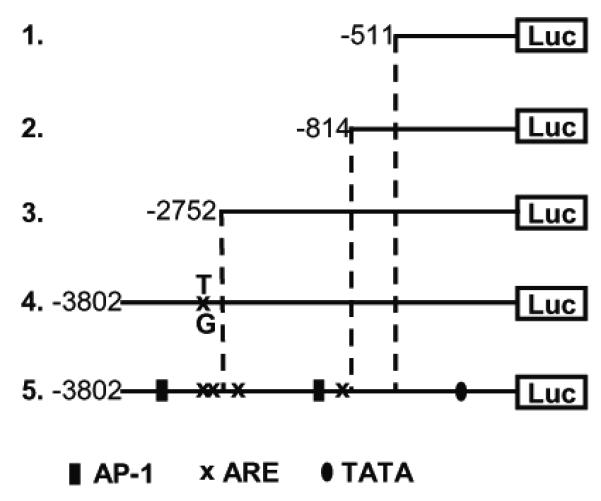
A 4.4 kB of the human GCLc promoter were used to generate a series of luciferase reporter constructs. The diagram of the vector containing the full length, fully functional promoter (number 5) shows the locations of several AP-1 sites and AREs 1-4 (numbered in descending order from 5′ to 3′). Vector number 4 represents the full length promoter with a single nucleotide mutation in ARE4, and vectors 1-3 represent 3 truncated versions of the full length promoter.
Assessment of Luciferase Activity
For all experiments, IHEC lines were grown to confluency in either 6 well or 35 mm tissue culture plates. At the indicated times post treatment, cells were washed 3 times with PBS and lysed in 1× lysis buffer. Cell lysates were centrifuged at 12,000 rpm for 2 min to remove particulate matter, and a-20 μL aliquot of each sample was taken for protein quantitation (Bio-Rad RcDc Protein Assay). Luciferase activity was measured using 20 μL of each sample. All samples were measured in duplicate and luciferase activity was normalized to protein content (RLU/mg protein). Luciferase activity at a given time point was expressed as a ratio of the activity in serum starved cells prior to treatment (time = 0). The various treatment conditions and cell incubations were as follows.
a. tBH treatment
Confluent IHEC monolayers were serum starved for 12h in M199 base media and then treated with 0.5 – 50 μM tBH in fresh base media.
b. Insulin treatment at different glucose conditions
For experiments at normal glucose, confluent IHECs were serum starved overnight and then treated with or without 100 nM insulin in fresh M199 base media containing 5.5 mM glucose for 8h. For experiments in elevated glucose, cells were serum starved overnight in M199 media supplemented with 25 mM glucose and thereafter incubated for 8h with or without 100 nM insulin in fresh M199 media with 25mM glucose. Low glucose conditions were achieved as follows. Confluent IHECs were serum starved for 8h, at which time fresh M199 base media was added, and cells were incubated for an additional 12h to allow for glucose depletion. At 12h, media glucose was approximately 3.5 mM (66 mg/dL) [13]. Cells in reduced glucose media were then treated with or without 100 nM insulin for 8h. For inhibitor studies, IHECs were exposed to 10 μM LY 294002, 10 μM SH-5, or 10 nM rapamycin for 30 min prior to and over the duration of insulin treatment.
c. Insulin and tBH co-treatment
Confluent monolayers were serum starved overnight and then treated with tBH (0.5-50 μM) with or without 100 nM insulin in fresh M199 base media for 8h.
Cell incubations for determination of GSH and ROS, and western analysis of GCLc
For these studies, the IHEC line containing the fully functional GCLc promoter (WT GCLc) was used. Cells (0.5×10⁶/ml) were seeded in 6-well culture plate in full M199 media. At confluency (3 days), the culture media was replaced with fresh insulin- and glucose-free M199 media containing 10% heat-inactivated FBS. In these studies, we found that the addition of heat-inactivated FBS substantially improved cell stability during the duration of the incubations and provided consistency in cell responses from one experiment to another. In initial studies we have validated that heat-inactivated FBS per se (without insulin or glucose manipulations) did not alter GSH content or GCLc expression.
To examine the effect of glucose status on ROS production, GCLc expression and GSH levels, glucose was added to final concentrations of 0, 0.5, 1, 3, 5, 10, or 25mM, and cells were exposed to the different glucose concentrations for 8h. To examine the influence of insulin at the various glycemic states, cells were first incubated at the different glucose conditions (as above) for 6h followed by further 8h incubation in the presence of 100nM insulin. To detect ROS production, cells grown on 96 well plates were pretreated with 5μM DHR 123, a cell-permeant oxidant-sensitive nonfluorescent probe, DHR 123 [14] followed by incubation with the same DHR concentration throughout the experiment. ROS production was detected as rhodamine fluorescence using excitation/emission wavelengths of 485/520 nm.
In some experiments the effect of BSO or tempol on cell GSH levels was examined at 0.5 and 5 mM glucose in the absence or presence of insulin using the above incubation protocols at these two glycemic status and insulin treatment. The inhibitors were added at the same time as the addition of 0.5 mM glucose (induction of hypoglycemia) or the addition of insulin (specific insulin effect). BSO or tempol whenever present, were at final concentrations of 100μM or 1mM, respectively. The effect of pyruvate on GSH levels was examined at 0 mM glucose in the presence of either 1mM or 5mM pyruvate without or with insulin addition. At the specified times, cells were harvested for western blot analyses or GSH determination.
Quantification of GSH and GSSG
Cellular contents of GSH and GSSG were determined by high-performance liquid chromatography (HPLC) [15]. Briefly cells were lysed in 5% TCA and scraped into 1.5 mL microcentrifuge tubes. The acid supernatants were derivatized with 6mM iodoacetic acid and 1% 2, 4-dinitrophenyl fluorobenzene to yield the S-carboxymethyl and 2, 4-dinitrophenyl derivative of GSH. Separation of GSH and GSSG derivatives was performed on a 250mm × 4.6 mm Alltech Lichrosorb NH2 10micron anion exchange column. GSH and GSSG contents were quantified by comparison to standards derivatized in the same manner. Protein pellets were dissolved in 0.1M NaOH for protein quantitation.
Western Analysis of GCLc
Cells were lysed in RIPA with aprotinin, PMSF, okadaic acid, and leupeptin. Total protein (40 μg) per sample were loaded onto 10% acrylamide gels and separated at 100 V followed by transfer to PVDF for 2h at 200mA at 4°C. Membranes were blocked in 5% milk TBS-T at room temperature for 1h and then incubated with rabbit anti-GCLc (1:1000) in 5% milk TBS-T overnight at 4°C. After washing, membranes were incubated in HRP conjugated goat-anti-rabbit secondary (1:1000) for 2h at room temperature followed by washing and 5 min incubation with ECL reagents. The membranes were stripped and equal protein loading was determined by expression of β-actin using a mouse monoclonal antibody (1:75,000).
Statistical Analysis
Data from all experiments were analyzed by one way ANOVA using Bonferroni’s post test for comparison of sample groups. p<0.05 was considered statistically significant. All data shown herein for luciferase assay illustrate the cumulative results of triplicate samples in each experiment and 3 separate experiments were performed. An average of the 9 measurements ± SD is shown. The data shown for GSH determinations (mean ± SD) was the average of duplicate samples in each experiment for 3-4 separate cell preparations. The data for ROS measurements (mean ± SE) was the average of triplicate samples in each experiment for 7 separate cell preparations.
Results
Five stable cell lines expressing luciferase as a reporter for GCLc promoter activity were generated using the reporter constructs illustrated in Figure 1. Luciferase expression in these IHEC lines were driven by the full length human GCLc promoter (WT GCLc), truncated versions of the promoter (−2751 GCLc, −814 GCLc, and −511 GCLc), and the full length GCLc promoter with a single nucleotide mutation in ARE4 (ARE4 mut GCLc). Use of these vectors allowed us to examine the role of different regulatory elements within the promoter sequence, including AREs 3 and 4 (between −3802 and −2752), AREs 1 and 2 (from −2752 to −814), and a putative E-box repressor element. An E-box repressor element was previously reported in rat GCLc promoter from −745 to −705 which binds USF 1 and 2 [16], and was suggested that this region of the human GCLc promoter may contain a similar repressor element [6]. To verify proper reporter gene response (positive control), tBH was used to induce luciferase activity in these IHEC cell lines. The role of tBH in GCLc induction in endothelial cells has not been determined although tBH was shown to mediate transcriptional GCLc upregulation in mouse embryonic cells [17].
tBH increases GCLc promoter activity in IHEC in an ARE4 dependent manner
The effect of tBH on induction of GCLc promoter activity was examined with 0.5, 5, or 50 μM tBH, concentrations that correspond to ROS levels generated during normal cell signaling and metabolism (0.5 and 5.0 μM) and that generated during oxidative stress (50μM). There was no significant cell death under these conditions. The results in Figure 2A show that treatment of WT GCLc cells with 0.5 and 5μM tBH significantly elevated luciferase activity by 4h that was sustained at 8h. However, 50 μM tBH significantly increased luciferase activity only at 8h, a magnitude that was equivalent to 0.5 μM tBH at the same time point. These results indicate that activation of GCLc promoter activity was more responsive to low (0.5 and 5.0 μM) than high (50 μM) tBH concentrations.
Figure 2. tBH increases GCLc promoter activity in IHEC in an ARE4 dependent manner.
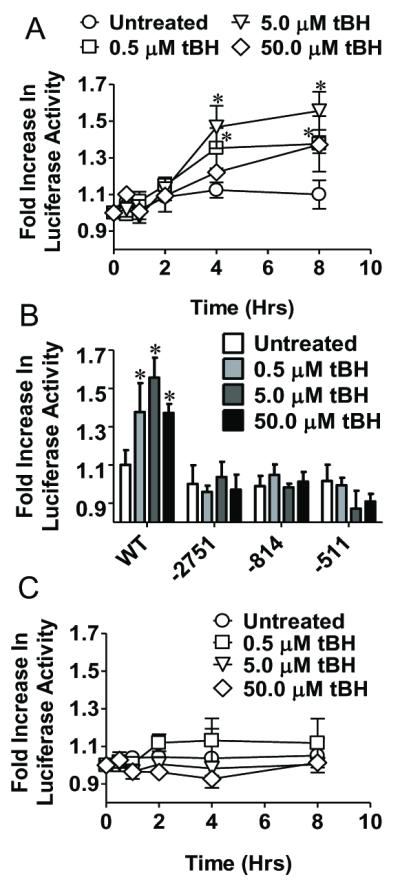
Panel A shows changes in luciferase activity over time in response to either 0.5, 5, or 50 μM tBH treatment in a cell line stably expressing a luciferase reporter gene driven by the human GCLc promoter (IHEC-GCLc-luc). * p<0.05 vs Untreated. Panel B compares changes in luciferase activity with tBH treatment in IHEC expressing either the full length (WT) GCLc promoter or various length truncations (−2751, −814, −511). *p<0.05 vs Untreated for respective cell line. Panel C shows a time course of change in luciferase activity with tBH treatment in IHEC stably expressing a luciferase reporter gene driven by the human GCLc promoter with a T → G mutation in ARE4 (IHEC-mutGCLc-luc).
ARE4 was previously shown to be essential for full induction of the human GCLc promoter by the polyaromatic hydrocarbon β-naphthoflavone (β-NF) [6]. A role for ARE4 in tBH-mediated induction of luciferase activity was tested using WT GCLc, and IHEC lines with truncated versions of the promoter (−2751 GCLc, −814 GCLc, and −511 GCLc). Figure 2B shows that only WT GCLc, but not cells with truncated GCLc promoter, stimulated luciferase activity at 8h when treated with at 0.5, 5, and 50 μM tBH, consistent with a requirement of ARE4 for tBH induction of promoter activity. The lack of induction of luciferase activity by the same range of tBH in ARE4 mut GCLc cells (Figure 2C) confirmed that ARE4 is essential for GCLc promoter activation by tBH.
Insulin increases IHEC GCLc promoter activity in an ARE4 dependent manner
Insulin was shown to induce transcriptional upregulation of GCLc expression in rat hepatocytes [18, 19] and in IHECs under conditions of chronic high glucose [12] and acute low glucose [13]. To examine potential ARE4 involvement in insulin-mediated GCLc induction luciferase activity was determined in WT GCLc cells treated with 100 nM insulin for 8h. Interestingly, insulin had no effect on luciferase activity in IHECs incubated in 5.5 mM glucose (normoglycemia) (Figure 3A). When media glucose was reduced (see methods), insulin administration resulted in significant increases in luciferase activity at 8h (Figure 3B), suggesting that a hypoglycemic state promotes insulin-mediated GCLc promoter activity. Luciferase activity was similarly stimulated to the same extent by insulin administration (100nM) to WT GCLc cells incubated in 25mM glucose (hyperglycemia) (Figure 3B). These results show that insulin induction of IHEC GCLc promoter activity occurred at altered glucose conditions in agreement with our previous findings [12, 13].
Figure 3. Insulin increases GCLc promoter activity at high and low glucose concentrations.
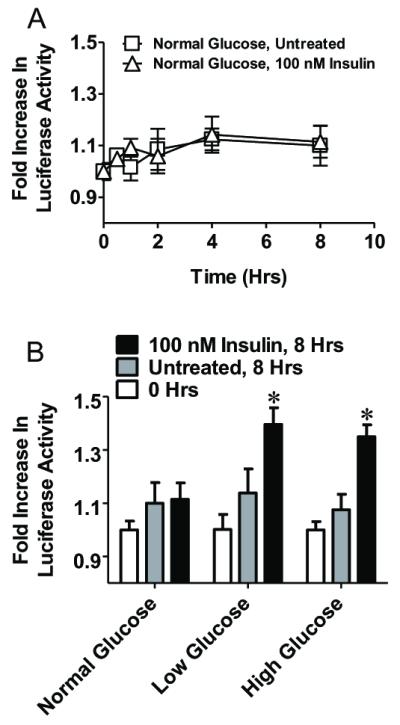
Panel A. A time course of change in luciferase activity in IHEC-GCLc-luc treated with or without 100 nM insulin in fresh, serum free media. Panel B. IHEC-GCLc-luc cells were treated with 100 nM insulin in either fresh, serum free media, glucose depleted media, or glucose supplemented media, and luciferase activity was measured 8 hrs after insulin treatment. * p<0.05 vs 0 hrs at the respective glucose concentration.
A possible role for ARE4 in the insulin response was examined using WT GCLc and IHEC lines containing truncated promoter vectors treated with 100 nM insulin under conditions of high and low glucose. Figure 4A shows that insulin was effective in increasing luciferase activity only in WT GCLc cells expressing the full length promoter, but not the truncated versions. Moreover, insulin failed to increase luciferase activity in ARE4 mut GCLc cells regardless of glucose status (Figure 4B), confirming that a functional ARE4 is essential for insulin-mediated activation of GCLc promoter activity at elevated and compromised glucose status. To our knowledge, this is the first evidence of ARE4 involvement in growth factor or hormone mediated GCLc induction.
Figure 4. The insulin induction of GCLc promoter activity under high and low glucose conditions is ARE4 dependent.
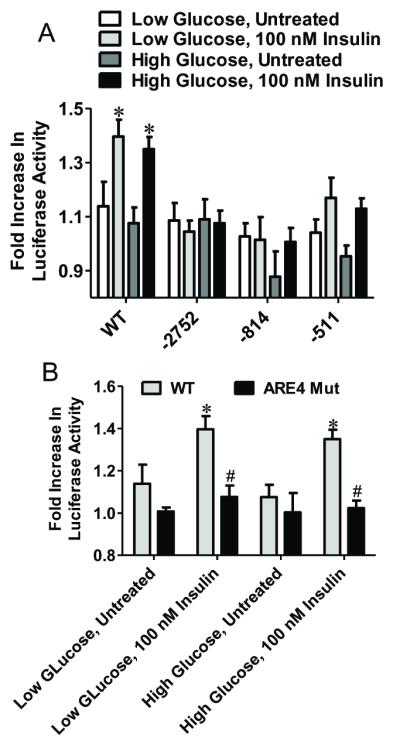
Panel A compares changes in luciferase activity with insulin treatment in IHEC expressing either the full length (WT) GCLc promoter or various length truncations (−2751, −814, −511). * p<0.05 vs Untreated for respective cell line and glucose concentration. Panel B compares changes in luciferase activity between IHEC-GCLc-luc and IHEC-mutGCLc-luc cells with insulin treatment under high and low glucose conditions. * p<0.05 vs Untreated for respective cell type and glucose concentration; # p<0.05 vs WT under identical treatment conditions.
Insulin-induced GCLc promoter activation at altered glucose concentrations is dependent upon PI3K/Akt/mTOR signaling
To test whether the PI3 kinase-Akt-mTOR signaling pathway was central to insulin–mediated GCLc promoter activation, we pretreated WT GCLc cells with LY294002 (PI3K inhibitor), SH-5 (Akt inhibitor), or rapamycin (mTOR inhibitor) prior to insulin administration under conditions of high and low glucose. Treatment of cells with the inhibitors alone was without effect on promoter activity or cell death (data not shown). The results in Figure 5 demonstrate that insulin-mediated increase in luciferase activity under conditions of low (5A) or elevated (5B) glucose was completely abolished by the kinase inhibitors, consistent with the involvement of the PI3K/Akt/ mTOR pathway in induction of GCLc promoter activity, in agreement with previous observations [12, 13].
Figure 5. The insulin induction of GCLc promoter activity at high and low glucose is dependent upon PI3K/Akt/mTOR signaling.

This figure demonstrates the effect of inhibition of PI3K, Akt, and mTOR, in blocking the insulin induced increase in GCLc promoter activity in IHEC-GCLc-luc cells under conditions of low (Panel A) or high (Panel B) glucose. * p<0.05 vs all other treatment groups; # p<0.05 vs 8 hrs + insulin.
Co-administration of insulin and low dose tBH abrogates the necessity for a prerequisite glucose perturbation for the insulin effect
Given that hyper- and hypoglycemia increase ROS production [20-23] and that H2O2 can augment insulin signaling [24], we examined whether tBH added to cells at 5.5 mM glucose (normoglycemia) could mimic the oxidative state elicited by these perturbed glycemic states in insulin-GCLc promoter activation. The results show that at 5.5 mM glucose, 0.5 μM tBH alone increased luciferase activity by 4 and 8h (Figure 6A). Co-administration of tBH with insulin induced higher luciferase activity at 8h than tBH alone, suggesting that insulin-induced GCLc promoter activation is promoted by low level oxidants, a scenario that could occur during glucose depleted or elevated states. Figure 6B shows that at 0.5 μM tBH, insulin-tBH elicited an increase in luciferase activity that was greater than that with 0.5 μM tBH alone, consistent with insulin-tBH synergy. At this tBH dose (0.5 μM), there was no detectable oxidative stress as evidenced by a lack of GSSG formation. In comparison, insulin-tBH co-treatment at 10-fold higher tBH (5 μM) increased luciferase activity to the same magnitude as that for 5 μM tBH alone, indicating a loss of the insulin effect. Interestingly, co-administration of insulin with 50 μM tBH resulted in attenuated luciferase activity that was not attributed to cell death. Neither insulin nor tBH stimulated luciferase activity in ARE4 mut GCLc cells (Figure 6C), indicating the co-effect of insulin plus tBH at 5.5 mM glucose was ARE4-dependent. These results demonstrate that ARE4-dependent GCLc promoter induction by insulin under normoglycemic conditions was synergized at physiological tBH concentrations; this stimulatory response was ablated at high tBH levels.
Figure 6. Co-administration of insulin with tBH increases GCLc promoter activity at normal glucose concentrations.
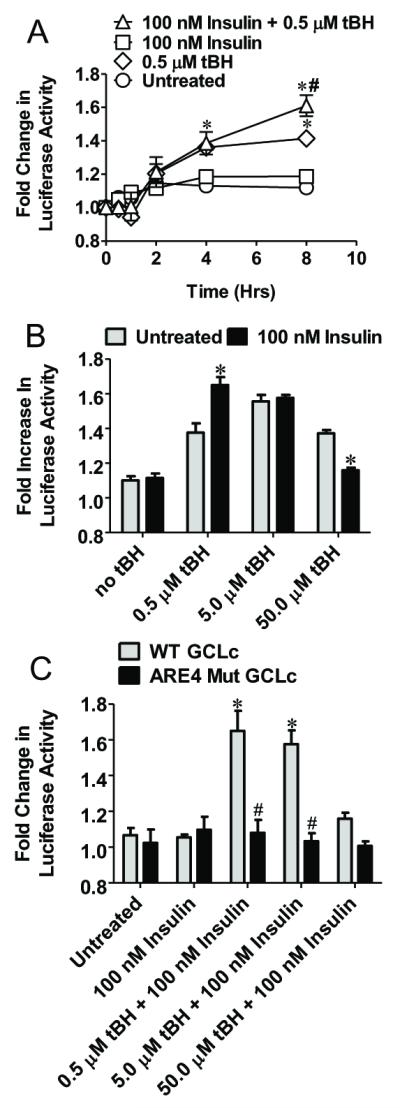
Panel A compares changes in luciferase activity in IHEC-GCLc-luc cells treated with both 100 nM insulin and 0.5 μM tBH at normal glucose concentrations. * p<0.05 vs Untreated at respective time point, # p<0.05 vs 0.5 μM tBH at respective time point. Panel B compares changes in luciferase activity in IHEC-GCLc-luc cells 8 hrs after cotreatment with 100 nM insulin and tBH (0-50 μM) or tBH alone at normal glucose concentrations. * p<0.05 vs Untreated at respective tBH concentration. Panel C compares changes in luciferase activity in IHEC-GCLc-luc and IHEC-mutGCLc-luc cells 8 hrs after cotreatment with 100 nM insulin and tBH (0-50 μM). * p<0.05 vs 100 nM insulin; # p<0.05 vs WT GCLc at respective tBH levels.
Insulin induced GCLc expression and de novo GSH synthesis under conditions of low, but not elevated glucose that was ROS-independent
We next determined whether activation of GCLc promoter by insulin at various glycemic states resulted in increased expression of GCLc protein and elevated de novo GSH synthesis. The results in Figure 7 show that hypoglycemia alone (0-3 mM glucose) increased GCLc protein expression and GSH concentrations (Figure 7A). Notably, severe glucose depletion elicited the highest increase in GCLc expression and cellular GSH. The presence of insulin further enhanced the upregulation of GCLc expression and doubled cellular GSH concentration at 0 and 0.5 mM glucose (Figure 7B), indicating hypoglycemia-insulin synergy. Indeed, the glucose dose-GCLc and GSH relationship was left shifted by insulin, which directly correlated with insulin activation of GCLc promoter activity at low glucose. Surprisingly, exposure of cells for 8h to media glucose at 10 and 25 mM (2-to-5-fold higher than normal (5mM)) did not increase GCLc expression or GSH, regardless of whether insulin was absent or present (Figure 7), a response that did not correspond to insulin mediating GCLc promoter activation under elevated glucose state (see Figure 3B).
Figure 7. Reduced glucose and combined low glucose and insulin conditions induces GCLc expression and cellular GSH levels.

Panel A shows the influence of various glucose media glucose concentrations on protein expression of GCLc and cellular GSH concentrations. GSH increases at 0 or 0.5mM media glucose were significantly higher (* p<0.01) than that at normal (5 mM) media glucose. Panel B illustrates that the impact of 100nM insulin on GCLc expression and GSH levels under various media glucose status. GCLc expression and GSH increases under conditions of combined insulin and 0, 0.5 and 1 mM media glucose were significantly higher (*p<0.01) than at 5mM glucose plus insulin. For western analysis, one representation of 3 separate blots is presented in each instance.
The increases in cellular GSH mediated by hypoglycemia- (Figure 8A) as well as combined hypoglycemia-insulin (Figure 8B) were abrogated by BSO, but was unaffected by tempol, an SOD mimetic and ROS scavenger. These results suggest that net GSH increases were the result of de novo synthesis from increased GCLc expression consequent to stimulatory actions of insulin/low glucose on the GCLc promoter. The lack of an effect of tempol suggests that hypoglycemia-mediated GSH increases may be ROS independent.
Figure 8. Reduced glucose and combined low glucose and insulin mediate de novo GSH synthesis, independently of ROS.

Panels A and B respectively show the effect of tempol, an ROS scavenger and BSO (GSH synthesis inhibitor) on hypoglycemia or combined hypoglycemia and insulin-induced endothelial GSH increases. The lack of an effect of tempol and the inhibitory effect of BSO are consistent with hypoglycemia (plus/minus insulin) mediating de novo GSH synthesis independent of a role for ROS. * p<0.001, 0.5 mM glucose versus 5 mM glucose (without or with insulin); # p<0.001, 0.5 mM glucose versus 0.5 mM glucose plus BSO (without or with insulin).
To further test for possible ROS involvement, we measured ROS production under various glucose concentrations. The results show that only hypoglycemia (0-1 mM glucose), but not hyperglycemia (10-25 mM glucose) increased DHR oxidation in the absence (Figure 9A) or presence of insulin (Figure 9B), that was prevented by the addition of tempol (Figure C & D), consistent with elevated ROS production at low glucose. It is notable however, that insulin addition resulted in lower ROS generation, regardless of glucose status (Figure 9B); one explanation could be that insulin promoted ROS elimination, and consequent GSH consumption may account for lower GSH levels (though not statistically significant) in the presence of insulin (Figures 7, 8).
Figure 9. Reduced glucose and combined low glucose and insulin conditions induces ROS production.

Panel A shows the influence of various glucose concentrations on ROS production, as measured by rhodamine 123 fluorescence, expressed as Ft-F0/F0 where Ft and F0, represents the fluorescence at times, 8h and 0h, respectively. Increases in fluorescence at 0 or 0.5mM glucose were significantly higher (* p< 0.01) than that at normal (5 mM) media glucose. Panel B illustrates the influence of 100nM insulin on ROS production under various glucose status. ROS production under combined conditions of glucose (0 and 0.5 mM) and insulin was significantly higher (*p< 0.001, 0.01) than at 5mM glucose plus insulin. Panel C and D respectively show the effect of tempol on ROS production induced by hypoglycemia (0mM glucose, C) or by combined hypoglycemia and insulin (D). The attenuation of rhodamine fluorescence by tempol is consistent with elevated ROS production. * p<0.001, 0mM glucose versus 5 mM glucose (without or with insulin); # p<0.001, 0 mM glucose versus 0 mM glucose plus tempol (without or with insulin).
The finding that tempol prevented ROS production (Figure 9), but failed to block hypoglycemia or combined hypoglycemia/insulin-induced GSH increases (see Figure 8A & B), suggests that direct ROS stress is unlikely to be a key mechanism by which hypoglycemia and/or insulin mediated GSH increases. To determine if metabolic stress induced by glucose depletion contributed to GSH increases, cells were incubated with pyruvate, a major glucose metabolite, in the absence of glucose. The results in Figure 10 show that cellular GSH increases induced by hypoglycemia- or combined hypoglycemia and insulin was partially blocked at 5mM, but not at 1mM pyruvate, suggesting that a mere imbalance in glucose metabolism was not a critical factor in GSH induction.
Figure 10. Administration of pyruvate, a major glucose metabolite, minimally attenuates endothelial GSH induced by low glucose and combined low glucose and insulin.

Panels A and B respectively show the effect of pyruvate (1 or 5 mM) on hypoglycemia- or combined hypoglycemia and insulin-induced endothelial GSH increases. The minimal effect of pyruvate on the increase in endothelial GSH mediated by hypoglycemia (plus/minus insulin) suggests a minor role for hypoglycemia-mediated metabolic stress in GSH induction. * p<0.01, 0 mM glucose versus 5 mM glucose (without or with insulin); # p<0.05, 0 mM glucose versus 0 mM glucose plus 5mM pyruvate (without or with insulin).
Discussion
Insulin has been shown to induce transcriptional upregulation of GCLc in rat hepatocytes [18, 19], and we previously demonstrated the same influence of insulin on GCLc expression in IHECs under conditions of low and high glucose [12, 13]. However, the effects of insulin on GCLc promoter activity have not been directly examined, nor has the possibility that ARE4 within the GCLc promoter plays a role. Here, we present evidence that insulin increases GCLc promoter activity in IHECs under conditions of altered glycemic states, and that promoter activation requires ARE4. Additionally, insulin-GCLc promoter activation under low glucose conditions was coincident with increased cellular expression of GCLc protein and elevated GSH concentrations that were attributed to de novo synthesis. These results are consistent with insulin mediating endothelial GSH increases through the transcriptional upregulation of GCLc and that, like β-NF [6] and H2O2 [25], insulin utilizes ARE4 for induction of promoter activity. This observation is the first demonstration of a requirement of an ARE (ARE4) in growth factor mediated activation of the GCLc promoter. The fact that diverse stimuli like insulin and electrophilic compounds can stimulate GCLc promoter activity in an ARE4-dependent manner suggests a common and conserved underlying transcriptional mechanism of regulation of GCL and elevation of endothelial GSH.
It is notable that maximal GLCc promoter activation was modest, consistently between 1.5 to 2-fold, regardless of the inducing agent. This magnitude of promoter induction was reflected in similar quantitative (~2-fold) increases in GCLc expression, GCL activity, and cellular GSH levels mediated by insulin or glycemic or carbonyl stresses in IHEC cells [12, 13]. Similar modest increases in GCL and GSH were documented in hepatocytes [18]. Importantly, our recent studies demonstrated that insulin-mediated 2-fold elevation in cellular GSH in IHECs was effective in protecting against hyperglycemia-induced apoptosis [12], and in buffering against tBH-induced cellular GSH depletion [13]. Taken together, these results suggest that the transcriptional regulation of GCLc in cellular GSH homeostasis is a tightly controlled process, and that modest GCLc changes can have a profound impact on cellular GSH redox buffer and IHEC survival.
H2O2, like insulin, stimulates PI3K [26] and PKC [27] activities which regulate Nrf2/ARE-driven gene expression [28, 29]. H2O2 has been shown to increase GCL mRNA in cultured cells [30] and activate GCLc ARE4 in a luciferase reporter system [25]. Thus, the use of tBH as a model oxidant in the current study was a feasible approach to validate the luciferase reporter expression system in IHEC cell lines containing the human GCLc promoter and various truncations of this promoter. The finding that tBH activated GCLc promoter activity in an ARE4 dependent manner agrees with previous studies using electrophilic agents [6]; however, there are several novel and interesting aspects of our results with the tBH responses. Notably, GCLc promoter activation was attenuated at 50 μM tBH, resembling a pathophysiological peroxide level associated with GSH depletion. Because a redox active cysteine within the Nrf2 DNA binding region is essential for its function [31], it is conceivable that oxidation of this cysteine by elevated peroxide levels would prevent transcription factor binding and promoter activation. Moreover, peroxide inhibition of PKC [32] and Akt [33] activities and oxidative modification of the PI3K/Akt/mTOR pathway [12, 13] could be an upstream target in insulin-GCLc promoter activity.
The studies of insulin-tBH co-administration are important for understanding the relationship between insulin and oxidant regulation of GCL activity and endothelial GSH status. The finding that combined insulin-0.5 μM tBH treatment significantly increased GCLc promoter activity agrees with previous observation that H2O2 enhanced insulin signaling [34]. Moreover, the insulin stimulation of GCLc promoter activity under normal glucose conditions when co-administered with 0.5 μM tBH suggests that low level ROS may be a requisite factor in the insulin effect. This line of reasoning supports the notion that hypo- and/or hyper-glycemic stress via ROS generation [20-23, 34] would activate GCLc promoter function. Interestingly, while hypoglycemia did increase ROS production (Figure 9), our results suggests that ROS was unlikely to be a major trigger in or did not achieve the threshold for endothelial GSH increases at low glucose regardless of the insulin status (Figure 8), suggesting roles for other mediators. One possibility could be the induction of metabolic stress due to glucose depletion. However, the addition of pyruvate, a central glucose metabolite at 5mM concentration resulted in only partial reversal of the low glucose effect on endothelial GSH (Figure 10). This suggests that hypoglycemia-induced metabolic stress is a relatively minor contributor to the GSH increases observed under low glucose conditions. Therefore, the identification of candidate mediators of endothelial GCLc regulation associated with the reduced glucose state warrant further study. It is notable, however, that insulin sensitizes the GCLc promoter response to tBH stimulation; the concentration of tBH for maximal GCLc promoter activation was lowered by 10-fold in the presence of insulin (from 5 μM to 0.5 μM, Figure 6B). In this scenario, insulin could function to lower the oxidant threshold to mount a robust cellular antioxidant response (e.g., increased GCLc expression and GSH biosynthesis), a response that would be critical to cell survival during oxidative challenge [13].
The result that insulin-mediated activation of the GCLc promoter under conditions of high and low glucose is in agreement with previous findings that altered glycemic status was permissive for insulin-mediated GCLc upregulation in IHECs [12, 13]. Surprisingly, the insulin effect on downstream GCLc protein expression and cellular GSH increases were observed only under low glucose conditions. It is unclear why acute hyperglycemia, despite stimulating GCLc promoter activation (Figure 3B), failed to induce GCLc expression and GSH production (Figure 7). This current result is in contrast to the previously observed robust increases in GCLc protein expression and GSH levels in IHECs exposed to chronic hyperglycemia [12]. A notable difference between the current and our previous study [12, 13] is the duration of high glucose exposure (8h versus 7 days, respectively); an extended duration of hyperglycemic stress may be important for cytosolic expression of GCLc and GSH synthesis despite early induction of promoter activation during elevated glucose status.
In summary, the present study provides novel mechanistic insights into insulin control of endothelial GSH status. The magnitude of stimulation of GCLc promoter activity by insulin was reflected in quantitative increases in GCLc protein expression and cellular GSH synthesis. These results will have important implication for endothelial redox biology and pathobiology under conditions of perturbed plasma glycemic status. The responsiveness of the GLCc promoter to insulin stimulation raises the interesting question as to whether the other vascular growth factors, such as VEGF, can mimic insulin in endothelial GSH regulation. This unresolved question is the subject of current investigation in our laboratory.
Highlights.
> Insulin activates GCL promoter under increased or decreased glucose conditions. > Glycemic requirement was abrogated by insulin-hydroperoxide co-administration. > Intact antioxidant response element-4 was critical for GCL promoter activation. > Only at low glucose did promoter activation correlate with GCL and GSH increases. > Neither ROS nor metabolic stress is key player in promoter activation at low glucose.
Acknowledgement
This study is supported by a grant DK44510 from the National Institutes of Health. WL is supported by a Malcolm Feist Cardiovascular Fellowship, LSUHSC. We thank Dr. Magdalena Circu for editorial assistance.
Footnotes
Publisher's Disclaimer: This is a PDF file of an unedited manuscript that has been accepted for publication. As a service to our customers we are providing this early version of the manuscript. The manuscript will undergo copyediting, typesetting, and review of the resulting proof before it is published in its final citable form. Please note that during the production process errors may be discovered which could affect the content, and all legal disclaimers that apply to the journal pertain.
References
- [1].Forman HJ, Fukuto JM, Torres M. Redox signaling: thiol chemistry defines which reactive oxygen and nitrogen species can act as second messengers. American journal of physiology. 2004;287:C246–256. doi: 10.1152/ajpcell.00516.2003. [DOI] [PubMed] [Google Scholar]
- [2].Rahman I. Regulation of glutathione in inflammation and chronic lung diseases. Mutat Res. 2005;579:58–80. doi: 10.1016/j.mrfmmm.2005.02.025. [DOI] [PubMed] [Google Scholar]
- [3].Yang H, Magilnick N, Ou X, Lu SC. Tumour necrosis factor alpha induces co-ordinated activation of rat GSH synthetic enzymes via nuclear factor kappaB and activator protein-1. Biochem J. 2005;391:399–408. doi: 10.1042/BJ20050795. [DOI] [PMC free article] [PubMed] [Google Scholar]
- [4].Sun WM, Huang ZZ, Lu SC. Regulation of gamma-glutamylcysteine synthetase by protein phosphorylation. Biochem J. 1996;320(Pt 1):321–328. doi: 10.1042/bj3200321. [DOI] [PMC free article] [PubMed] [Google Scholar]
- [5].Huang CS, Chang LS, Anderson ME, Meister A. Catalytic and regulatory properties of the heavy subunit of rat kidney gamma-glutamylcysteine synthetase. J Biol Chem. 1993;268:19675–19680. [PubMed] [Google Scholar]
- [6].Mulcahy RT, Wartman MA, Bailey HH, Gipp JJ. Constitutive and beta-naphthoflavone-induced expression of the human gamma-glutamylcysteine synthetase heavy subunit gene is regulated by a distal antioxidant response element/TRE sequence. J Biol Chem. 1997;272:7445–7454. doi: 10.1074/jbc.272.11.7445. [DOI] [PubMed] [Google Scholar]
- [7].Madamanchi NR, Vendrov A, Runge MS. Oxidative stress and vascular disease. Arterioscler Thromb Vasc Biol. 2005;25:29–38. doi: 10.1161/01.ATV.0000150649.39934.13. [DOI] [PubMed] [Google Scholar]
- [8].Widder JD, Guzik TJ, Mueller CF, Clempus RE, Schmidt HH, Dikalov SI, Griendling KK, Jones DP, Harrison DG. Role of the multidrug resistance protein-1 in hypertension and vascular dysfunction caused by angiotensin II. Arterioscler Thromb Vasc Biol. 2007;27:762–768. doi: 10.1161/01.ATV.0000259298.11129.a2. [DOI] [PubMed] [Google Scholar]
- [9].Biswas SK, Newby DE, Rahman I, Megson IL. Depressed glutathione synthesis precedes oxidative stress and atherogenesis in Apo-E(-/-) mice. Biochem Biophys Res Commun. 2005;338:1368–1373. doi: 10.1016/j.bbrc.2005.10.098. [DOI] [PubMed] [Google Scholar]
- [10].Tachi Y, Okuda Y, Bannai C, Bannai S, Shinohara M, Shimpuku H, Yamashita K, Ohura K. Hyperglycemia in diabetic rats reduces the glutathione content in the aortic tissue. Life Sci. 2001;69:1039–1047. doi: 10.1016/s0024-3205(01)01183-3. [DOI] [PubMed] [Google Scholar]
- [11].Muniyappa R, Montagnani M, Koh KK, Quon MJ. Cardiovascular actions of insulin. Endocr Rev. 2007;28:463–491. doi: 10.1210/er.2007-0006. [DOI] [PubMed] [Google Scholar]
- [12].Okouchi M, Okayama N, Alexander JS, Aw TY. NRF2-dependent glutamate-L-cysteine ligase catalytic subunit expression mediates insulin protection against hyperglycemia- induced brain endothelial cell apoptosis. Current neurovascular research. 2006;3:249–261. doi: 10.2174/156720206778792876. [DOI] [PubMed] [Google Scholar]
- [13].Langston W, Circu ML, Aw TY. Insulin stimulation of gamma-glutamylcysteine ligase catalytic subunit expression increases endothelial GSH during oxidative stress: influence of low glucose. Free Radic Biol Med. 2008;45:1591–1599. doi: 10.1016/j.freeradbiomed.2008.09.013. [DOI] [PMC free article] [PubMed] [Google Scholar]
- [14].Pias EK, E. O, Rhoads CA, Fuseler J, Harrison L, Aw TY. Differential effects of superoxide dismutase isoform expression on hydroperoxide-induced apoptosis in PC-12 cells. J Biol Chem. 2003;278:13294–13301. doi: 10.1074/jbc.M208670200. [DOI] [PubMed] [Google Scholar]
- [15].Reed DJ, Babson JR, Beatty PW, Brodie AE, Ellis WW, Potter DW. High-performance liquid chromatography analysis of nanomole levels of glutathione, glutathione disulfide, and related thiols and disulfides. Analytical biochemistry. 1980;106:55–62. doi: 10.1016/0003-2697(80)90118-9. [DOI] [PubMed] [Google Scholar]
- [16].Cheng LL, Li B, Luo JD, Tu HB, Liu QC, Ran P. Identification of an E-box motif as a transcriptional repressor element in the proximal promoter region of the GCLC gene in rat lung epithelial L2 cells. Free Radic Biol Med. 2005;39:1030–1040. doi: 10.1016/j.freeradbiomed.2005.05.025. [DOI] [PubMed] [Google Scholar]
- [17].Stover SK, Gushansky GA, Salmen JJ, Gardiner CS. Regulation of gamma-glutamate-cysteine ligase expression by oxidative stress in the mouse preimplantation embryo. Toxicol Appl Pharmacol. 2000;168:153–159. doi: 10.1006/taap.2000.9030. [DOI] [PubMed] [Google Scholar]
- [18].Lu SC, Ge JL, Kuhlenkamp J, Kaplowitz N. Insulin and glucocorticoid dependence of hepatic gamma-glutamylcysteine synthetase and glutathione synthesis in the rat. Studies in cultured hepatocytes and in vivo. J Clin Invest. 1992;90:524–532. doi: 10.1172/JCI115890. [DOI] [PMC free article] [PubMed] [Google Scholar]
- [19].Kim SK, Woodcroft KJ, Khodadadeh SS, Novak RF. Insulin signaling regulates gamma-glutamylcysteine ligase catalytic subunit expression in primary cultured rat hepatocytes. J Pharmacol Exp Ther. 2004;311:99–108. doi: 10.1124/jpet.104.070375. [DOI] [PubMed] [Google Scholar]
- [20].Zanetti M, Zwacka R, Engelhardt J, Katusic Z, O’Brien T. Superoxide anions and endothelial cell proliferation in normoglycemia and hyperglycemia. Arterioscler Thromb Vasc Biol. 2001;21:195–200. doi: 10.1161/01.atv.21.2.195. [DOI] [PubMed] [Google Scholar]
- [21].Cosentino F, Hishikawa K, Katusic ZS, Luscher TF. High glucose increases nitric oxide synthase expression and superoxide anion generation in human aortic endothelial cells. Circulation. 1997;96:25–28. doi: 10.1161/01.cir.96.1.25. [DOI] [PubMed] [Google Scholar]
- [22].Du XL, Edelstein D, Rossetti L, Fantus IG, Goldberg H, Ziyadeh F, Wu J, Brownlee M. Hyperglycemia-induced mitochondrial superoxide overproduction activates the hexosamine pathway and induces plasminogen activator inhibitor-1 expression by increasing Sp1 glycosylation. Proc Natl Acad Sci U S A. 2000;97:12222–12226. doi: 10.1073/pnas.97.22.12222. [DOI] [PMC free article] [PubMed] [Google Scholar]
- [23].Widlansky M, Wang J, Alexannian A, Gutterman DD. Abstract 1088: Acute Hypoglycemia Induces Mitochondria-Mediated Superoxide Production and Apoptosis in Endothelial Cells: Inhibition by AMP Kinase Activation Through an eNOS Dependent Mechanism. Circulation. 2009;120 [Google Scholar]
- [24].Droge W. Free radicals in the physiological control of cell function. Physiol Rev. 2002;82:47–95. doi: 10.1152/physrev.00018.2001. [DOI] [PubMed] [Google Scholar]
- [25].Go YM, Gipp JJ, Mulcahy RT, Jones DP. H2O2-dependent activation of GCLC-ARE4 reporter occurs by mitogen-activated protein kinase pathways without oxidation of cellular glutathione or thioredoxin-1. J Biol Chem. 2004;279:5837–5845. doi: 10.1074/jbc.M307547200. [DOI] [PubMed] [Google Scholar]
- [26].Ushio-Fukai M, Alexander RW, Akers M, Yin Q, Fujio Y, Walsh K, Griendling KK. Reactive oxygen species mediate the activation of Akt/protein kinase B by angiotensin II in vascular smooth muscle cells. J Biol Chem. 1999;274:22699–22704. doi: 10.1074/jbc.274.32.22699. [DOI] [PubMed] [Google Scholar]
- [27].Taher MM, Garcia JG, Natarajan V. Hydroperoxide-induced diacylglycerol formation and protein kinase C activation in vascular endothelial cells. Arch Biochem Biophys. 1993;303:260–266. doi: 10.1006/abbi.1993.1281. [DOI] [PubMed] [Google Scholar]
- [28].Huang HC, Nguyen T, Pickett CB. Regulation of the antioxidant response element by protein kinase C-mediated phosphorylation of NF-E2-related factor 2. Proc Natl Acad Sci U S A. 2000;97:12475–12480. doi: 10.1073/pnas.220418997. [DOI] [PMC free article] [PubMed] [Google Scholar]
- [29].Nakaso K, Yano H, Fukuhara Y, Takeshima T, Wada-Isoe K, Nakashima K. PI3K is a key molecule in the Nrf2-mediated regulation of antioxidative proteins by hemin in human neuroblastoma cells. FEBS Lett. 2003;546:181–184. doi: 10.1016/s0014-5793(03)00517-9. [DOI] [PubMed] [Google Scholar]
- [30].Ding Y, Choi KJ, Kim JH, Han X, Piao Y, Jeong JH, Choe W, Kang I, Ha J, Forman HJ, Lee J, Yoon KS, Kim SS. Endogenous hydrogen peroxide regulates glutathione redox via nuclear factor erythroid 2-related factor 2 downstream of phosphatidylinositol 3-kinase during muscle differentiation. Am J Pathol. 2008;172:1529–1541. doi: 10.2353/ajpath.2008.070429. [DOI] [PMC free article] [PubMed] [Google Scholar]
- [31].Bloom D, Dhakshinamoorthy S, Jaiswal AK. Site-directed mutagenesis of cysteine to serine in the DNA binding region of Nrf2 decreases its capacity to upregulate antioxidant response element-mediated expression and antioxidant induction of NAD(P)H:quinone oxidoreductase1 gene. Oncogene. 2002;21:2191–2200. doi: 10.1038/sj.onc.1205288. [DOI] [PubMed] [Google Scholar]
- [32].Gopalakrishna R, Anderson WB. Ca2+- and phospholipid-independent activation of protein kinase C by selective oxidative modification of the regulatory domain. Proc Natl Acad Sci U S A. 1989;86:6758–6762. doi: 10.1073/pnas.86.17.6758. [DOI] [PMC free article] [PubMed] [Google Scholar]
- [33].Murata H, Ihara Y, Nakamura H, Yodoi J, Sumikawa K, Kondo T. Glutaredoxin exerts an antiapoptotic effect by regulating the redox state of Akt. J Biol Chem. 2003;278:50226–50233. doi: 10.1074/jbc.M310171200. [DOI] [PubMed] [Google Scholar]
- [34].Wu X, Zhu L, Zilbering A, Mahadev K, Motoshima H, Yao J, Goldstein BJ. Hyperglycemia potentiates H(2)O(2) production in adipocytes and enhances insulin signal transduction: potential role for oxidative inhibition of thiol-sensitive protein-tyrosine phosphatases. Antioxid Redox Signal. 2005;7:526–537. doi: 10.1089/ars.2005.7.526. [DOI] [PMC free article] [PubMed] [Google Scholar]