Abstract
Objective
We have previously shown that increasing protein O-linked β-N-acetylglucosamine (O-GlcNAc) levels by different mechanisms reduced inflammatory responses and improved organ function 2 hours after trauma-hemorrhage (T-H). The aim of the study was to evaluate the effects of O-GlcNAc levels on survival, inflammation and organ damage 24 hours after T-H.
Design
Prospective, randomized, controlled study.
Setting
Animal research laboratory.
Subjects
Male, adult Sprague-Dawley rats.
Interventions
Overnight fasted animals were subjected to either sham surgery (SH) or (T-H) and during the resuscitation phase received glucosamine (270 mg/Kg, GlcN) to increase O-GlcNAc synthesis or O-(2-Acetamido-2-deoxy-D-glucopyranosylidene)amino N-phenyl Carbamate, (7mg/Kg, PUGNAc) to inhibit O-GlcNAc removal, or mannitol as control (CON).
Measurements and main results
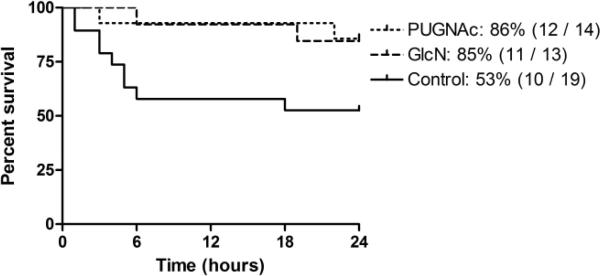
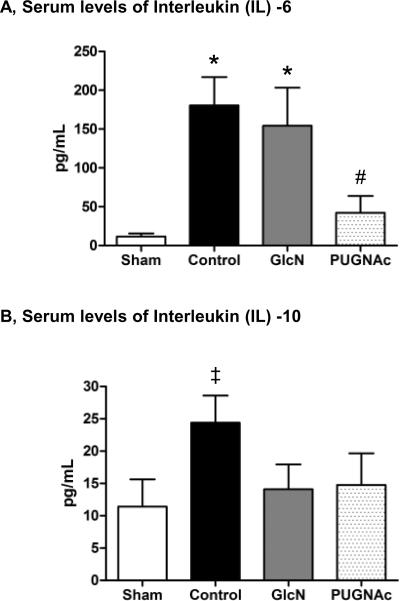
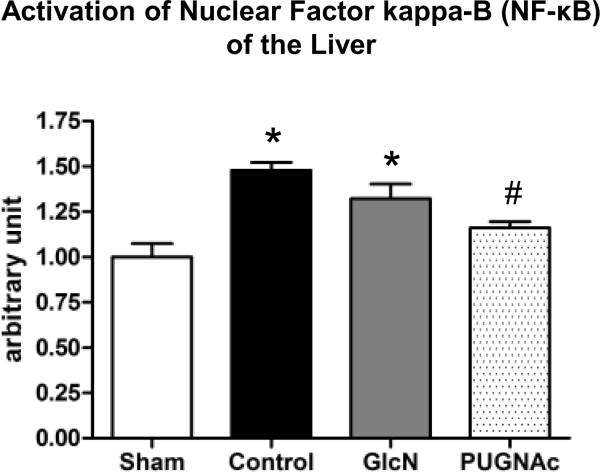
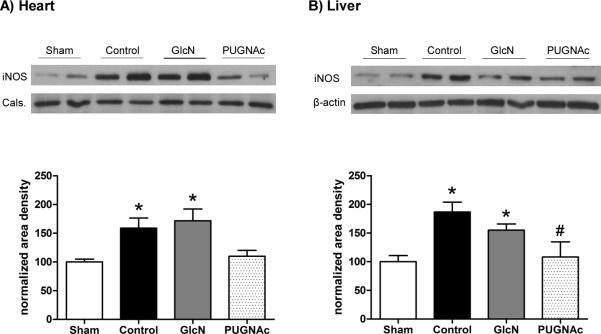
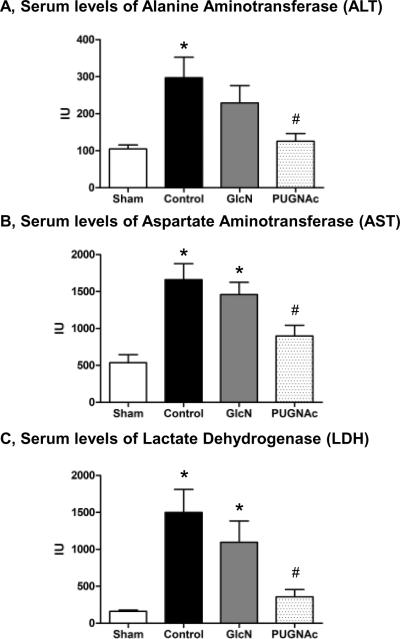
Survival was followed up for 24 hours. Surviving rats were euthanized and inflammatory responses, and end organ injuries were assessed. Both GlcN and PUGNAc increased 24 hours survival compared to controls (CON: 53%, GN: 85%, PUGNAc: 86%, logrank test, p<0.05). PUGNAc attenuated the T-H induced increase in serum IL-6 (SH: 8±6, CON: 181±36, PUGNAc: 42±22 pg/mL, p<0.05), ALT (SH: 95±14, CON: 297±56, PUGNAc: 126±21 IU, p<0.05), AST (SH: 536±110, CON: 1661±215, PUGNAc: 897±155 IU, p<0.05) and LDH (SH: 160±18, CON: 1499±311, PUGNAc: 357±99 IU, p<0.05); however, GlcN had no effect on these serum parameters. Furthermore, PUGNAc but not GlcN maintained O-GlcNAc levels in liver and lung and significantly attenuated the NF-κB DNA activation in the liver. In the liver and heart, increased iNOS expression was also attenuated in the PUGNAc treated group.
Conclusions
These results demonstrate that increasing O-GlcNAc with either GlcN or PUGNAc improved 24 hour survival after T-H. However, only PUGNAc treatment attenuated significantly the subsequent tissue injury and inflammatory responses, suggesting that inhibition of O-GlcNAc removal may represent a new therapeutic approach for the treatment of hypovolemic shock.
Keywords: hypovolemic shock, hexosamine biosynthesis pathway, O-GlcNAc, glucosamine, PUGNAc, multiple organ dysfunction syndrome
INTRODUCTION
Acute hyperglycemia is frequently associated with injuries, such as trauma and hemorrhagic shock (1). Stress induced hyperglycemia has been reported to be an adaptive mechanism (2–4) and prevention of this hyperglycemic response in rats increased mortality following hemorrhage (5). Although the precise role of stress induced hyperglycemia remains unresolved (6), early glycemic control improves outcome of ICU patients (7). A number of mechanisms have been proposed to account for the beneficial effects of stress induced hyperglycemia, including fuel (2) or mobilization of interstitial fluid reserves by increasing osmolarity (3, 4). Increased glucose levels also facilitate the flux through the hexosamine biosynthesis pathway (HBP), which has been linked to improved cell survival under stress-conditions (1, 8). One consequence of increased HBP flux is increased synthesis of O-linked β-N-acetylglucosamine (O-GlcNAc), attached to serine and threonine residues of proteins (1, 9).
In contrast to traditional O-glycosylation, protein O-GlcNAcylation is a rapid and reversible posttranslational modification of serine and threonine residues of nuclear and cytosolic proteins, analogous to phosphorylation (1, 8). O-GlcNAc levels are regulated by OGlcNAc transferase (OGT), a unique glycosyl transferase, which catalyzes the attachment of OGlcNAc to proteins and by O-GlcNAcase, which is responsible for the removal of the moiety (1). O-GlcNAc levels can be increased by exogenous glucosamine, which increases HBP flux and increases O-GlcNAc synthesis or by inhibition of O-GlcNAcase with PUGNAc (O-(2-acetamido-2-deoxy-D-glucopyranosylidene)amino-N-phenylcarbamate) (1, 10).
In a rat model of trauma-hemorrhage, we have shown that increasing O-GlcNAc levels improved cardiac function, tissue perfusion and attenuated inflammatory response 2 hours after resuscitation (11, 12). In a model of trauma-hemorrhage with minimal resuscitation we also demonstrated that increased O-GlcNAc formation was associated with significantly improved 2 hour survival rates (10). These studies suggest that increased O-GlcNAcylation improves short-term outcome following trauma-hemorrhage; however, there are no reports regarding the effects of O-GlcNAcylation in mediating the longer-term responses to trauma-hemorrhage and resuscitation (TH-R). Therefore, the purpose of this study was to determine whether increasing O-GlcNAc levels with either glucosamine or PUGNAc improves 24 hours survival in rats following severe trauma-hemorrhage and resuscitation, and if so, whether this was associated with decreased organ injury and attenuation of pro-inflammatory responses.
MATERIALS AND METHODS
Animals
Male, adult Sprague-Dawley rats (Charles-Rivers, Wilmington, MA) weighing 260–340 g were used throughout. All animals were fasted overnight before surgery; however, water was available ad libitum. All animal experiments were approved by the Animal Care and Use Committee of the University of Alabama at Birmingham and conformed to the Guide for the Care and Use of Laboratory Animals, published by the National Institutes of Health (NIH Publication No. 85Y23, 1996).
Reagents
All reagents and solutions were purchased from Thermo Fisher Scientific Inc. (Waltham, MA) or from Sigma-Aldrich (St. Louis, MO), unless indicated otherwise. PUGNAc was obtained from Toronto Research Chemicals, Inc., (North York, On., Canada).
Trauma-hemorrhage model
We adapted our severe, volume-controlled hemorrhagic shock model (10), a modified version of the model published by Macias et al (13), by providing full resuscitation after blood withdrawal and 45 min of pressure controlled hypovolemia. Briefly, under isoflurane anesthesia (1.5% vol/vol, 1 L/min oxygen flow) two femoral arteries and the right femoral vein were cannulated for continuous blood pressure monitoring, blood withdrawal and drug administration. A 5-cm-long midline laparotomy was performed to induce a soft tissue damage to mimic trauma prior to hemorrhage. All of the surgical interventions were done under aseptic conditions. Animals were kept on heating pad with temperature set to 37 °C in effort to maintain central body temperature, monitored by a rectal thermocouple. Heparin was not administered at anytime during the procedures.
Hemorrhage was induced by withdrawal of 55% of the calculated total blood volume (total blood volume [mL] = body weight [g] × 0.061 (14)) for 25 min using a syringe pump (Harvard Instruments, Holliston, MA). Mean arterial pressure was maintained on 35–40 mmHg for 45 minutes (pressure controlled phase) by i.v. administration of small volumes of 0.9% NaCl (i.e., normal saline) solution until a maximum of 40% of the shed blood volume was returned. This was followed by resuscitation, with four times of total withdrawn blood volume of i.v. 0.9% NaCl, administered over 60 minutes, using syringe pump. The animals were allowed to wake up and observed up to 24 hours after resuscitation, at which point surviving animals were euthanized by i.v. injection of concentrated KCl solution. Blood, heart, lung and liver were collected for subsequent analyses as described below. During the 24 hours observation period any animals that were found to be moribund were euthanized and considered dead with respect to the survival analysis.
Experimental groups
Animals were randomly assigned to the following 4 groups: 1) Sham surgery; 2) Control (untreated) trauma-hemorrhage; 3) trauma-hemorrhage with glucosamine treatment (270 mg/Kg body weight) and 4) trauma-hemorrhage with PUGNAc treatment (7 mg/Kg body weight). In both treatment groups, 25% of total dose in a 2 mL increment was administered immediately after hemorrhage and the remaining 75% continuously during resuscitation. These doses of glucosamine and PUGNAc have been demonstrated in previous studies to increase O-GlcNAc levels and improve short-term recovery after trauma-hemorrhage and resuscitation (11, 12). The osmolarity of glucosamine solution used here is relatively high (~300–320 mOsm, pH adjusted to 7.36); therefore, to account for any osmolarity effects, the vehicle in both the control and PUGNAc groups included mannitol, to increase the osmolarity to that of the glucosamine solution, with a pH adjusted to 7.36. Sham surgery animals underwent only general anesthesia and vessel cannulation. All animals received 0.3 mg/Kg b.w. buprenorphine subcutaneously immediately following and 12 hours after resuscitation.
Blood gas analysis, serum enzyme, glucose and electrolyte measurements
Blood gas parameters, electrolytes, glucose and lactate levels from arterial samples were analyzed by using an Instrumentation Laboratory Gem Premier 3000 blood gas analyzer (Lexington, MA). Serum levels of alanine transaminase (ALT), aspartate transaminase (AST), lactate dehydrogenase (LDH), amylase, creatinine and blood urea nitrogen (BUN) were measured using Alfa Wassermann ACE© Clinical Chemistry System (Alfa Wassermann, Inc., West Caldwell, NJ) at the AnimalLabs veterinary laboratory (Birmingham, AL).
Serum cytokine levels
Serum levels of interleukin- (IL) 6 and 10; and tumor necrosis factor (TNF)-α were measured with sandwich enzyme-linked immunosorbent assay kits (IL-6: Pierce Rockford, IL; IL-10 and TNF-α: BioSource, Camarillo, CA), following the manufacturer's guidelines.
Immunoblots analyses
Protein levels and O-GlcNAc levels were assessed by immunoblot analyses as described in details elsewhere (10, 15). Briefly, proteins were separated on a 7–10 % SDS-PAGE (sodium dodecyl sulfate polyacrylamide gel) electrophoresis gel and transferred either to polyvinylidene difluoride (Millipore Corporation, Billerica, MA) or pure nitrocellulose membranes (Bio-Rad, Hercules, CA). Protein loading was confirmed by Sypro Ruby (Bio-Rad) staining. Membranes were incubated overnight with 1:1000 or 1:2500 dilution of CTD 110.6 (anti-O-GlcNAc), phosphoserine, phosphothreonine, GRP78 (Abcam, Cambridge, MA) or iNOS (BD Transduction Laboratories, San Jose, CA). For loading control, membranes were stripped and blots were incubated with β-actin (Sigma-Aldrich) or calsequestrine (Abcam) antibody. The densitometry of CTD 110.6 and phosphoserine / threonine immunoblots were performed by selecting the whole lane (all bands) in case of each sample and measuring the mean density of selected areas after background subtraction, using Scion Image analysis software (Scion Corporation, Frederick, MD).
Nuclear factor kappa-B (NF-κB), Apoptosis and Myeloperoxidase (MPO) assays
NF-κB was measured with an ELISA-based, colorimetric, oligonucleotid-binding assay (TransAM™, Active-Motif, Carlsbad, CA). Apoptosis was determined using the Cell Death Detection ELISAPLUS (Roche Applied Science, Indianapolis, IN). MPO was also determined using commercially available ELISA kits (Hycult Biotechnology, Uden, The Netherlands). All assays were performed using the manufacturer's guidelines. The Cell Death Detection ELISA has been reported to be a sensitive and quantitative method and is especially suited to assess apoptosis in large numbers of samples (16). Studies comparing histone ELISA (equivalent to Roche Cell Death ELISA) and TUNEL-staining have shown similar results from the two methods (17, 18).
Data analysis
Statistical analyses were performed using GraphPad Prism 4 software (GraphPad, San Diego, CA) and SPSS13.0 (SPSS Inc., Chicago, IL). The survival data were compared using log-rank test and were presented as survival percentage. Other statistical comparisons were performed using unpaired t-test, correlation or parametric one-way analysis of variance (ANOVA) with Bonferroni's or Dunnett's post hoc test, as appropriate. Data that were not normally distributed and/or of unequal variance underwent either log or rank transformations, and the analyses were performed on the transformed data with one-way or Kruskal-Wallis ANOVAs with Dunn's post hoc test, respectively.
RESULTS
Survival rates
A total of 50 animals were subjected to the trauma-hemorrhage and full resuscitation protocol (TH-R) and observed for 24 hours. Four animals died during either the initial surgical procedure or early during the resuscitation phase and were therefore excluded from any subsequent analyses. In contrast to less severe models of trauma-hemorrhage and resuscitation where the 24 hour survival is ~100% (19); as can be seen in Fig. 1, in this model, the mortality rate for the Control group was ~50%. The survival rate was significantly increased by both glucosamine (85%) and PUGNAc (86%) treatment. No mortality was observed in the Sham surgery group (data not shown).
Fig. 1. Survival curve: Percent survival over time for Control, GlcN and PUGNAc treated rats.
The survival percentage, the number of survival animals and the total number of animals subjected to TH-R in each groups are indicated on figure legend. Both glucosamine and PUGNAc treatment significantly improved survival, compared to Controls (Log-rank test, p<0.05). Zero (0) hour indicates the end of resuscitation.
Blood gas parameters, electrolytes, lactate and glucose levels
Blood gas parameters and other metabolic markers of shock are shown in Table 1. Data are presented from samples collected at five time points: 1) before hemorrhage; 2) at the end of hemorrhage; 3) immediately before resuscitation; 4) at the end of resuscitation and 5) in surviving animals, 24 hours after resuscitation. There were no significant differences in partial pressure of oxygen (PO2) between groups at anytime, presumably due to supplemental oxygen administered during anesthesia. Hemorrhagic shock induced hyperkalaemia, hypocalcaemia and severe acidosis (Table 1). Following blood withdrawal, the acidosis was similar in all groups; however, by the end of resuscitation, it was significantly improved by both glucosamine and PUGNAc administration, compared to Control animals, as indicated by increased HCO3−, TCO2, BE and decreased serum lactate levels. At the end of the 24 hours observation period, all parameters returned to baseline levels and there were no differences between groups.
Table 1.
Comparison of arterial blood gas parameters, electrolytes and lactate levels.
| Sham (n = 10) | Control (n≥9) | Glucosamine (n≥10) | PUGNAc (n≥11) | |
|---|---|---|---|---|
| Partial oxygen pressure, Po2 (torr, [kPa]) | ||||
| Before hemorrhage | 452 ± 21 [60.3 ± 2.8] | 412 ± 19 [54.9 ± 2.6] | 433 ± 22 [57.7 ± 2.9] | 454 ± 26 [60.6 ± 3.4] |
| After hemorrhage | 407 ± 14 [54.2 ± 1.8] | 418 ± 16 [55.7 ± 2.1] | 413 ± 26 [55.1 ± 3.3] | |
| Before resuscitation | 396 ± 13 [52.8 ± 1.8] | 388 ± 26 [51.8 ± 3.5] | 391 ± 41 [52.1 ± 5.5] | |
| After resuscitation | 443 ± 14 [59.0 ± 1.9] | 439 ± 27 [58.6 ± 3.6] | 476 ± 20 [63.4 ± 2.7] | |
| 24 hrs after resuscitation | 483 ± 21 [64.3 ± 2.9] | 464 ± 21 [61.8 ± 2.8] | 410 ± 40 [54.6 ± 5.3] | 473 ± 16 [63.1 ± 2.1] |
| Partial carbon dioxide pressure, Pco2 (torr, [kPa]) | ||||
| Before hemorrhage | 42 ± 3 [5.6 ± 0.4] | 38 ± 2 [5.1 ± 0.3] | 40 ± 3 [5.3 ± 0.3] | 42 ± 2 [5.6 ± 0.3] |
| After hemorrhage | 25 ± 1† [3.4 ± 0.2] | 24 ± 1† [3.2 ± 0.1] | 26 ± 2† [3.5 ± 0.2] | |
| Before resuscitation | 24 ± 2† [3.3 ± 0.3] | 23 ± 2† [3.0 ± 0.3] | 24 ± 3† [3.2 ± 0.4] | |
| After resuscitation | 36 ± 2 [4.7 ± 0.2] | 37 ± 2 [5.0 ± 0.3] | 37 ± 3 [5.0 ± 0.3] | |
| 24 hrs after resuscitation | 47 ± 2 [6.3 ± 0.3] | 49 ± 4† [6.5 ± 0.5] | 45 ± 3 [6.0 ± 0.4] | 52 ± 3† [6.9 ± 0.4] |
| pH | ||||
| Before hemorrhage | 7.35 ± 0.01 | 7.39 ± 0.01 | 7.37 ± 0.01 | 7.36 ± 0.02 |
| After hemorrhage | 7.36 ± 0.01 | 7.38 ± 0.02 | 7.38 ± 0.02 | |
| Before resuscitation | 7.24 ± 0.04† | 7.31 ± 0.02 | 7.31 ± 0.02 | |
| After resuscitation | 7.19 ± 0.03† | 7.26 ± 0.02† | 7.26 ± 0.02† | |
| 24 hrs after resuscitation | 7.36 ± 0.02 | 7.31 ± 0.05 | 7.40 ± 0.01 | 7.34 ± 0.02 |
| Base Excess, BE (mmol/L) | ||||
| Before hemorrhage | −1.2 ± 1.8 | −2.5 ± 0.9 | −2.0 ± 1.5 | −2.2 ± 1.1 |
| After hemorrhage | - | −11.3 ± 0.6† | −10.8 ± 0.7† | −9.6 ± 1.0† |
| Before resuscitation | −16.8 ± 1.3† | −14.8 ± 1.3† | −14.3 ± 1.7† | |
| After resuscitation | −14.4 ± 1.2† | −10.5 ± 1.1†, # | −10.3 ± 1.1†, # | |
| 24 hrs after resuscitation | 4.2 ± 0.9† | −1.3 ± 3.1 | 2.1 ± 1.5 | 3.7 ± 1.5† |
| Bicarbonate, HCO3− (mmol/L) | ||||
| Before hemorrhage | 24.5 ± 0.8 | 22.5 ± 0.9 | 23.2 ± 1.4 | 23.3 ± 1.0 |
| After hemorrhage | 14.1 ± 0.6† | 14.3 ± 0.5† | 15.4 ± 0.9 | |
| Before resuscitation | 10.5 ± 0.8† | 11.4 ± 1.2† | 12.0 ± 1.6 | |
| After resuscitation | 13.8 ± 0.8† | 16.6 ± 0.8†, # | 16.7 ± 1.0†, # | |
| 24 hrs after resuscitation | 29.6 ± 1.1† | 25.0 ± 1.9 | 26.6 ± 1.5 | 29.4 ± 1.4† |
| Total carbon-dioxide, TCO2 (mmol/L) | ||||
| Before hemorrhage | 25.9 ± 0.9 | 23.7 ± 0.9 | 24.4 ± 1.5 | 24.6 ± 1.1 |
| After hemorrhage | 14.9 ± 0.6† | 15.1 ± 0.5† | 16.3 ± 0.9† | |
| Before resuscitation | 11.2 ± 0.8† | 12.1 ± 1.2† | 12.7 ± 1.7† | |
| After resuscitation | 14.9 ± 0.8† | 17.8 ± 0.9†, # | 17.9 ± 1.0†, # | |
| 24 hrs after resuscitation | 31.2 ± 1.2† | 26.5 ± 1.9 | 27.9 ± 1.6 | 31.1 ± 1.5† |
| Lactate (mmol/L) | ||||
| Before hemorrhage | 0.6 ± 0.1 | 0.7 ± 0.1 | 0.7 | 0.8 ± 0.2 |
| After hemorrhage | - | 5.1 ± 0.3† | 4.4 ± 0.3† | 4.1 ± 0.5† |
| Before resuscitation | - | 6.6 ± 0.5† | 5 ± 0.6† | 4.8 ± 0.6† |
| After resuscitation | - | 3 ± 0.7† | 1.1 ± 0.2# | 1.1 ± 0.4# |
| 24 hrs after resuscitation | 1 ± 0.1† | 1.1 ± 0.2 | 0.9 ± 0.2 | 1 ± 0.1 |
| Glucose (mmol/L) | ||||
| Before hemorrhage | 5.6 ± 0.5 | 5.1 ± 1.1 | 5.6 ± 0.6 | 6.0 ± 0.6 |
| After hemorrhage | - | 4.9 ± 1.4 | 5.2 ± 0.9 | 5.0 ± 0.5 |
| Before resuscitation | - | 2.6 ± 1.5† | 5.8 ± 1.2# | 3.5 ± 0.7† |
| After resuscitation | - | 4.4 ± 2.2 | 8.0 ± 0.8# | 5.9 ± 0.6 |
| 24 hrs after resuscitation | 10.4 ± 0.2† | 8.0 ± 2.5†, * | 6.9 ± 0.7* | 8.9 ± 0.6† |
| Sodium, Na+ (mmol/L) | ||||
| Before hemorrhage | 141 ± 1 | 142 ± 1 | 143 ± 1 | 141 ± 1 |
| After hemorrhage | 138 ± 1 | 141 ± 1 | 139 ± 1 | |
| Before resuscitation | 138 ± 1† | 141 ± 2 | 142 ± 2 | |
| After resuscitation | 140 ± 1 | 140 ± 1 | 140 ± 1 | |
| 24 hrs after resuscitation | 139 ± 1 | 145 ± 1* | 144 ± 1* | 143 ± 1* |
| Potassium, K+ (mmol/L) | ||||
| Before hemorrhage | 3.8 ± 0.2 | 3.7 ± 0.2 | 4.1 ± 0.1 | 4.2 ± 0.3 |
| After hemorrhage | 5.9 ± 0.2† | 5.5 ± 0.3† | 6.0 ± 0.3† | |
| Before resuscitation | 5.2 ± 0.3† | 4.7 ± 0.4 | 4.7 ± 0.3 | |
| After resuscitation | 4.5 ± 0.4 | 4.6 ± 0.2 | 4.2 ± 0.2 | |
| 24 hrs after resuscitation | 3.9 ± 0.1 | 3.9 ± 0.4 | 3.6 ± 0.3 | 4.0 ± 0.1 |
| Calcium, Ca2+ (mmol/L) | ||||
| Before hemorrhage | 1.02 ± 0.04 | 1.00 ± 0.05 | 1.06 ± 0.08 | 1.06 ± 0.06 |
| After hemorrhage | 1.08 ± 0.04 | 1.00 ± 0.07 | 1.08 ± 0.07 | |
| Before resuscitation | 0.81 ± 0.04† | 0.88 ± 0.07 | 0.81 ± 0.07† | |
| After resuscitation | 0.72 ± 0.05† | 0.88 ± 0.07 | 0.80 ± 0.07† | |
| 24 hrs after resuscitation | 1.08 ± 0.05 | 0.97 ± 0.08 | 1.02 ± 0.06 | 1.13 ± 0.04 |
| Hematocrit, Htc | ||||
| Before hemorrhage | 39 ± 1 | 38 ± 1 | 38 ± 1 | 40 ± 1 |
| After hemorrhage | 31 ± 1† | 31 ± 1† | 31 ± 1† | |
| Before resuscitation | 27 ± 1† | 27 ± 2† | 28 ± 1† | |
| After resuscitation | 18 ± 1† | 19 ± 1† | 18 ± 1† | |
| 24 hrs after resuscitation | 38 ± 1 | 19 ± 2†, * | 17 ± 1†,* | 19 ± 1†,* |
Arterial blood samples were analyzed: before induction of hemorrhage (baseline), after hemorrhage, before resuscitation, at the end of resuscitation and 24 hrs after resuscitation. Data are expressed as mean ± sem, n≥9 in each group. ANOVA, p < 0.05 vs. Sham
p < 0.05 vs. Control in comparison between treatment groups
p < 0.05 compared to the baseline conditions in the same group.
There were no significant differences in blood glucose levels in any group at the end of hemorrhage; however, blood glucose levels were significantly elevated in glucosamine group before and after resuscitation. Additionally, there were no differences in glucose levels between PUGNAc and Control groups at any time point in the experiments.
Serum cytokine levels
Hemorrhagic shock induced a significant increase in circulating levels of pro-inflammatory cytokine IL-6, 24 hours after resuscitation in the Control group, which was significantly attenuated by PUGNAc, but not glucosamine (Fig. 2A). Compared to the Sham group, the anti-inflammatory cytokine IL-10 was significantly elevated in the Control group; however, IL-10 was unchanged in both glucosamine and PUGNAc groups (Fig. 2B). Compared to the Sham group, there were no significant differences in the serum levels of TNF-α in any group, 24 hours after TH-R (data not shown).
Fig. 2. Serum cytokine levels of A) Interleukin (IL) -6 and B) IL-10 24 hours after hemorrhagic shock and resuscitation.
Data are expressed as mean ± SEM, n>9 in each group. Panel A): ANOVA, * p<0.05 Vs Sham and# p<0.05 Vs Control. Panel B): ANOVA (trend to significance, overall p=0.08),‡ p<0.05 Vs Sham.
NF-κB activation and iNOS levels
Activation of the transcription factor NF-κB was assessed by DNA-binding assay in the heart, lung and liver. In the liver, the binding affinity of NF-κB was significantly elevated in both Control and Glucosamine groups, 24 hours after TH-R; however, this was significantly attenuated in the PUGNAc group (Fig. 3). There was no significant activation of NF-κB in either heart or lung (data not shown).
Fig. 3. Activation of Nuclear Factor kappa-B (NF-κB) in the Liver 24 hours after hemorrhagic shock and resuscitation, related to Sham animals.
Data are expressed as mean ± SEM, n=6 in each group. ANOVA, * p<0.05 Vs Sham and# p<0.05 Vs Control.
In the Control group, protein levels of iNOS were significantly increased compared to Sham surgery group in both liver and heart (Fig. 4A, B). This was significantly attenuated in the PUGNAc treated group, but not in the glucosamine treated group. However, at this time-point, there was no significant induction of iNOS expression in the lung (data not shown).
Fig. 4. Protein levels of inducible Nitric Oxide Synthase (iNOS) in the A) Heart and B) Liver 24 hours after hypovolemic shock and resuscitation on the upper side.
Bar charts on the lower side represent the mean area densities, related to Sham animals. Mean densities were normalized to calsequestrin (Cals) staining in the heart and the β-actin staining in the liver. Data are mean ± SEM, n=6 in each group. ANOVA, * p<0.05 Vs Sham and# p<0.05 Vs Control.
Myeloperoxidase (MPO) levels
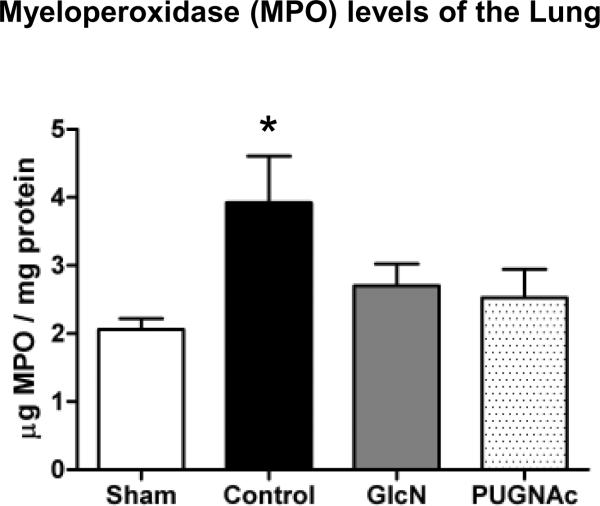
Tissue MPO levels were significantly elevated in the Control animals in the lung 24 hours after TH-R, compared to Sham operated animals (Fig. 5). However, neither Glucosamine nor PUGNAc treated groups showed significant elevation in MPO levels compared to Shams. In the heart and in the liver, there were no significant changes in the tissue MPO levels at this time-point (data not shown). It should be noted that while increased MPO levels reflects neutrophil accumulation and is an important component in the inflammatory response, it does not on its own indicate an excessive inflammation.
Fig. 5. Myeloperoxidase (MPO) levels of the Lung 24 hours after trauma-hemorrhage.
Data are expressed as mean ± SEM, n≥3 in each group. ANOVA, * p<0.05 Vs Sham.
Organ injury and apoptosis
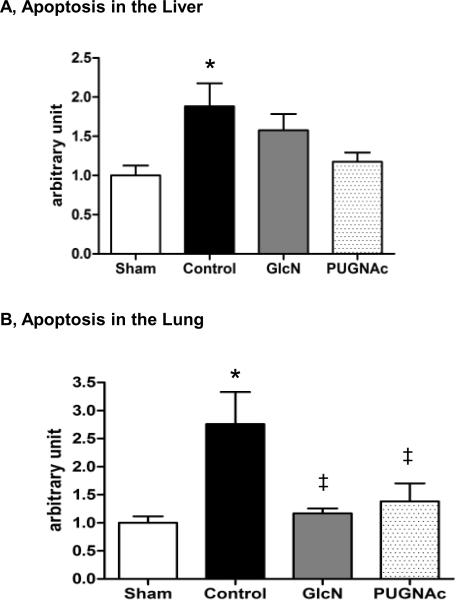
Serum levels of alanine aminotransferase (ALT), aspartate aminotransferase (AST) and lactate dehydrogenase (LDH) were significantly increased in response to TH-R, while these were significantly attenuated by PUGNAc, but not Glucosamine treatment (Fig. 6A–C). Indicators of pancreas (amylase) and kidney (creatinine / BUN) injury did not show significant changes at this time point in any group compared to Shams (data not shown). In the liver, there was an almost 2-fold increase of apoptosis in the Control group compared to the Sham group (Fig. 7A); however, neither Glucosamine, nor PUGNAc groups were significantly different from either the Sham or Control animals. In the lung, there was ~2.8 fold increase in apoptosis in the Control group compared to Sham group and this was attenuated in both Glucosamine and PUGNAc groups (Fig. 7B). In the heart, there was no significant change in apoptosis in any group compared to Shams (data not shown).
Fig. 6. Serum levels of A) Alanine Transaminase (ALT), B) Aspartate Transaminase (AST) and C) Lactate Dehydrogenase (LDH) 24 hours after hypovolemic shock and resuscitation.
Data are mean ± SEM, n>4 in each group. ANOVA, * p<0.05 Vs Sham and# p<0.05 Vs Control.
Fig. 7. Apoptosis in the A) Liver and B) Lung 24 hours after trauma-hemorrhage and resuscitation, related to Sham animals.
Data are mean ± SEM, n≥3 in each group. Panel A) Liver: ANOVA, * p<0.05 Vs Sham. Panel B) Lung: ANOVA (overall p<0.05), * p<0.05 Vs Sham,‡ p<0.1 Vs Control (p=0.06 GlcN Vs Control and p=0.08 PUGNAc Vs Control).
Endoplasmic reticulum stress
GRP78 (glucose regulated protein) is a member of the heat shock protein family and an important indicator of endoplasmic reticulum stress (20). To evaluate the effects of TH-R and the treatment protocols on ER stress, we assessed GRP78 levels in the liver, since of those organs studied, the liver appeared to be the most susceptible organ to injury and ER-stress. Here we found that there was no significant elevation of GRP78 (Bip) protein in the Control or any of treatment groups compared to Shams, 24 hours after TH-R (Fig. 8). Although, we cannot rule out the possibility of altered GRP78 levels at an earlier time-point.
Fig. 8. GRP78 protein levels in the Liver, 24 hours after trauma-hemorrhage and resuscitation.
A) GRP78 representative blot shows two-two selected samples of each group. B) Bar charts represent the mean area densities, related to Sham animals. Mean densities were normalized to β-actin staining. Data are mean ± SEM, n=7 in each group. ANOVA, p>0.05.
Protein O-GlcNAc and phosphorlyation levels
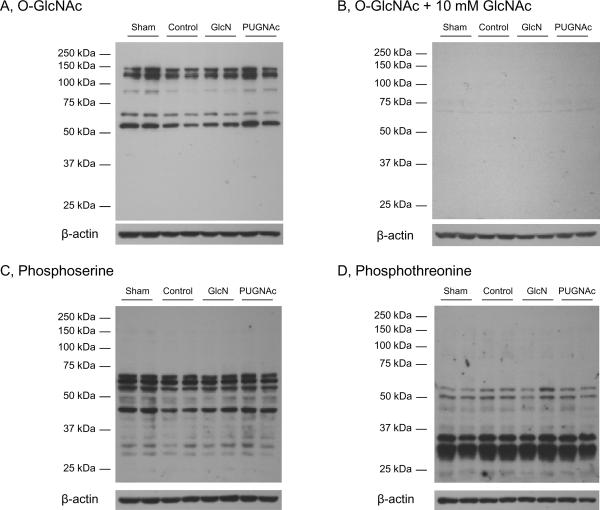
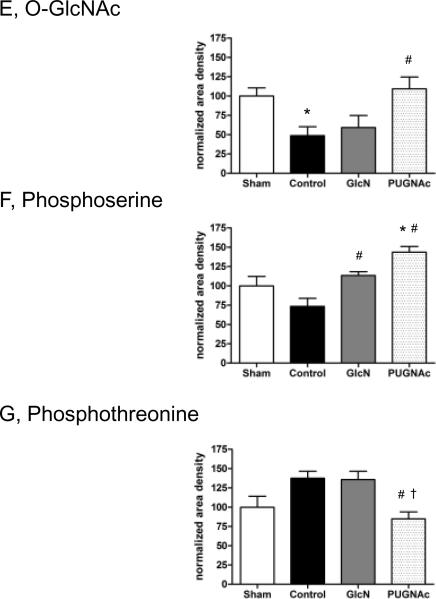
In the liver, there was a significant, >50% decrease in overall O-GlcNAc levels 24 hours after TH-R, compared to the Sham group. PUGNAc treatment resulted in significantly elevated O-GlcNAc levels, compared to Control animals. However, glucosamine administration did not prevent the loss of O-GlcNAc (Fig. 9/A, E). To demonstrate the specificity of the O-GlcNAc antibody, a duplicate immunoblot was co-incubated with CTD 110.6 antibody and 10 mM N-acetylglucosamine (Fig 9/B) (21, 22). Since N-acetylglucosamine acts competitively for specific binding, the lack of signal on Fig 9/B indicates that the signal on Fig 9/A is due to specific binding of CTD 110.6 antibody.
Fig. 9. O-GlcNAcylation and phosphorylation in the Liver tissue extracts 24 hours after hypovolemic shock and resuscitation.
Tissue samples were separated on 10% gels. Membranes were incubated with A) O-GlcNAc (CTD 110.6) antibody, B) O-GlcNAc antibody + 10 mM GlcNAc, C) Phosphoserine or D) Phosphothreonine antibodies. The representative blots show two-two selected samples of each group. Bar charts represent the mean area densities of E) O-GlcNAc, F) Phosphoserine and G) Phosphothreonine immunoblots, related to Sham animals. Mean densities were normalized to β-actin staining. Data are shown on bar charts as mean ± SEM, n=7 in each group. ANOVA, * p<0.05 Vs Sham,# p<0.05 Vs Control and† p<0.05 Vs GlcN group.
Furthermore, protein O-GlcNAc levels showed a significant negative correlation with indicators of tissue injury: ALT (r=−0.71, p<0.05), AST (r=−0.75, p<0.05), LDH (r=−0.76, p<0.05) and apoptosis (r=−0.63, p<0.05). There was also a modest, but significant correlation between O-GlcNAc levels at 24 hours and lactate levels (r=−0.54, p<0.05) measured at the end of resuscitation (data not shown).
To determine whether there was a relationship between changes in global O-GlcNAc and phosphorylation levels, we examined both serine and threonine phosphorylation. Phosphorylation of serine residues was significantly elevated in both Glucosamine and PUGNAc treated groups compared to Controls; in PUGNAc group, serine phosphorylation was also significantly increased compared to the Sham group (Fig. 9/C, F). In contrast, threonine phosphorylation of liver proteins was significantly decreased in PUGNAc group, compared to both Control and Glucosamine treated animals (Fig. 9/D, G).
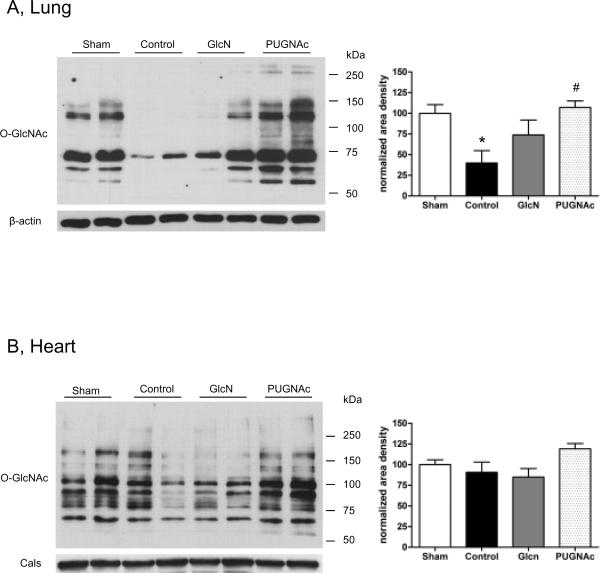
In the lung, we a found a significant decrease in tissue protein O-GlcNAcylation levels in response to TH-R. Similarly to the liver, it was prevented by PUGNAc, but not glucosamine treatment (Fig. 10/A). The protein O-GlcNAc changes followed a similar pattern in the heart, however, these changes were not significantly different (ANOVA, p=0.07) (Fig. 10/B).
Fig. 10. O-GlcNAcylation in the Lung and Heart 24 hours after hypovolemic shock and resuscitation.
Left panel: Samples were separated on 7% gels. Membranes containing A) Lung and B) Heart tissue extracts were incubated with O-GlcNAc (CTD 110.6) antibody. The representative blots show two-two selected samples of each group. Right panel: Bar charts represent the mean area densities, related to Sham animals. Mean densities were normalized to β-actin or calsequestrine (Cals) staining. Data are mean ± SEM, n≥3 in each group. Lung: ANOVA, * p<0.05 Vs Sham and# p<0.05 Vs Control group. Heart: ANOVA, p=0.07.
DISCUSSION
Trauma related MODS is a later complication of severe injuries and is associated with high incidence (11.4%) and a particularly high mortality (61%) (23). To date, despite the encouraging results of animal experiments, only a few metabolic interventions have been successful in prospective human trials (24). Here we have demonstrated that enhancing O-GlcNAc levels by either increasing substrate availability with glucosamine or by inhibiting degradation with PUGNAc markedly improved 24 hour survival following severe trauma-hemorrhage and resuscitation in rats. While both treatments improved survival, only PUGNAc attenuated the hemorrhagic shock-induced pro-inflammatory responses and end organ injury.
The mortality rate of our severe trauma-hemorrhage model is comparable with that observed in the “two-hit” model of TH followed by sepsis as well zymosan-induced MODS models (19, 25). Thus, the model described here recapitulates many of the early events associated with MODS. Of particular significance, we found that both glucosamine and PUGNAc administration improved survival rates (85% and 86%, respectively) compared to untreated Control animals (53%). Since the majority of deaths occurred over the first 6 hours (Fig. 1), the increased survival and improved blood gas parameters in the treatment groups was most likely a consequence of an early protective effect.
In contrast to the notion of stress induced hyperglycemia, blood glucose levels were unchanged at the end of hemorrhage and were actually decreased below baseline prior to resuscitation in Control and PUGNAc groups; however, this is most likely due to the fact that all animals were subjected to 24 hours food deprivation before TH-R (5). While it is of potential interest that hypoglycemia was not observed in the glucosamine treated group; it should be noted that this metabolic difference did not appear to influence 24 hour outcome measures. In contrast with the improved survival and early beneficial effects on blood gas parameters in both treatment groups; PUGNAc, but not glucosamine prevented the majority of pro-inflammatory responses and attenuated the development of organ injury at the 24 hour time point. Further support for the anti-inflammatory effects of increased O-GlcNAcylation, Xing D. et al have recently demonstrated that acute glucosamine and PUGNAc treatment reduced inflammatory response in balloon-injured rat carotid arteries (26). We have also shown at the cellular level that both glucosamine and increased OGT expression significantly attenuated LPS induced activation of NF-κB (27).
Overall O-GlcNAc levels were markedly decreased in the lung and liver 24 hours after TH-R, while PUGNAc administration resulted in maintained O-GlcNAc levels (Fig. 9–10). In our previous studies, O-GlcNAcylation of heart, liver and kidney showed a marked, >50% decrease, 2 hours after TH-R, and these changes were prevented by PUGNAc administration (11). Importantly, treatment with the same dose of glucosamine used in this study resulted in significantly higher O-GlcNAc levels at the 2 hours time-point, compared to the Controls (12, 27). Notably, O-GlcNAc modification occurs on Ser / Thre residues of proteins, similarly to phosphorylation (1, 8). While certain proteins are targeted exclusively by O-GlcNAcylation or phosphorylation, they are likely to exist in all possible combinations in a complex cellular environment (9). In our experiments, in the liver, O-GlcNAcylation levels changed in parallel with serine phosphorylation, but were reciprocal to threonine phosphorylation following TH-R.
While the loss of O-GlcNAc levels following resuscitation is consistent with our previous studies (1, 8), it appears to contradict the notion that increased O-GlcNAc formation is a stress-induced response. However, studies have shown that O-GlcNAc levels increase relatively rapidly in response to ischemia and hypoxia, followed by a later decrease during reperfusion (28, 29). It is also possible that a stress-induced increase in O-GlcNAc levels correlate with cell survival. For example, it has recently been reported that lethal oxidative stress caused time-dependent loss of O-GlcNAc, synchronously with the loss of mitochondrial membrane potential in primary cardiomyocytes (30). We have previously shown that the glucosamine induced increase of O-GlcNAcylation correlated with cell survival after ischemia-reperfusion in isolated neonatal cardiac myocytes (29, 31). In addition, Liu et al have demonstrated a correlation between O-GlcNAc levels and the degree of tissue injury in isolated perfused hearts, following ischemia/reperfusion (32). In our current study, we found the agonist induced increase in O-GlcNAc levels negatively correlates with indicators of tissue injury, apoptosis and serum lactate level after TH-R.
One limitation of this study is that all biochemical parameters were evaluated at a single time-point. However, it should be noted that the early beneficial effects of increasing O-GlcNAc levels following TH-R, which included improved cardiac function, decreased inflammatory response and attenuated NF-κB signaling, have previously been demonstrated in a comparable TH-R model with the same doses of glucosamine and PUGNAc (11, 12, 27). It is also important to note, that evaluation of tissue myeloperoxidase levels used in this study indicates only increased neutrophil infiltration, and not necessarily and excessive inflammation. To demonstrate a direct cause-effect relationship between increased O-GlcNAc levels and survival the use transgenic animals could be valuable. However, OGT gene deletion is embryonically lethal (33), and OGT overexpression induces insulin resistance (34). Tissue specific conditional transgenic animals or acute adenoviral mediated enzyme delivery are potential alternative approaches; however, as hypovolemic shock affects all vital organs, it is unclear at this time which tissues or organs should be targeted. Additionally, there is also a possibility for non-specific effects of PUGNAc, as it has the potential to inhibit lysosomal ß-hexosaminidases and α-N-acetylglucosaminidases in addition to O-GlcNAcase. New, more selective OGT inhibitors (NAG-thiazolines) have been recently synthesized, and provide a more specific approach for future studies (35). However, we have found that PUGNAc and NAG-thiazolines exhibited similar protective effects at the cellular level (31).
Glucosamine also increases glucosamine-6-phosphate and UDP-GlcNAc levels, consequently its protective effect could be mediated via a number of pathways other than increased O-GlcNAcylation. Glucosamine has also been shown to induce ER stress (36). This raises the possibility that glucosamine could lead to induction of a cellular stress response that induces a “pre-“ or “post-conditioning” effect, which leads to protection rather than a consequence of increased O-GlcNAc formation. Therefore, we evaluated GRP78 levels as a marker of ER stress and found that TH-R, glucosamine or PUGNAc treatment did not have any effect on GRP78 24 hours following resuscitation. This does not rule out the possibility that the protective effects of glucosamine could be mediated via other pathways including activation of ER stress response; however, it should be noted, that at the cellular level, both OGT overexpression and glucosamine treatment have similar effects in protecting against ischemia/reperfusion injury and pro-inflammatory stimuli (27, 31).
It should be noted that to reduce variability and to ensure consistency with earlier studies, animals were anesthetized and received supplemented O2 until the end of resuscitation (10, 13). This is similar to a civilian setting, where anesthesia, oxygen therapy and temperature control are vital parts of treatment provided in ICU/ER after multiple injury and significant blood loss. However, such interventions are not readily available in remote or battlefield settings; consequently, future studies that more closely mimic such conditions may be warranted. Furthermore, consistent with a number of experimental models of hemorrhagic shock and resuscitation, normal saline (NS) was used as the resuscitation fluid (37, 38), instead of lactated Ringer's solution. However, recent studies have reported that infusion of lactated Ringer's leads to greater hypercoagulability and less hyperchloremic acidosis, than NS (39, 40); therefore, we cannot rule out the possibility that lactated Ringer's may have improved the outcomes across all TH-R groups compared to NS. In addition, administration of NS in large volumes can also affect the acid-base balance, which could limit the interpretation of blood gas analyses in this study. However, it should be emphasized that the same volume of normal saline was administered to all groups (except Sham operated animals); therefore, the potential adverse effects resulting from the use of NS will be the same in all TH-R groups. Consequently, we believe it is unlikely that the use of NS as the resuscitation fluid would negate the clinically relevant conclusion of this study that increasing O-GlcNAcylation under conditions of severe hypovolemic shock improves survival and decreases tissue injury.
Conclusion
This study suggests that interventions designed to increase protein O-GlcNAc levels may represent a valuable novel approach for the treatment of hemorrhagic shock. Furthermore, increasing protein O-GlcNAc levels may also help to prevent the development of SIRS and the resulting MODS, decreasing the mortality of severe injuries.
Acknowledgments
We would like to thank to Sue A Marsh, PhD, (Division of Cardiovascular Disease, Department of Medicine, University of Alabama at Birmingham) for her help in statistical analysis. In addition, the anti-O-GlcNAc antibody, CTD 110.6 was a kind gift from Mary Ann Accavitti, Epitope Recognition and Immunodetection Facility, University of Alabama at Birmingham. This study was supported by NIH grant HL076165.
Financial support: This study was supported by NIH grant HL076165.
Footnotes
All other authors have no potential conflicts of interest to disclose.
REFERENCES
- 1.Chatham JC, Not LG, Fulop N, et al. Hexosamine biosynthesis and protein O-glycosylation: the first line of defense against stress, ischemia, and trauma. Shock. 2008;29:431–440. doi: 10.1097/shk.0b013e3181598bad. [DOI] [PubMed] [Google Scholar]
- 2.Mizock BA. Alterations in fuel metabolism in critical illness: hyperglycaemia. Best Pract Res Clin Endocrinol Metab. 2001;15:533–551. doi: 10.1053/beem.2001.0168. [DOI] [PubMed] [Google Scholar]
- 3.Jarhult J. Osmotic fluid transfer from tissue to blood during hemorrhagic hypotension. Acta Physiol Scand. 1973;89:213–226. doi: 10.1111/j.1748-1716.1973.tb05514.x. [DOI] [PubMed] [Google Scholar]
- 4.Ware J, Ljungqvist O, Norberg KA, et al. Osmolar changes in haemorrhage: the effects of an altered nutritional status. Acta Chir Scand. 1982;148:641–646. [PubMed] [Google Scholar]
- 5.Nettelbladt CG, Alibergovic A, Ljungqvist O. Pre-stress carbohydrate solution prevents fatal outcome after hemorrhage in 24-hour food-deprived rats. Nutrition. 1996;12:696–699. doi: 10.1016/s0899-9007(96)00165-7. [DOI] [PubMed] [Google Scholar]
- 6.Atiyeh BS, Gunn SW, Dibo SA. Metabolic Implications of Severe Burn Injuries and Their Management: A Systematic Review of the Literature. World J Surg. 2008 doi: 10.1007/s00268-008-9587-8. [DOI] [PubMed] [Google Scholar]
- 7.Finney SJ, Zekveld C, Elia A, et al. Glucose control and mortality in critically ill patients. Jama. 2003;290:2041–2047. doi: 10.1001/jama.290.15.2041. [DOI] [PubMed] [Google Scholar]
- 8.Laczy B, Hill BG, Wang K, et al. Protein O-GlcNAcylation: a new signaling paradigm for the cardiovascular system. Am J Physiol Heart Circ Physiol. 2009;296:H13–28. doi: 10.1152/ajpheart.01056.2008. [DOI] [PMC free article] [PubMed] [Google Scholar]
- 9.Comer FI, Hart GW. O-Glycosylation of nuclear and cytosolic proteins. Dynamic interplay between O-GlcNAc and O-phosphate. J Biol Chem. 2000;275:29179–29182. doi: 10.1074/jbc.R000010200. [DOI] [PubMed] [Google Scholar]
- 10.Not LG, Marchase RB, Fulop N, et al. Glucosamine administration improves survival rate after severe hemorrhagic shock combined with trauma in rats. Shock. 2007;28:345–352. doi: 10.1097/shk.0b013e3180487ebb. [DOI] [PubMed] [Google Scholar]
- 11.Zou L, Yang S, Hu S, et al. The protective effects of PUGNAc on cardiac function after trauma-hemorrhage are mediated via increased protein O-GlcNAc levels. Shock. 2007;27:402–408. doi: 10.1097/01.shk.0000245031.31859.29. [DOI] [PubMed] [Google Scholar]
- 12.Yang S, Zou LY, Bounelis P, et al. Glucosamine administration during resuscitation improves organ function after trauma hemorrhage. Shock. 2006;25:600–607. doi: 10.1097/01.shk.0000209563.07693.db. [DOI] [PubMed] [Google Scholar]
- 13.Macias CA, Kameneva MV, Tenhunen JJ, et al. Survival in a rat model of lethal hemorrhagic shock is prolonged following resuscitation with a small volume of a solution containing a drag-reducing polymer derived from aloe vera. Shock. 2004;22:151–156. doi: 10.1097/01.shk.0000131489.83194.1a. [DOI] [PubMed] [Google Scholar]
- 14.Hauptman JG, DeJong GK, Blasko KA, et al. Measurement of hepatocellular function, cardiac output, effective blood volume, and oxygen saturation in rats. Am J Physiol. 1989;257:R439–444. doi: 10.1152/ajpregu.1989.257.2.R439. [DOI] [PubMed] [Google Scholar]
- 15.Nagy T, Champattanachai V, Marchase RB, et al. Glucosamine inhibits angiotensin II-induced cytoplasmic Ca2+ elevation in neonatal cardiomyocytes via protein-associated O-linked N-acetylglucosamine. Am J Physiol Cell Physiol. 2006;290:C57–65. doi: 10.1152/ajpcell.00263.2005. [DOI] [PubMed] [Google Scholar]
- 16.Salgame P, Varadhachary AS, Primiano LL, et al. An ELISA for detection of apoptosis. Nucleic Acids Res. 1997;25:680–681. doi: 10.1093/nar/25.3.680. [DOI] [PMC free article] [PubMed] [Google Scholar]
- 17.Trautwein C, Rakemann T, Brenner DA, et al. Concanavalin A-induced liver cell damage: activation of intracellular pathways triggered by tumor necrosis factor in mice. Gastroenterology. 1998;114:1035–1045. doi: 10.1016/s0016-5085(98)70324-5. [DOI] [PubMed] [Google Scholar]
- 18.Zhu X, Zhao H, Graveline AR, et al. MyD88 and NOS2 are essential for toll-like receptor 4-mediated survival effect in cardiomyocytes. Am J Physiol Heart Circ Physiol. 2006;291:H1900–1909. doi: 10.1152/ajpheart.00112.2006. [DOI] [PubMed] [Google Scholar]
- 19.Szalay L, Shimizu T, Suzuki T, et al. Androstenediol administration after trauma-hemorrhage attenuates inflammatory response, reduces organ damage, and improves survival following sepsis. Am J Physiol Gastrointest Liver Physiol. 2006;291:G260–266. doi: 10.1152/ajpgi.00390.2005. [DOI] [PubMed] [Google Scholar]
- 20.Lee AS. The ER chaperone and signaling regulator GRP78/BiP as a monitor of endoplasmic reticulum stress. Methods. 2005;35:373–381. doi: 10.1016/j.ymeth.2004.10.010. [DOI] [PubMed] [Google Scholar]
- 21.Comer FI, Vosseller K, Wells L, et al. Characterization of a mouse monoclonal antibody specific for O-linked N-acetylglucosamine. Anal Biochem. 2001;293:169–177. doi: 10.1006/abio.2001.5132. [DOI] [PubMed] [Google Scholar]
- 22.Kneass ZT, Marchase RB. Neutrophils exhibit rapid agonist-induced increases in protein-associated O-GlcNAc. J Biol Chem. 2004;279:45759–45765. doi: 10.1074/jbc.M407911200. [DOI] [PubMed] [Google Scholar]
- 23.Regel G, Grotz M, Weltner T, et al. Pattern of organ failure following severe trauma. World J Surg. 1996;20:422–429. doi: 10.1007/s002689900067. [DOI] [PubMed] [Google Scholar]
- 24.Keel M, Trentz O. Pathophysiology of polytrauma. Injury. 2005;36:691–709. doi: 10.1016/j.injury.2004.12.037. Review. [DOI] [PubMed] [Google Scholar]
- 25.Di Paola R, Mazzon E, Muia C, et al. Protective effect of Hypericum perforatum in zymosan-induced multiple organ dysfunction syndrome: relationship to its inhibitory effect on nitric oxide production and its peroxynitrite scavenging activity. Nitric Oxide. 2007;16:118–130. doi: 10.1016/j.niox.2006.05.006. [DOI] [PubMed] [Google Scholar]
- 26.Xing D, Feng W, Not LG, et al. Increased protein O-GlcNAc modification inhibits inflammatory and neointimal responses to acute endoluminal arterial injury. Am J Physiol Heart Circ Physiol. 2008;295:H335–342. doi: 10.1152/ajpheart.01259.2007. [DOI] [PMC free article] [PubMed] [Google Scholar]
- 27.Zou L, Yang S, Champattanachai V, et al. Glucosamine improves cardiac function following trauma-hemorrhage by increased protein O-GlcNAcylation and attenuation of NF-{kappa}B signaling. Am J Physiol Heart Circ Physiol. 2009;296:H515–523. doi: 10.1152/ajpheart.01025.2008. [DOI] [PMC free article] [PubMed] [Google Scholar]
- 28.Fulop N, Zhang Z, Marchase RB, et al. Glucosamine cardioprotection in perfused rat hearts associated with increased O-linked N-acetylglucosamine protein modification and altered p38 activation. Am J Physiol Heart Circ Physiol. 2007;292:H2227–2236. doi: 10.1152/ajpheart.01091.2006. [DOI] [PMC free article] [PubMed] [Google Scholar]
- 29.Champattanachai V, Marchase RB, Chatham JC. Glucosamine protects neonatal cardiomyocytes from ischemia-reperfusion injury via increased protein-associated O-GlcNAc. Am J Physiol Cell Physiol. 2007;292:C178–187. doi: 10.1152/ajpcell.00162.2006. [DOI] [PubMed] [Google Scholar]
- 30.Jones SP, Zachara NE, Ngoh GA, et al. Cardioprotection by N-acetylglucosamine linkage to cellular proteins. Circulation. 2008;117:1172–1182. doi: 10.1161/CIRCULATIONAHA.107.730515. [DOI] [PubMed] [Google Scholar]
- 31.Champattanachai V, Marchase RB, Chatham JC. Glucosamine protects neonatal cardiomyocytes from ischemia-reperfusion injury via increased protein O-GlcNAc and increased mitochondrial Bcl-2. Am J Physiol Cell Physiol. 2008;294:C1509–1520. doi: 10.1152/ajpcell.00456.2007. [DOI] [PMC free article] [PubMed] [Google Scholar]
- 32.Liu J, Marchase RB, Chatham JC. Glutamine-induced protection of isolated rat heart from ischemia/reperfusion injury is mediated via the hexosamine biosynthesis pathway and increased protein O-GlcNAc levels. J Mol Cell Cardiol. 2007;42:177–185. doi: 10.1016/j.yjmcc.2006.09.015. [DOI] [PMC free article] [PubMed] [Google Scholar]
- 33.O'Donnell N, Zachara NE, Hart GW, et al. Ogt-dependent X-chromosome-linked protein glycosylation is a requisite modification in somatic cell function and embryo viability. Mol Cell Biol. 2004;24:1680–1690. doi: 10.1128/MCB.24.4.1680-1690.2004. [DOI] [PMC free article] [PubMed] [Google Scholar]
- 34.McClain DA, Lubas WA, Cooksey RC, et al. Altered glycan-dependent signaling induces insulin resistance and hyperleptinemia. Proc Natl Acad Sci U S A. 2002;99:10695–10699. doi: 10.1073/pnas.152346899. [DOI] [PMC free article] [PubMed] [Google Scholar]
- 35.Macauley MS, Whitworth GE, Debowski AW, et al. O-GlcNAcase uses substrate-assisted catalysis: kinetic analysis and development of highly selective mechanism-inspired inhibitors. J Biol Chem. 2005;280:25313–25322. doi: 10.1074/jbc.M413819200. [DOI] [PubMed] [Google Scholar]
- 36.Lehrman MA. Teaching dolichol-linked oligosaccharides more tricks with alternatives to metabolic radiolabeling. Glycobiology. 2007;17:75R–85R. doi: 10.1093/glycob/cwm029. [DOI] [PubMed] [Google Scholar]
- 37.Gurfinkel V, Poggetti RS, Fontes B, et al. Hypertonic saline improves tissue oxygenation and reduces systemic and pulmonary inflammatory response caused by hemorrhagic shock. J Trauma. 2003;54:1137–1145. doi: 10.1097/01.TA.0000064452.37534.29. [DOI] [PubMed] [Google Scholar]
- 38.Claridge JA, Schulman AM, Young JS. Improved resuscitation minimizes respiratory dysfunction and blunts interleukin-6 and nuclear factor-kappa B activation after traumatic hemorrhage. Crit Care Med. 2002;30:1815–1819. doi: 10.1097/00003246-200208000-00024. [DOI] [PubMed] [Google Scholar]
- 39.Kiraly LN, Differding JA, Enomoto TM, et al. Resuscitation with normal saline (NS) vs. lactated ringers (LR) modulates hypercoagulability and leads to increased blood loss in an uncontrolled hemorrhagic shock swine model. J Trauma. 2006;61:57–64. doi: 10.1097/01.ta.0000220373.29743.69. discussion 64–55. [DOI] [PubMed] [Google Scholar]
- 40.Todd SR, Malinoski D, Muller PJ, et al. Lactated Ringer's is superior to normal saline in the resuscitation of uncontrolled hemorrhagic shock. J Trauma. 2007;62:636–639. doi: 10.1097/TA.0b013e31802ee521. [DOI] [PubMed] [Google Scholar]


