

Abstract
This study explores the hypotheses that: (1) ethanol will interact with dl-Methylphenidate (MPH) to enantioselectively elevate plasma d-MPH, and primarily yield l-ethylphenidate as a transesterification metabolite; (2) women will exhibit lower relative bioavailability of MPH than men; and (3) sex-dependent differences in subjective effects will exist. dl-MPH HCl (0.3 mg/kg) was administered orally 30 min before ethanol, 30 min after ethanol (0.6 gm/kg), or without ethanol, in a randomized, normal subject three-way crossover study of 10 men and 10 women. Pharmacokinetic parameters were compared. Subjective effects were recorded using visual analog scales. One subject was a novel poor MPH metabolizer whose data were analyzed separately. Ethanol after or before MPH significantly (P<0.0001) elevated the geometric mean for the maximum d-MPH plasma concentration (Cmax (±SD)) from 15.3 (3.37) ng/ml to 21.5 (6.81) and 21.4 (4.86), respectively, and raised the corresponding geometric mean for the area under the concentration–time curve values from 82.9 (21.7) ng ml/h to 105.2 (23.5) and 102.9 (19.2). l-MPH was present in plasma only at 1–3% of the concentration of d-MPH, except in the poor metabolizer where l-MPH exceeded that of d-MPH. The metabolite l-ethylphenidate frequently exceeded 1 ng/ml in plasma, whereas d-ethylphenidate was detected only in low pg/ml concentrations. Women reported a significantly greater stimulant effect than men when questioned “Do you feel any drug effect?” (P<0.05), in spite of lower mean plasma d-MPH area under the response–time curves in women. Ethanol elevates plasma d-MPH Cmax and area under the concentration–time curve by approximately 40% and 25%, respectively. If the poor metabolizer of MPH proves to be a distinct phenotype, determining the genetic mechanism may be of value for individualizing drug therapy. The more pronounced stimulant effects experienced by women have sex-based abuse liability implications.
The persistence of attention-deficit hyperactivity/disorder (ADHD) into adulthood is increasingly recognized.1 Appropriate drug therapy for an older ADHD population requires a special consideration of lifestyle and life span comorbidity.2 Treatment may be complicated by alcohol use disorder and/or substance use disorder. Both alcohol use disorder and substance use disorder are overrepresented in adult ADHD,3 especially in women.4 dl-Methylphenidate (MPH) (Figure 1) is widely utilized in the treatment of ADHD. The Drug Abuse Warning Network has recorded nearly 15,000 MPH-related emergency department presentations during 1995–2002, and alcohol in combination with drugs in general has risen 63% for ages 18–19 and 100% for ages 45–54 during this period.5 Further, MPH–ethanol coabuse has been widely reported in both annual Drug Abuse Warning Network data5 and the clinical literature.6–8
Figure 1.
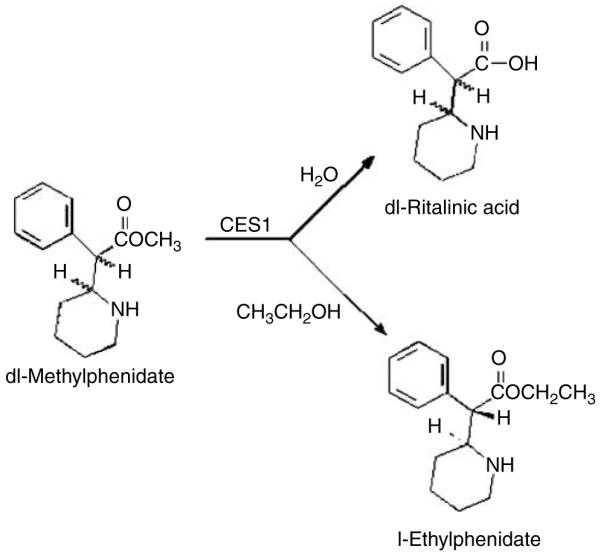
Deesterification of dl-MPH to the primary metabolite ritalinic acid and the enantioselective transesterification pathway to yield l-ethylphenidate.
A metabolic drug interaction between MPH and ethanol was first reported in 1999 by Markowitz et al.,9 who found the transesterification product ethylphenidate (Figure 1) in tissues from two suicide overdoses. The enzymatic pathway yielding ethylphenidate entails the conversion of the methyl ester in MPH into the corresponding ethyl ester and finds precedent in the human metabolic conversion of cocaine and ethanol into cocaethylene.10 A controlled pilot study of the MPH–ethanol interaction has been conducted in six normal volunteers.11 In addition to the primary metabolite ritalinic acid (Figure 1), ethylphenidate was detectable in the subjects’ plasma samples. Further more, MPH plasma concentrations were found to be higher than had been predicted based on the study of MPH without ethanol.12
The present investigation addressed the following questions: (1) What influence does ethanol have on d- and l-MPH concentrations? (2) Is the metabolite ethylphenidate enantioselectively formed, and is it likely to contribute to pharmacological responses? (3) What are the subjective effects of this drug combination, and are there sex differences in this drug interaction?
Because of the disparate pharmacological activities of d-versus l-MPH13 and d-versus l-ethylphenidate,14 establishing enantiomeric concentrations of plasma MPH and ethylphenidate was an essential component of this investigation. Further, the interest in potential sex dimorphisms associated with concomitant MPH and ethanol was of particular interest given the recent findings that the relative oral bioavailability of MPH can be significantly lower in female than in male subjects.15,16
RESULTS
Human subjects
Twenty research subjects (10 men aged 23–40 years: mean (±SD) 28.8 (5.3) years, weight 82.2 (10.5) kg, eight white, one black, one Hispanic; and 10 women aged 23–35 years: mean 28.7 (4.4) years, weight 65.2 (8.4) kg, nine white, one black, completed the entire protocol. One additional subject declined further participation after her first visit, citing discomfort with blood sampling. This subject was replaced with another female volunteer to ensure 10 of each sex completed the study. No adverse events occurred that were attributable to MPH, ethanol, or a combination thereof. All vital signs remained within normal parameters. Finally, no subject had any clinically significant findings on poststudy “exit” laboratory tests.
MPH–ethanol pharmacokinetic interactions
Ethanol, administered 30 min after or 30 min before MPH, resulted in significantly (P<0.0001) elevated d-MPH plasma Cmax (SD%) values (21.5 (6.81) and 21.4 (4.86) ng/ml, respectively, versus 15.3 (3.37) ng/ml without ethanol); and significantly (P<0.0001) elevated area under the concentration–time curve values (105.2 (23.5), and 102.8 (19.2) ng h/ml, respectively, versus 82.9 (21.7) ng/ml without ethanol): Figure 2 and Table 1. When comparing MPH alone (the reference) to ethanol after or before MPH (the tests), the least square geometric mean ratio (90% CI) for the Cmax’s were 1.37 (1.23–1.52) and 1.39 (1.24–1.56), respectively; and for area under the concentration–time curves (AUC) were 1.27 (1.19–1.25) and 1.23 (1.15–1.32), respectively. Mean plasma concentrations of l-MPH reached 0.2 ng/ml without ethanol and approximately 0.6 ng/ml in the two ethanol phases (Figure 3).
Figure 2.
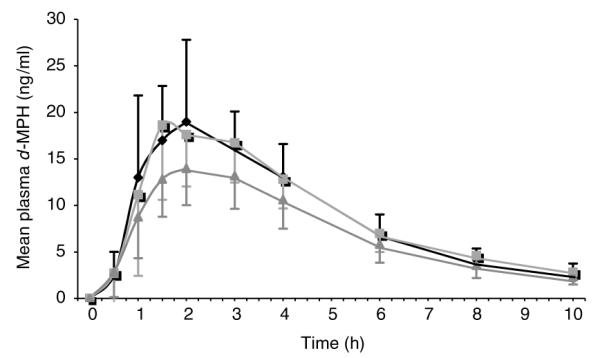
Mean (±SD) d-MPH plasma concentrations after (A) dosing with dl-MPH (0.3 mg/kg) followed by ethanol (0.6 gm/kg; (◆)); (B) dosing with ethanol followed by dl-MPH (■); or (C) dosing with dl-MPH alone (▲). Data from 19 normal MPH metabolizers.
Table 1.
d-MPH arithmetic mean (SD%), least-square geometric mean (90% CI) and geometric mean ratio of pharmacokinetic parameters for normal subjects (n=19) as compared with the poor metabolizer Subject D
| MPH–Ethanol | Ethanol–MPH | MPH | |
|---|---|---|---|
| AUCinf | AUCinf | AUC*inf | |
| Mean (SD%) | 105.2 (22.3)* | 102.8 (18.65)* | 82.9 (26.2) |
| GeoMean ratio | 102.1 | 99.0 | 80.2 (—) |
| GeoMean (90% CI) | 1.27 (1.19–1.35) | 1.23 (1.15–1.32) | — |
| Subject D | 267.6 | 224.2 | 208.7 |
| C max | C max | C max * | |
| Mean (SD%) | 21.5 (31.7)* | 21.4 (22.7)* | 15.3 (22.0) |
| GeoMean ratio | 20.7 | 21.0 | 15.2 (—) |
| GeoMean (90% CI) | 1.37 (1.23–1.52) | 1.39 (1.24–1.56) | — |
| Subject D | 41.0 | 39.4 | 36.7 |
| T max | T max | T max | |
| Mean (SD%) | 2.0 (31.2) | 2.2 (41.5) | 2.3 (32.7) |
| Subject D | 1.5 | 2.0 | 3.0 |
| t 1/2 | t 1/2 | t 1/2 | |
| Mean (SD%) | 3.0 (18.8) | 2.9 (21.5) | 2.8 (14.3) |
| Subject D | 8.2 | 5.0 | 5.4 |
AUCinf, area under the concentration–time curve; CI, confidence interval; CV, coefficient of variance; MPH, methylphenidate; SD, standard deviation. Subjects received MPH (0.3 mg/kg) 30min before ethanol (0.6 g/kg) or the ethanol 30 min before MPH, or only MPH.
Significantly different from test: (P<0.0001).
Figure 3.
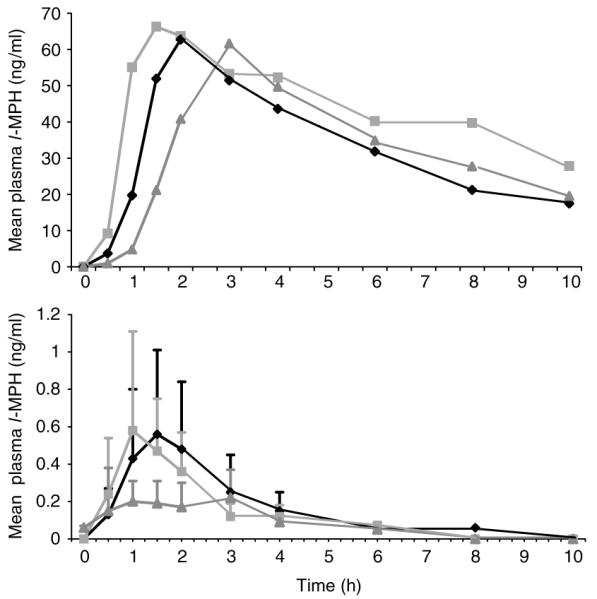
Plasma concentrations of l-MPH in the poor metabolizer (upper profiles) after the following regimens: dl-MPH, then ethanol (◆); ethanol, then dl-MPH (■); dl-MPH only (▲). Corresponding mean (±SD) plasma concentrations for the 19 normal MPH-metabolizers are shown in the lower profile.
Sex differences in d-MPH–ethanol pharmacokinetics
The mean (SD) extent of exposure (AUC) of d-MPH was significantly (P=0.042) greater in men (93.4 (25.3) ng h/ml) than in women (73.5 (12.8)) in the absence of ethanol. Also, the mean AUC in men was significantly (P=0.0336) greater for men when ethanol was administered before dl-MPH: d-MPH was 114 ng hr/ml (23.2) for men, compared with 92.6 ng h/ml (17.3) for women. Additionally, when dl-MPH was dosed before ethanol, the magnitude of the mean differences in d-MPH AUC for men, when compared with women, were comparable to the MPH only and the ethanol-then-MPH schedules. However, in this latter case (MPH-then-ethanol), the sex difference in AUC did not reach statistical significance (P=0.151).
Finally, the mean d-MPH Cmax of 23.2 ng/ml (16.6) in men versus 19.7 ng/ml (26.5) in women, again, nearly reached significance (P=0.063) when ethanol was dosed before dl-MPH.
Novel MPH-poor metabolizer
An MPH-poor metabolizer was identified and represents a previously undocumented phenotype. Plasma concentrations of l-MPH in this male subject were found to be approximately 100 times those of the other 19 subjects (Figure 3). In this individual, the l-MPH Cmax for each phase of the study was between 60 and 70 ng/ml and d-MPH values were greater than 30 ng/ml. The half-life values for d-MPH in the poor metabolizer were also longer than the mean values for the remaining 19 subjects (Table 1). Uniquely, no ethylphenidate was detectable in any of the plasma samples from this individual.
Owing to the extreme differences in the pharmacokinetic parameters for this poor metabolizer relative to the “normals”, the plasma–drug concentration values were not included in the calculations for the mean values of the 19 normal subjects.
Metabolic formation of ethylphenidate
The transesterification metabolite ethylphenidate (Figure 1) was enantioselectivity formed, yielding primarily the inactive l-isomer. In the MPH–ethanol group, the mean Cmax (±SD) for the metabolite l-ethylphenidate was 1.01 (0.98) ng/ml in men and 0.77 (0.48) ng/ml in women, and the Tmax values generally occurred 1–2 h after MPH dosing. In the ethanol–MPH group, l-ethylphenidate reached 0.89 (45) ng/ml in men and 0.55 (0.63) in women 1 h after MPH. The highest single concentration of plasma l-ethylphenidate was 2.7 ng/ml (a male subject). The pharmacologically active d-ethylphenidate, when above the lower limit of quantitation (0.05 ng/ml), rarely exceeded 10% of the Cmax values of l-ethylphenidate. The Tmax values for d-ethylphenidate were typically in the 2–3 h time frame. No ethylphenidate was detectable in: (1) any of the plasma samples from the poor metabolizer; (2) any of the female plasma samples in the ethanol–MPH group; and (3) any of the MPH only group.
Subjective effects
The results shown in Table 2 were compiled as both the mean (SD) peak change in subjective response, as well as the mean (SD) AUC. Mean subjective effects after drug treatments, as recorded through the successive uses of the visual analog subscales, were generally more pronounced in female than in male subjects. Regarding the primary question, “Do you feel any drug effect?”, both the peak change and the AUC were dependent on gender and treatment. Female subjects experienced a stronger subjective response to treatment, as demonstrated by both peak change in response (P=0.036) and AUC (P=0.006). A significant treatment effect was observed for both peak change in response (P=0.0404) and AUC (P=0.023), with lower responses revealed when MPH was administered in the absence of ethanol. Female subjects tended to demonstrate stronger subjective responses than male subjects; MPH, administered in the presence of ethanol, resulted in stronger subjective responses than MPH alone (Table 2).
Table 2.
Mean subjective effects of MPH with or without ethanol evaluated by sex and treatment. Results are from 10 women and nine men found to be “normal” MPH-metabolizers
| Question | Response | Effect | P-value | Mean (SD) |
|---|---|---|---|---|
| Do you feel any drug effect? | Peak change | Treatment | 0.0404 | A*: 6.02 (2.12) |
| B: 5.365 (2.16) | ||||
| C: 3.84 (2.58) | ||||
| Sex | 0.036 | F: 5.72 (2.58) | ||
| M: 4.44 (2.11) | ||||
| AUC | Treatment | 0.023 | A*: 0.32 (0.13) | |
| B: 0.28 (0.16) | ||||
| C: 0.18 (0.12) | ||||
| Sex | 0.0059 | F: 0.31 (0.15) | ||
| M: 0.21 (0.13) | ||||
| How high are you? | Peak change | Treatment | <0.0001 | A*: 5.7 (2.24) |
| B*: 4.9 (2.55) | ||||
| C: 1.68 (2.36) | ||||
| Sex | 0.0178 | F: 4.82 (3.05) | ||
| M: 3.37 (2.65) | ||||
| AUC | Treatment | 0.0004 | A*: 0.29 (0.14) | |
| B*: 0.25 (0.17) | ||||
| C: 0.09 (0.13) | ||||
| Sex | 0.0028 | F: 0.26 (0.18) | ||
| M: 0.15 (0.13) | ||||
| Do the drugs have any good effects? | Peak change | Treatment | 0.006 | A*: 5.77 (2.58) |
| B*: 5.44 (2.60) | ||||
| C: 2.70 (2.48) | ||||
| Sex | 0.1579 | F: 5.1 (3.02) | ||
| M: 4.17 (2.68) | ||||
| AUC | Treatment | 0.016 | A*: 0.32 (0.18) | |
| B: 0.30 (0.19) | ||||
| C: 0.14 (0.14) | ||||
| Sex | 0.1626 | F: 0.29 (0.18) | ||
| M: 0.22 (0.20) | ||||
| How much do you like the drugs? | Peak change | Treatment | 0.0787 | A*: 5.39 (3.08) |
| B: 5.02 (2.76) | ||||
| C: 2.82 (2.64) | ||||
| Sex | 0.2657 | F: 4.82 (3.11) | ||
| M: 4.00 (2.90) | ||||
| AUC | Treatment | 0.1506 | A: 0.31 (0.21) | |
| B: 0.32 (0.23) | ||||
| C: 0.17 (0.18) | ||||
| Sex | 0.8132 | F: 0.28 (0.18) | ||
| M: 0.25 (0.25) | ||||
| How stimulated do you feel? | Peak change | Treatment | 0.2634 | A: 4.70 (2.91) |
| B: 4.80 (2.83) | ||||
| C: 3.03 (2.55) | ||||
| Sex | 0.0581 | F: 5.05 (3.21) | ||
| M: 3.3 (2.13) | ||||
| AUC | Treatment | 0.1897 | A: 0.24 (0.15) | |
| B: 0.24 (0.15) | ||||
| C: 0.15 (0.12) | ||||
| Sex | 0.0021 | F: 0.27 (0.15) | ||
| M: 0.15 (0.10) |
AUC, area under the response–time curve; MPH, methylphenidate; SD, standard deviation. Treatment A: MPH followed by ethanol; treatment B: ethanol followed by MPH; treatment C: MPH without ethanol. Treatments represented by * were significantly different from treatment C using Tukey’s adjustment for multiple comparison.
DISCUSSION
In the study design, ethanol was consumed either before MPH or after MPH administration, owing to the related reports that ethanol elevates plasma cocaine concentrations in a manner influenced by dosing sequence.17,18 Unlike in our previous pilot study,11 an MPH without ethanol phase was also included as a control in this study.
In the pilot study,11 the liquid chromatography–mass spectrometry method was achiral, and hence, incapable of establishing enantioselective metabolic processes. This study reports on the development and application of a chiral analytical method for the simultaneous, enantiospecific determinations of MPH and ethylphenidate. This approach was of special importance owing to the disparate pharmacological activities of the enantiomers of this drug13 and metabolite.14 These isomers were resolved using a macrocyclic, i.e., erythromycin-like, chiral liquid chromatographic column that avoided the potential confounds of chiral derivatization.19
Elevation of plasma d-MPH by ethanol
Ethanol consumed 30 min before or 30 min after MPH administration resulted in significantly elevated mean plasma Cmax and AUC values for d-MPH when compared to MPH given without ethanol (Figure 2 and Table 1). The elevation of plasma MPH AUC and Cmax values by ethanol is consistent with the hypothesis that ethanol is functioning as an inhibitor of esterase-mediated MPH hydrolysis (and/or that the metabolite ethylphenidate is such an inhibitor). This inhibition of MPH hydrolysis may be a consequence of competitive metabolic transesterification, resulting in ethylphenidate formation (Figure 1). Accordingly, differential rates of these two methyl–ester biotransformation pathways, hydrolysis versus transesterification, appear to increase the overall exposure to the parent drug.
Mean plasma concentrations of l-MPH were approximately 1% that of d-MPH without ethanol, whereas attaining approximately 3% that of d-MPH in the two ethanol phases. However, this difference in l-MPH concentrations in the ethanol phases relative to that of MPH alone did not reach statistical significance.
The ethanol-induced elevation in d-MPH Cmax and AUC values raises concern that such influences may contribute to increased abuse liability for this combination of drugs. This is in view of the report that an increase in the rate of absorption and/or an increase in Cmax for MPH correlates with MPH abuse liability.20 These pharmacokinetic drug interaction findings relate to relatively low doses in a controlled environment study. Where the risk of higher doses of MPH–ethanol exists, such as in comorbid ADHD–alcohol use disorder, other drug treatment options may be advisable.
Sex differences in d-MPH–ethanol pharmacokinetics
The extent of exposure (AUC) of d-MPH was significantly greater in men when the immediate-release dl-MPH was dosed without ethanol, as well as when ethanol was administered before MPH. This sex difference nearly reached significance when dl-MPH was dosed before ethanol.
Men have previously been reported to exhibit approximately 30% greater oral dl-MPH bioavailability (AUC) than women when receiving the modified-release dl-MPH formulations Concerta®,15 Ritalin-LA,15 and Metadate-CD16 in the absence of ethanol. These three modified-release products all have an immediate-release dl-MPH component, in addition to 50–78% of the total dose being released after a delay, which results in maximal blood MPH concentrations approximately 4–5 h post-administration.19 Accordingly, the sex-dependent MPH bioavailability differences reported for these three modified-release formulations are consistent with enteric presystemic metabolism sex differences extending to more distal regions of the small gut. Relating such pharmacokinetic sex dimorphisms to efficacy, it is noted that improvement in attention was comparable for ADHD girls (n = 42) and boys (n = 115) at early time points when receiving two of the above modified-release MPH formulations (which delay release 60% or 78% of the total dose after the immediate-release component). However, in these patients, improvement in attention was significantly less (P<0.01) for girls later in the day.21 Considering this sex-based duration of action disparity, it remains possible that the lower extent of MPH exposure in female than in male subjects is accentuated by drug release in the lower small gut understanding as relative to the upper regions of the gut as pertinent to immediate-release MPH absorption.
Identification of a novel MPH-poor metabolizer
Two lines of evidence support a common enzyme deficiency underlying the unique metabolic profile for the MPH-poor metabolizer identified in this study, i.e., a null carboxylesterase-1 allele: (1) approximately 100 times higher plasma l-MPH concentrations were found in this individual in all three phases of the study, and (2) ethylphenidate was not detectable in any of the plasma samples from the poor metabolizer, unlike the remaining 19 subjects in this study.
Whether this poor metabolizer represents a rare inborn error/defect of metabolism or represents the first report of a new pharmacogenetic polymorphism remains unknown. MPH therapeutic drug monitoring studies have generally not used enantiospecific analytical methods, but rather report only pooled d- plus l-MPH concentrations (see reviews in refs. 15 and 19). Jonkman et al.22 have applied chiral analytical methodology to a small study and found that ADHD children who were non-responders to MPH therapy (n = 4) had higher l-MPH than responders (n = 8). Larger scale studies will be required to verify Jonkmans the findings.
Enantioselective formation of ethylphenidate following MPH–ethanol
The metabolite ethylphenidate was found in the plasma, enantio-enriched in the l-isomer. The l-isomer of ethylphenidate does not elicit behavioral effects in mice, nor does it possess monoaminergic activity in standardized in vitro screening.14 Accordingly, this metabolite is unlikely to directly contribute to the pharmacodynamics of the MPH–ethanol interaction. However, this apparent carboxylesterase-1-mediated transesterification pathway yielding ethylphenidate may compete with MPH hydrolysis by carboxylesterase-1, resulting in the observed elevation of d-MPH Cmax, and AUC by ethanol (Table 1 and Figure 2).
Sex differences in the subjective effects of MPH with or without ethanol
The visual analog scale questionnaire was adapted from related psychopharmacology studies of MPH subjective effects.23–25 Female subjects generally reported greater subjective effects than male subjects (Table 2). Interestingly, the greater subjective effects in female subjects occurred in spite of the lower mean d-MPH Cmax and AUC values found for female subjects (see Results). This sex-based drug sensitivity toward MPH-induced stimulating effects could constitute a differential vulnerability to MPH abuse. Furthermore, this specific behavioral dimorphism has recently been reported to generalize to cocaine and ethanol.26
Conclusion
Ethanol produced significant increases in both the AUC and Cmax of d-MPH. Increases in both the rate and Cmax of MPH have correlated with MPH abuse liability.20 Accordingly, in view of this MPH–ethanol drug interaction, alternatives to MPH pharmacotherapy may warrant consideration in the rational treatment of adult ADHD with comorbid alcohol use disorder and/or substance use disorder. In such cases, other approved treatment options, such as amphetamine or atomoxetine, offer alternatives to MPH therapy although not being associated with reported ethanol pharmacokinetic interactions in humans.
The metabolite ethylphenidate forms enantioselectively, yielding primarily the inactive14 l-isomer. Thus, this metabolite is unlikely to directly contribute to the pharmacodynamics of the MPH–ethanol interaction. The novel MPH-poor metabolizer identified in this study may represent a distinct polymorph, or only a rare metabolic defect. Female subjects reported significantly greater subjective effects to MPH across treatments. This drug sensitivity could constitute a sex-based differential vulnerability to MPH abuse.
METHODS
Research subjects
Each subject provided written informed consent approved by the Medical University of South Carolina’s Office of Research Integrity. The study was conducted in the General Clinical Research Center, located at the Medical University of South Carolina. The study population consisted of 20 individuals (10 women, 10 men), aged 23–40 years, who were healthy as assessed by medical history, physical examination, 12-lead electrocardiogram, and routine laboratory tests including complete blood count, serum electrolytes, blood glucose, urinalysis, urine drug screen, and liver function indices. Additionally, all subjects were within 15% of ideal body weight and were non-smokers. Further, they were asked to abstain from the use of caffeinated beverages for the duration of the study and to be medication-free, including the use of botanical preparations and other over-the-counter supplements. The study was conducted in compliance with the current National Institute on Alcohol Abuse and Alcoholism Recommended Council Guidelines on Ethyl Alcohol Administration in Human Experimentation (June, 1989) and did not involve the administration of ethanol to alcohol-naive subjects. Subjects were specifically questioned about any alcohol- or substance-use history and asked to answer questions from the Brief Michigan Alcoholism Screening Test27 with an exclusion criterion of scoring 2 or greater.
Drug administration and sampling
The study required three overnight visits, with subjects checking into the clinical facility at 1930 hours on the evening before each testing session and fasting. While fasting, only water was allowed. The active study day commenced the following morning at approximately 0630, when subjects received a standard breakfast eaten in its entirety: a plain bagel with cream cheese (1 oz) and skim milk (8 oz), and finished within 15 min. After breakfast, an indwelling venous catheter was placed in each subject’s arm to facilitate serial blood sampling. The standard lunch was eaten at 1145 in its entirety: grilled chicken, rice, roll with margarine, apple slices, and water consumed within 30 min. There was at least a 6-day washout period between treatment regimens, and negative urine pregnancy results (female subjects) were obtained at the beginning of each active study session.
An open label 3-way randomized, crossover study design was employed. Three treatment schedules were used: (1) MPH–ethanol: 60 min after breakfast, oral immediate-release dl-MPH HCl (0.3 mg/kg) was administered as 10 and 5 mg tablets (Ritalin®, Novartis Pharmaceuticals, Summit, NJ), with the 5 mg tablets cut to the nearest 2.5 mg using a tablet cutter as appropriate. Ethanol (0.6 g/kg; 0.66 ml/kg 95% ethanol) was dosed 30 min later in orange juice and soda water (to facilitate ethanol absorption), and consumed within 15 min; (2) ethanol–MPH: 90 min after breakfast (rather than 60 min, in order to reduce the food effect on ethanol blood concentrations), ethanol (0.6 g/kg) in orange juice and soda was consumed within 15 min, and then oral immediate-release dl-MPH (0.3 mg/kg) was administered 30 min after the beginning of ethanol consumption; (3) MPH only: 60 min after breakfast, oral immediate-release dl-MPH (0.3 mg/kg) was administered, followed 30 min later by orange juice and soda containing no ethanol, and was consumed within 15 min.
A total of 10 samples were taken over the active study period. These blood collection times correspond to 0, 0.5, 1, 1.5, 2, 3, 4, 6, 8 and 10 h after MPH dosing. Blood collection tubes (Vacutainers® Becton Dickinson, Rutherford, NJ) previously stored in an ice bath and containing sodium oxalate to minimize postsampling MPH and ethylphenidate hydrolysis were used for this purpose. Venous catheter lines were flushed of residual heparin solution before sampling. Samples were promptly centrifuged at 4°C for 5 min, and the plasma was immediately aspirated into polypropylene vials and stored at −70°C until analysis.
Vital signs
Blood pressure, heart rate, temperature, and respiratory rate were obtained at the screening visit and recorded at the beginning and ending of each of the three active sessions. Blood pressure and heart rate were periodically recorded over the course of the post-dosing sessions in the interest of safety.
Visual analog scale
A nine-question MPH/ethanol subjective effects questionnaire using visual analog subscales (see Table 2) was administered before (baseline) dosing with MPH or ethanol and repeated at 0.5, 1, 1.5, 2, 3, 5, and 10 h after these dosages. The subscales allowed rating of the degree to which the subject was experiencing each effect by making a vertical mark on a 100-mm solid-line ranging from “not at all” to “extremely”.
Recovery period
Following each study period, subjects remained at the study site until blood alcohol concentrations were below 20 mg % (mg/dl) as measured by a Breathalyzer test.
d-, l-MPH and d-, l-ethylphenidate plasma analysis
Analysis was conducted at MEDTOX Laboratories (St Paul, MN). Samples were kept frozen (70°C) until the day of analysis, and thawed samples were kept on ice until aliquoted. Calibrators (0.5 ml plasma), quality control samples, and unknown samples were added to extraction tubes already containing 2 ml of cyclohexane and 25 μl of internal standard solution (4.56 ng/μl piperidine-deuterated MPH HCl28 in methanol:water (1:1)). The samples were alkalinized by the addition of 50 μl of 1 M sodium carbonate and a liquid–liquid extraction was performed by vortexing the samples for 2 min using a multitube vortexer. After centrifugation, the organic layer was transferred to 15-ml tubes and dried under a gentle stream of nitrogen at room temperature. The residues were reconstituted with 100 μl of acetonitrile and transferred into injection vials. Plasma calibrators (0.5 ml) were used at 0.05, 0.1, 0.2, 0.5, 1, 5, and 25 ng/ml.
Instrumentation
An Agilent Technologies 1100 high-performance liquid chromatography interfaced to a Micromass tandem mass spectrometer operating in positive ion mode was used. The high-performance liquid chromatography column was operated at ambient column temperature. The mobile phase consisted of 0.025% trifluoroacetic acid/0.025% ammonium acetate in methanol. The injection volume was 20 μl, and the flow rate was 200 μl/min. Chromatographic resolution of the MPH and ethylphenidate isomers was achieved using a chiral Chirobiotic V column (50 × 2.1 mm) from Advanced Separation Technologies (Whippany, NJ) and an isocratic mobile phase flowing at 200 μl/min. Each analyte was detected in the effluent by positive electrospray ionization tandem mass spectrometry using a Micromass Ultima mass spectrometer tuned to provide maximum signal strength for each analyte. MPH was detected by monitoring the parent-to-daughter transition m/z 234>84, and the transition m/z 248>84 was monitored for ethylphenidate. D5-MPH28,29 was incorporated for analytical control of both analytes and was detected by monitoring the transition m/z 239>89. The lower limit of quantifiable detection for each isomer was 0.05 ng/ml plasma.
Pharmacokinetic analysis
Pharmacokinetic parameters were calculated by standard methods.30 Noncompartmental analysis of enantiospecific MPH and ethylphenidate plasma concentrations was performed using WinNonlin v 5.1 computer software (Pharsight, Cary, NC). Area under the concentration versus time curve was calculated by the trapezoidal rule to the last measured time point (AUC0-t). This area was added to the residual area, determined by dividing the last measured concentration by the terminal elimination rate constant, to determine the AUC to infinity (AUC0–inf). Owing to the extreme differences in the pharmacokinetic parameters for the poor metabolizer relative to other “normal” subjects, the plasma–drug concentration values for the poor metabolizer were not included in the calculations of mean values of the other subjects.
Statistical analysis
The mean and the least-square geometric means of the two test treatments and the reference were calculated for Cmax, AUC0-t, and AUC0–inf. The ratio of the geometric mean tests to the reference, as well as the 90% CIs about the reference, was determined. Comparisons between the male and female pharmaco-kinetic parameters were made using Student’s t-tests assuming equal variance. The primary pharmacokinetic end point variables were compared using analysis of variance with Treatment (A, B, C) as a within-subject (repeated measures)-factor and sex as a between-subject factor using a randomized design to take into account sequence (carryover) effect as described by Winer.31 The level of significance was set at α=0.05.
Repeated subjective responses to each of the nine questions of interest were summarized using the peak change from the baseline response, as well as the area under the response versus time curve, which was calculated using the middle rectangular approximation method. A mixed effects analysis of variance was conducted to account for the correlation between observations made on the same subject; the analysis included a sex-by-treatment interaction, as well as the corresponding main effects indicated by the crossover design. When appropriate, the response variable was transformed to address issues with normality and variance assumptions. In situations where available transformations were not sufficient to address the assumptions, the analysis of the corresponding question was discontinued. The primary question of interest (Do you feel any drug effect?) was analyzed using level of significance 0.05. The remaining questions were analyzed as supportive evidence describing the observed effect of the drug.
ACKNOWLEDGMENTS
We gratefully appreciate the important contributions of the Medical University of South Carolina’s General Clinical Research Center in conducting these human subject studies (with support from NIH MO1 RR01070). This work washout further supported through the NIH/NIDA (RO1 DA-15797) and NIAAA (RO1AA016707).
Footnotes
CONFLICT OF INTEREST Dr Patrick is a consultant to Celgene Corp. (2004), Johnson and Johnson Corp. (2006), Clariant Corp. (2006), and consulted with Novartis Pharmaceuticals in 2001. Dr DeVane has received research grants from Janssen Pharmaceuticals and Eli Lilly and has been a consultant to Novadel Pharmaceuticals, Glaxo SmithKline, Janssen Pharmaceuticals, Eli Lilly & Co, and Bristol Myers Squibb. Dr Markowitz has served as a consultant to Novartis Pharmaceuticals, Celltech Pharmaceuticals, and Eli Lilly & Co. Dr Straughn is a consultant for Novartis Pharmaceuticals.
References
- 1.Biederman J, Spenser T. Methylphenidate in treatment of adults with attention-deficit/hyperactivity disorder. J. Atten. Disorders. 2002;6:S101–S107. doi: 10.1177/070674370200601s12. [DOI] [PubMed] [Google Scholar]
- 2.Biederman J, Wilens T, Mick E, Milberger S, Spencer TJ, Faraone SV. Psychoactive substance use disorders in adults with attention deficit hyperactivity disorder (ADHD): Effects of ADHD and psychiatric comorbidity. Am. J. Psychiatry. 1995;52:1652–1658. doi: 10.1176/ajp.152.11.1652. [DOI] [PubMed] [Google Scholar]
- 3.Levin FR, Evans SM, Kleber HD. Practical guidelines for the treatment of substance abusers with adult attention-deficit hyperactivity disorder. Psychiat. Services. 1999;50:1001–1003. doi: 10.1176/ps.50.8.1001. [DOI] [PubMed] [Google Scholar]
- 4.Schubiner H, et al. Prevalence of attention-deficit/hyperactivity disorder and conduct disorder among substance abusers. J. Clin. Psychiat. 2000;61:244–515. doi: 10.4088/jcp.v61n0402. [DOI] [PubMed] [Google Scholar]
- 5.The DAWN Report. Trends in drug-related emergency department vists, 1994–2002. U.S. Dept Health & Human Serv; Nov, 2003. pp. 5–101. [Google Scholar]; Annual Emergency Department Data. Department of Health and Human Services, Substance Abuse and Mental Health Services Administration; 1997–2003. [Google Scholar]
- 6.Barrett SP, Pihl RO. Oral methylphenidate-alcohol co-abuse. J. Clin. Psychopharmacol. 2002;22:633–634. doi: 10.1097/00004714-200212000-00020. [DOI] [PubMed] [Google Scholar]
- 7.Teter CJ, McCabe SE, Boyd CJ, Guthrie SK. Illicit methylphenidate use in an undergraduate student sample: prevalence and risk factors. Pharmacotherapy. 2003;23:609–617. doi: 10.1592/phco.23.5.609.34187. [DOI] [PubMed] [Google Scholar]
- 8.Jaffe SL. Intranasal abuse of prescribed methylphenidate by an alcohol and drug abusing adolescent with ADHD. J. Am. Acad. Child. Adolesc. Psychiatry. 1991;30:773–775. [PubMed] [Google Scholar]
- 9.Markowitz JS, Logan BK, Diamond F, Patrick KS. Detection of the novel metabolite ethylphenidate after methylphenidate overdose with alcohol coingestion. J. Clin. Psychopharmacol. 1999;19:362–366. doi: 10.1097/00004714-199908000-00013. [DOI] [PubMed] [Google Scholar]
- 10.Jatlow P, McCance EF, Bradberry CW, Elsworth JD, Taylor JR, Roth RH. Alcohol plus cocaine: the whole is more than the sum of its parts. Ther. Drug. Monit. 1996;18:460–464. doi: 10.1097/00007691-199608000-00026. [DOI] [PubMed] [Google Scholar]
- 11.Markowitz JS, et al. Ethylphenidate formation in human subjects after the administration of a single dose of methylphenidate and ethanol. Drug. Metab. Dispos. 2000;28:620–624. [PubMed] [Google Scholar]
- 12.Meyer MC, et al. Bioequivalence of methylphenidate immediate-release tablets using a replicated study design to characterize intrasubject variability. Pharm. Res. 2000;17:381–384. doi: 10.1023/a:1007560500301. [DOI] [PubMed] [Google Scholar]
- 13.Patrick KS, Caldwell RW, Ferris RM, Breese GR. Pharmacology of the enantiomers of threo-methylphenidate. J. Pharmacol. Exp. Ther. 1987;241:15–18. [PubMed] [Google Scholar]
- 14.Patrick KS, Williard RL, VanWert AL, Dowd JJ, Oatis JE, Middaugh LD. Synthesis and pharmacology of ethylphenidate enantiomers: The human transesterification metabolite of methylphenidate and ethanol. J. Med. Chem. 2005;48:2876–2881. doi: 10.1021/jm0490989. [DOI] [PubMed] [Google Scholar]
- 15.Markowitz JS, Straughn AB, Patrick KS. Advances in the pharmacotherapy of attention-deficit/hyperactivity disorder: focus on methylphenidate formulations. Pharmacotherapy. 2003;23:1281–1299. doi: 10.1592/phco.23.12.1281.32697. [DOI] [PubMed] [Google Scholar]
- 16.Pentikis HS, Connolly M, Markowitz J, Hatch S. Sex-based differences in the pharmacokinetics of methylphenidate. AACAP/CACAP; 25th Annual Meeting Science Proceedings; 2005. p. 127. [Google Scholar]
- 17.Perez-Reyes M, Jeffcoat AR. Ethanol/cocaine interaction: cocaine and cocaethylene plasma concentrations and their relationship to subjective and cardiovascular effects. Life. Sci. 1992;51:553–563. doi: 10.1016/0024-3205(92)90224-d. [DOI] [PubMed] [Google Scholar]
- 18.Perez-Reyes M. The order of drug administration: its effects on the interaction between cocaine and ethanol. Life. Sci. 1994;55:541–550. doi: 10.1016/0024-3205(94)00747-0. [DOI] [PubMed] [Google Scholar]
- 19.Patrick KS, Gonzalez MA, Straughn AB, Markowitz JS. New methylphenidate formulations for the treatment of attention-deficit/hyperactivity disorder. Expert Opin. Drug. Deliv. 2005;2:121–143. doi: 10.1517/17425247.2.1.121. [DOI] [PubMed] [Google Scholar]
- 20.Volkow N, Swanson J. Variables that affect the clinical use and abuse of methylphenidate in the treatment of ADHD. Am. J. Psychiatry. 2003;160:1909–1918. doi: 10.1176/appi.ajp.160.11.1909. [DOI] [PubMed] [Google Scholar]
- 21.Sonuga-Barker EJ, Sanchez D, Hatch S, Markowitz J. Sex differences in the clinical efficacy of MPH: Evidence from the COMACS study. AACAP/CACAP; 25th Annual Meeting Science Proceedings; 2005. p. 127. [Google Scholar]
- 22.Jonkman LM, et al. Differences in plasma concentrations of the D- and L-threo methylphenidate enantiomers in responding and non-responding children with attention-deficit hyperactivity disorder. Psychiatry. Res. 1998;78:115–118. doi: 10.1016/s0165-1781(97)00138-8. [DOI] [PubMed] [Google Scholar]
- 23.Volkow ND, et al. Temporal relationships between the pharmacokinetics of methylphenidate in the human brain and its behavioral and cardiovascular effects. Psychopharmacology. 1996;123:26–33. doi: 10.1007/BF02246277. [DOI] [PubMed] [Google Scholar]
- 24.Kollins SH, Rush CR, Pazzagliam PJ, Ali JA. Comparison of acute behavioral effects of sustained-release and immediate-release methylphendate. Exper and Clin. Pharmacol. 1998;4:367–374. doi: 10.1037//1064-1297.6.4.367. [DOI] [PubMed] [Google Scholar]
- 25.Heil SH, et al. Comparison of the subjective, physiological, and psychomotor effects of atomoxetine and methyphenidate in light drug users. Drug and Alcohol. Depend. 2002;67:149–156. doi: 10.1016/s0376-8716(02)00053-4. [DOI] [PubMed] [Google Scholar]
- 26.McCance-Katz EF, Hart CL, Boyarsky B, Kosten T, Jatlow P. Gender effects following administration of cocaine and alcohol in humans. Substance Use Abuse. 2005;40:511–528. doi: 10.1081/ja-200030693. [DOI] [PubMed] [Google Scholar]
- 27.Pokorny AD, Miller BA, Kaplan HB. The brief MAST: a shortened version of the Michigan Alcoholism Screening Test. Am. J. Psychiatry. 1972;129:342–345. doi: 10.1176/ajp.129.3.342. [DOI] [PubMed] [Google Scholar]
- 28.Patrick KS, Kilts CD, Breese GR. Synthesis of deuterium labelled methylphenidate, p-hydroxymethylphenidate, ritalinic acid and p-hydroxyritalinic acid. J. Label Comp. Radiopharm. 1981;9:485–490. [Google Scholar]
- 29.Patrick KS, Ellington KR, Breese GR, Kilts CD. Gas chromatographic-mass spectrometric analysis of methylphenidate and p-hydroxymethylphenidate using deuterated internal standards. J. Chromatogr. 1985;343:329–338. doi: 10.1016/s0378-4347(00)84601-0. [DOI] [PubMed] [Google Scholar]
- 30.Rowland M, Tozer T. Clinical Pharmacokinetics: Concepts and Applications. Lea and Febiger; London: 1989. [Google Scholar]
- 31.Winer B. Statistical Principles in Experimental Design. McGraw-Hill; New York: 1962. [Google Scholar]