

Abstract
Objectives
We previously showed that prostate-specific antigen (PSA) nadir after radical prostatectomy (RP) significantly predicts biochemical recurrence (BCR). Herein, we sought to explore the effect of including PSA nadir into commonly used models on their accuracy to predict BCR after RP.
Methods
This was a retrospective analysis of 943 and 1792 subjects from the Shared Equal Access Regional Cancer Hospital (SEARCH) and Duke Prostate Cancer (DPC) databases, respectively. The discrimination accuracy for BCR of seven previously published models was assessed using concordance index and compared with and without adding PSA nadir level in SEARCH. Using data from SEARCH, we developed a new nomogram incorporating PSA nadir to other known predictors (preoperative PSA, pathological Gleason score, PSA nadir level, surgical findings, prostate weight, body mass index and race) of BCR and externally validated it in the DPC.
Results
In SEARCH, the mean concordance index across all seven nomograms was 0.687. After the inclusion of PSA nadir, the concordance index increased by nearly 7% (mean = 0.753). The concordance index of the new nomogram in SEARCH was 0.779 (bias-corrected = 0.767), which was 5% better than the next best model. In DPC, the new nomogram yielded a concordance index of 0.778.
Conclusion
The addition of postoperative PSA nadir to commonly used nomograms increased their accuracies by nearly 7%. Based upon this, we developed and externally validated a new nomogram, which was well calibrated and highly accurate, and is a potentially valuable tool for patients and physicians to predict BCR after RP.
Keywords: disease-free survival, nomograms, prostate cancer, prostate-specific antigen, prostatectomy, validation studies
Introduction
Despite contemporary advances in prostate cancer, such as widespread disease screening, better surgical candidate selection and improved operative techniques, 15–40% of patients treated with radical prostatectomy (RP) will experience biochemical recurrence (BCR).1 After recurrence, these patients are at a higher risk for disease progression and death.2 Several studies have evaluated the use of early secondary treatments after surgery to decrease BCR and overall mortality. Unfortunately, not all men necessarily benefit from such therapies.3–6 Some patients may never develop prostate-specific antigen (PSA) elevation and many others may have an indolent recurrence not requiring treatment. It is critical to properly select patients for adjuvant therapies in order to minimize side-effects and maximize their benefits.7 Currently there are several predictive models to risk stratify patients after surgery.8 The large majority of these models include preoperative and perioperative variables (e.g. PSA before surgery, pathological Gleason score and tumor stage). However, given adjuvant therapy is usually started a few months after RP and by that time, postoperative PSA levels have reached nadir, it seems reasonable to include postoperative PSA in the decision of whether or not to start secondary treatments. Previously, we showed postoperative PSA nadir was highly correlated with risk of BCR9 and overall mortality.10 Therefore, we sought to explore the effect of including PSA nadir into commonly used models and nomograms on their accuracy to predict BCR after RP among subjects of the Shared Equal Access Regional Cancer Hospital (SEARCH) database. Additionally, we developed a new nomogram incorporating nadir and other well-established predictors of BCR and externally validated it in the Duke Prostate Cancer (DPC) database.
Methods
Study population
After obtaining institutional review board approval from each institution, data from patients undergoing RP between 1998 and 2008 at four Veteran Affairs Medical Centers (West Los Angeles and Palo Alto, CA; Augusta, GA; and Durham, NC) were combined into the SEARCH database (development cohort).10 The database includes information on patient age at surgery, race, height, weight, clinical stage, cancer grade on diagnostic biopsies, preoperative PSA, surgical specimen pathology (specimen weight, tumor grade, stage and surgical margin status) and follow-up PSA. We restricted our analyses to patients treated between 1998 and 2008 because prior to this time patients were not followed with ultrasensitive PSA assays (sensitivity of 0.01 ng/mL). Data from patients treated at Duke University Medical Center between 1998 and 2007 were abstracted into the DPC Database (validation cohort).11 The database includes similar information to SEARCH; however, patients were followed with non-ultrasensitive PSA (sensitivity of 0.1 ng/mL). External validation on a non-ultrasensitive PSA cohort was chosen given it allows an assessment of the generalizability of our results even when ultrasensitive PSA is unavailable. Patients treated with preoperative hormonal therapy or radiotherapy were excluded from both cohorts. Of 1300 patients in SEARCH, we excluded eight (<1%) due to start of adjuvant therapy before PSA nadir, 130 (10%) due to missing nadir within 1–6 months postoperatively, 114 (9%) whose nadir was ≥0.2 ng/mL (i.e. they recurred based upon nadir PSA value and thus are not at risk for future recurrence), 101 (8%) due to missing follow-up data after nadir and four (<1%) due to positive lymph nodes. This resulted in a study population of 943 subjects in SEARCH. Of 3130 patients in DPC, we excluded 856 (27%) due to missing nadir within 1–6 months postoperatively, 142 (4%) whose nadir was ≥0.2 ng/mL, 343 (11%) due to missing follow up after nadir and 17 (<1%) due to positive lymph nodes. This resulted in a population of 1792 subjects in DPC.
All patients were followed with serial PSA and clinical visits at intervals according to attending physician discretion. PSA nadir was defined as the lowest PSA level within 1–6 months postoperatively and before BCR.9 Additional postoperative treatments were at the judgment of the patient and treating physician. In both SEARCH and DPC, BCR was defined as a postoperative PSA level ≥ 0.2 ng/mL or secondary treatment for an elevated PSA.12 For our study purposes, the definition adopted, which slightly differs from the American Urologic Association (AUA) definition,13 provides a better classification for patients with rising PSA who received early secondary treatment. The AUA definition, which has PSA-only criteria, would categorize these patients as not having developed biochemical recurrence. We believe this creates a bias in that men at very high risk of recurrence (i.e. PSA of 0.19 ng/mL who received salvage radiation) are censored. This could artificially make the recurrence rates look better than in actuality. Thus, we believe our composite definition based upon PSA and clinical practice (i.e. treatment for an elevated PSA) is better suited to reduce this potential bias.
Statistical analysis
The predictive discrimination of the following seven models was assessed in SEARCH: (i) the risk classification published by D'Amico et al.;14 (ii) the pre-15 and (iii) postoperative16 nomograms of Kattan et al.; (iv) the DPC nomogram;12 (v) the Cancer of the Prostate Risk Assessment (CAPRA) model;17 (vi) the Center for Prostate Disease Research (CPDR/CaPSURE) model;18 and (vii) the Johns Hopkins Hospital model.19 The overall discrimination for BCR of the various models was determined using Harrell's concordance index (c-index).20 In exploratory analysis, we calculated the c-index for each model with and without PSA nadir level to determine the changes in concordance by adding nadir. To obtain the accuracy of the models with nadir, we calculated the linear predictor for all subjects based on each nomogram and then used this value along with PSA nadir in a proportional hazard model.
For nomogram development, we considered the following variables for the model: age at surgery (in years, continuous), race (white or non-white), body mass index (BMI in kg/m2, continuous and log-transformed), year of surgery (in years, continuous), preoperative PSA (in ng/mL, continuous and log-transformed), PSA nadir level (in ng/mL, continuous and log-transformed), clinical T stage (T1,T2–3), pathological Gleason score (2–6, 3+4, ≥4+3), surgical findings (organ-confined and margin-negative [OC and M−], positive surgical margins [PSM] and/or extracapsular extension [ECE], seminal vesicle invasion [SVI]) and prostate weight (in grams, continuous and log-transformed). Stepwise variable selection was employed. We used the Cox proportional hazards to analyze the association between the above covariates and time to BCR. The nomogram was created based on the Cox regression model and designed to predict the BCR-free probability at 1, 3 and 5 years postoperatively. We internally validated the nomogram in SEARCH by determining the bias-corrected c-index using bootstrapping. To examine the effect of PSA nadir in the accuracy of the new model, we internally validated it separately in men with and without detectable nadir values and then compared it to the performance of the other nomograms. External validation of the new nomogram was done in DPC using calibration plots and c-index. All statistical analyses were performed using Stata 10.1 (StataCorp, College Station, TX, USA) and R 2.9.0 (R Foundation for Statistical Computing, Vienna, Austria). P < 0.05 was considered statistically significant.
Results
In DPC, 95% had an undetectable PSA nadir vs only 68% in SEARCH (Table 1). In both datasets, there was a similar percentage (3–5%) with nadir values ranging from 0.1 to 0.19 ng/mL. Overall, patients in SEARCH had a higher risk of BCR compared to those from DPC (Fig. 1).
Table 1.
Baseline characteristics
| Variable | SEARCH (Development) No. (%) | DPC (Validation) No. (%) |
|---|---|---|
| Total number of patients | 943 | 1792 |
| PSA nadir (ng/mL) | ||
| Undetectable | 642 (68) | 1709 (95) |
| 0.01 | 87 (9) | – |
| 0.02 | 67 (7) | – |
| 0.03 | 43 (4) | – |
| 0.04 | 25 (3) | – |
| 0.05–0.09 | 49 (5) | – |
| 0.10–0.19 | 31 (3) | 83 (5) |
| Age at surgery (years) | ||
| Mean (SD) | 60 (6.4) | 61 (7.3) |
| Median (IQR) | 60 (56–65) | 61 (56–66) |
| Veteran Affairs Medical Center | ||
| 1 | 320 (34) | – |
| 2 | 72 (8) | – |
| 3 | 237 (25) | – |
| 4 | 314 (33) | – |
| Race | ||
| White | 444 (48) | 1451 (81) |
| Non-white | 475 (52) | 337 (19) |
| Body mass index (kg/m2) | ||
| Mean (SD) | 28.0 (4.7) | 28.3 (5.5) |
| Median (IQR) | 27.7 (25.0–30.4) | 27.6 (25.5–30.4) |
| Biopsy Gleason score | ||
| 2–6 | 554 (61) | 1222 (73) |
| 3 + 4 | 215 (24) | 244 (14) |
| ≥4 + 3 | 137 (15) | 215 (13) |
| Preoperative stage: | ||
| T1 | 573 (64) | 1285 (80) |
| T2–T3 | 324 (36) | 329 (20) |
| Preoperative PSA (ng/mL) | ||
| Mean (SD) | 7.9 (7.5) | 6.7 (5.2) |
| Median (IQR) | 6.2 (4.5–9.0) | 5.5 (4.2–7.5) |
| Postoperative Gleason score | ||
| 2–6 | 360 (40) | 816 (46) |
| 3 + 4 | 389 (43) | 621 (35) |
| ≥4 + 3 | 159 (17) | 349 (19) |
| Extracapsular extension | 165 (18) | 434 (24) |
| Positive margins | 365 (40) | 564 (31) |
| Seminal vesicle invasion | 40 (4) | 108 (6) |
| Prostate weight (g) | ||
| Mean (SD) | 44 (24) | 44 (20) |
| Median (IQR) | 38 (31–51) | 40 (32–52) |
| Follow up (months) | ||
| Median (IQR) | 41 (21–65) | 45 (22–76) |
IQR, interquartile range; PSA, prostate-specific antigen; SD, standard deviation.
Fig. 1.
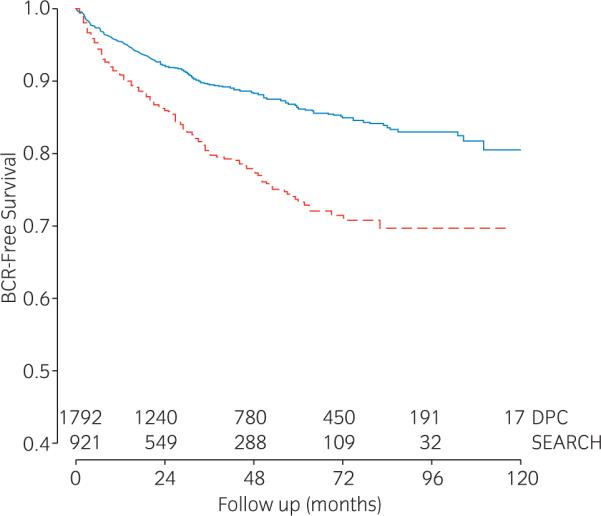
Kaplan-Meier plot depicting biochemical recurrence (BCR)-free survival after radical prostatectomy in the  Shared Equal Access Regional Cancer Hospital (SEARCH) cohort (n = 921) and the
  Duke Prostate Cancer (DPC) (n = 1792) cohort.
In SEARCH, the mean c-index for BCR across all seven nomograms was 0.687, ranging from 0.650 to 0.716 (Table 2). After including PSA nadir level to all seven models, the mean c-index increased by nearly 7% (mean = 0.753; range 0.737–0.772). Nadir level alone as a predictor of BCR yielded a c-index of 0.661, which was higher than any other individual variable alone (data not shown). The independent predictors of BCR in SEARCH were higher PSA nadir level, higher BMI, non-white race, higher pathological Gleason score, and adverse pathological findings (Table 3). The following variables were included in the nomogram: preoperative PSA, pathological Gleason score, PSA nadir level, surgical findings, prostate weight, BMI and race (Fig. 2). The c-index of the new nomogram in SEARCH was 0.779 with a bias-corrected c-index of 0.767. Of note, this compares to a bias-corrected c-index of 0.718 for the same multivariate model without nadir. Thus, nadir increased the accuracy of our ability to risk stratify men for BCR by 5%. In patients with an undetectable nadir, the new nomogram had a c-index similar to other nomograms (concordance index [CI] = 0.720, Table 4). However, among patients with non-zero nadir, the new nomogram had considerably better performance (CI = 0.791).
Table 2.
Concordance indexes of various models for predicting biochemical recurrence in the Shared Equal Access Regional Cancer Hospital (SEARCH) cohort with and without prostate-specific antigen (PSA) nadir
| Model | Concordance index |
Difference | Patients | Recurrences | |
|---|---|---|---|---|---|
| Without PSA nadir | With PSA nadir | ||||
| Preoperative models | |||||
| d'Amico | 0.650 | 0.737 | 0.087 | 866 | 169 |
| CAPRA | 0.696 | 0.755 | 0.059 | 790 | 152 |
| Preoperative Kattan | 0.677 | 0.745 | 0.068 | 843 | 166 |
| Average | 0.674 | 0.746 | 0.07 | 833 | 162 |
| Postoperative models | |||||
| Postoperative Kattan | 0.705 | 0.764 | 0.059 | 812 | 152 |
| DPC | 0.716 | 0.772 | 0.056 | 829 | 159 |
| CPDR | 0.674 | 0.6740 | 0.066 | 859 | 167 |
| JHH | 0.691 | 0.756 | 0.065 | 827 | 156 |
| Average | 0.697 | 0.758 | 0.062 | 832 | 159 |
| Average | 0.687 | 0.753 | 0.066 | 832 | 160 |
CAPRA, Cancer of the Prostate Risk Assessment; CPDR, Center for Prostate Disease Research; DPC, Duke Prostate Center; JHH: Johns Hopkins Hospital.
Table 3.
Multivariable predictors of biochemical recurrence in the Shared Equal Access Regional Cancer Hospital (SEARCH) cohort
| Variable | HR | 95%CI | P |
|---|---|---|---|
| PSA nadir (per 0.01 ng/mL) | 1.14 | 1.10–1.18 | <0.001 |
| Age (years) | 1.01 | 0.99–1.04 | 0.382 |
| Race | |||
| White | ref | – | – |
| Non-white | 1.37 | 1.02–1.97 | 0.035 |
| Body mass index (log[kg/m2]) | 3.02 | 1.15–7.92 | 0.025 |
| Year of surgery (years) | 0.96 | 0.89–1.03 | 0.221 |
| Preoperative PSA (log[ng/mL]) | 1.25 | 0.99–1.59 | 0.066 |
| Clinical T stage | |||
| T1 | ref | – | – |
| T2–T3 | 1.17 | 0.85–1.61 | 0.333 |
| Pathological Gleason score | |||
| 2–6 | ref | – | – |
| 3 + 4 | 2.04 | 1.33–3.15 | 0.001 |
| ≥4 + 3 | 2.75 | 1.71–4.43 | <0.001 |
| Surgical findings | |||
| OC and M- | ref | – | – |
| PSM or ECE | 1.99 | 1.39–2.84 | <0.001 |
| SVI | 2.68 | 1.44–4.97 | 0.002 |
| Prostate weight (log[g]) | 0.72 | 0.47–1.11 | 0.137 |
CI, confidence interval; ECE, extracapsular extension; HR, hazard ratio; OC and M-, organ-confined and margin-negative; PSA, prostate-specific antigen; PSM, positive surgical margins; SVI, seminal vesicle invasion.
Fig. 2.

Prostate-specific antigen (PSA) nadir nomogram. BCR, biochemical recurrence; ECE, extracapsular extension; *OC and M-, organ-confined and margin-negative; PSM, positive surgical margins; SVI, seminal vesicle invasion.
Table 4.
Concordance indexes of various models for predicting biochemical recurrence among patients with undetectable and detectable prostate-specific antigen (PSA) nadir in the Shared Equal Access Regional Cancer Hospital (SEARCH) cohort
| Model | Undetectable PSA nadir |
Detectable PSA nadir |
||||
|---|---|---|---|---|---|---|
| CI | N | R | CI | N | R | |
| Preoperative models | ||||||
| d'Amico | 0.635 | 607 | 96 | 0.618 | 275 | 78 |
| CAPRA | 0.687 | 562 | 85 | 0.671 | 242 | 72 |
| Preoperative Kattan | 0.660 | 593 | 94 | 0.649 | 266 | 78 |
| Postoperative models | ||||||
| PSA nadir alone | – | – | – | 0.745 | 289 | 69 |
| Postoperative Kattan | 0.729 | 572 | 87 | 0.708 | 254 | 68 |
| DPC | 0.706 | 591 | 92 | 0.731 | 252 | 70 |
| CPDR | 0.666 | 607 | 97 | 0.684 | 267 | 74 |
| JHH | 0.695 | 577 | 88 | 0.694 | 265 | 72 |
| PSA nadir nomogram | 0.720 | 632 | 89 | 0.790 | 289 | 69 |
CAPRA, Cancer of the Prostate Risk Assessment; CI, concordance index; CPDR, Center for Prostate Disease Research; DPC, Duke Prostate Center; JHH, Johns Hopkins Hospital; N, number of subjects; R, number of recurrences.
To externally validate our results among men followed with non-ultrasensitive PSA, we determined the c-index and calibration in DPC. Compared to SEARCH, patients treated in DPC had similar age, BMI, preoperative PSA and prostate weights. However, subjects in DPC were more likely to be white, had higher ECE and SVI and yet had lower postoperative Gleason scores and lower PSM (Table 1). The predicted risk of BCR within 5 years postoperatively in DPC based on the SEARCH nomogram was calculated across quartiles of risk and compared with the actuarial risk (Fig. 3). Overall, while the nomogram was relatively accurate, it slightly overpredicted disease recurrence in DPC (approximately 5% above the actuarial risk). In the lower risk groups the overprediction was about 3% while in the highest risk groups the predicted risk was 7% higher than the actuarial risk. Nevertheless, except for the highest risk quartile, the ideal prediction line fell within the predicted 95% confidence intervals and the overall shape of the calibration curve was linear, indicating that higher predicted risk did entail a higher actual risk. Finally, even in a cohort of men followed with non-ultrasensitive PSA and when very few men had detectable PSA (i.e. only 5%), the new nomogram had a comparable performance with other well-established nomograms (Table 5).
Fig. 3.
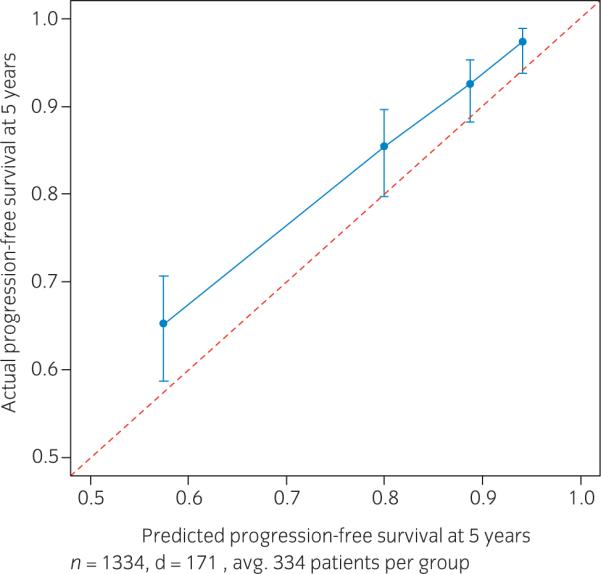
Calibration plot depicting predicted biochemical recurrence (BCR) compared to actuarial BCR at 5 years after radical prostatectomy in the Duke Prostate Cancer cohort.
Table 5.
Concordance indexes of various models for predicting biochemical recurrence in the Duke Prostate Cancer (DPC) cohort
| Model | Concordance Index | Patients | Recurrences |
|---|---|---|---|
| Preoperative models | |||
| d'Amico | 0.658 | 1603 | 188 |
| CAPRA | 0.659 | 1076 | 103 |
| Preoperative Kattan | 0.700 | 1478 | 173 |
| Postoperative models | |||
| Postoperative Kattan | 0.788 | 805 | 108 |
| DPC | 0.770 | 1647 | 195 |
| CPDR | 0.725 | 1663 | 197 |
| JHH | 0.752 | 860 | 113 |
| PSA nadir nomogram | 0.778 | 1334 | 171 |
CAPRA, Cancer of the Prostate Risk Assessment; CPDR, Center for Prostate Disease Research; DPC, Duke Prostate Center; JHH, Johns Hopkins Hospital.
Discussion
Several studies have examined the predictive accuracy of new markers (i.e. cytokines, genes and pathological parameters) with mixed results.21–26 Most of these new markers are associated with additional costs and labors. Consequently, there is no single marker or set of biomarkers regularly employed in prostate cancer prognostication today, except for PSA. PSA is inexpensive and readily available and is thus used routinely in several prostate cancer settings, such as screening, risk stratification and follow up. We have previously shown that postoperative PSA nadir is highly associated with disease recurrence9 and overall survival,10 being potentially useful in risk assessment. However, to date, only a few limited studies evaluated the predictive properties of postoperative PSA nadir.27,28 Therefore, we sought to explore the predictive characteristics of PSA nadir and the effect of including nadir into commonly used models and nomograms on their accuracy to predict BCR after RP.
In SEARCH, the currently available models to predict BCR after RP yielded a mean c-index of 0.687. After including postoperative PSA nadir, the c-index increased by nearly 7%. Although the clinical meaning of this improvement could not be determined in the present study, this improvement was equivalent to improvements seen by the use of the best new biomarkers currently under investigation.23 However, in contrast to new markers, no extra cost or labor is involved with PSA nadir. Additionally, nadir alone yielded a c-index of 0.661, which is comparable to the accuracy of preoperative models and higher than any other single variable alone. In patients with a detectable nadir, the c-index of nadir alone was 0.745, which was higher than the accuracy of currently available nomograms in our population. Therefore, these results reinforce our previous findings that PSA nadir is useful in risk stratification.9,10
We then developed a new nomogram including traditional predictors of BCR (i.e. surgical findings, grade, and pre-operative PSA) along with PSA nadir. We also included some non-traditional variables (i.e. race, BMI and prostate weight) given previous studies showed they can improve nomogram accuracy.12 In SEARCH, the new nomogram yielded a c-index of 0.770, which was nearly 8% higher than the average of the other nomograms and over 5% higher than the next best model. We then sought to validate it using an external dataset, the DPC cohort. Therein, we found the nomogram performed equally well with a c-index of 0.778. Thus, even in a cohort where ultrasensitive PSA is unavailable, our model appears to be a highly reliable, validated nomogram to predict disease recurrence after RP.
Among men with an undetectable nadir, the new nomogram had a comparable performance to other nomograms (CI = 0.720). We also found similar results in DPC, wherein 95% of patients had undetectable PSA nadirs; our nomogram had a similar performance to other well-established nomograms. However, within SEARCH, the c-index was considerably higher when the nomogram was applied to men with a detectable PSA nadir (CI = 0.790). Unfortunately, such an analysis was not possible in DPC given patients were followed with non-ultrasensitive PSA (with only one decimal digit) and there were only two possible nadir values: undetectable and 0.1 ng/mL. This lack of data granularity decreases the model's capability of stratifying patients given men with considerably different prognoses are grouped into the same category. For example, in DPC, men whose actual nadir value varied from 0 to 0.09 ng/mL were determined to have an “undetectable” nadir as their PSA values were below the limits of detection of the assay. However, we previously showed that patients with a nadir of 0.05–0.09 ng/mL are 12 times more likely to recur than those with an undetectable nadir using an ultrasensitive assay.9 As such, this absence of granular data on the exact nadir value likely reduced the performance of our nomogram in DPC. Nevertheless, we found that even when used with non-ultrasensitive PSA data, our nomogram had a performance that was equivalent to other well-established nomograms. However, when used with ultrasensitive PSA data (i.e. SEARCH), our model clearly had a superior performance. Thus, the strengths of our nomogram include the use of readily available variables without adding further costs or labor, it applies to both ultra-sensitive and non-ultrasensitive PSA populations, it is highly-accurate, validated and easy-to-use. However, it is necessary to further validate our nomogram in datasets with ultrasensitive PSA nadir data in order to confirm the dramatic improvements in accuracy seen within SEARCH.
The present study is limited by the retrospective nature of our cohort. Additionally, patients at very high risk (i.e. those whose nadir is ≥ 0.2 ng/mL) were not evaluated in the study because those patients were not at risk for BCR given that they already met the criteria for recurrence based upon their nadir PSA value. Moreover, the differences in demographics, pathological features and prognoses between SEARCH and DPC may have influenced the accuracy of our nomogram in external validation. However, these significant variations are in fact the strengths of our study because they allow for the assessment of generalizability of our model and transportability of our results among considerably dissimilar populations. Although recurrence has been shown to correlate with progression to metastatic disease29 and higher prostate-cancer specific mortality,30 models to predict long-term outcomes are still needed to further improve patient selection for adjuvant treatments. Finally, the use of the nomogram in medical practice is necessary to determine its clinical relevance.
In conclusion, the addition of postoperative PSA nadir to commonly used nomograms to predict BCR after RP considerably increased their predictive accuracies by nearly 7%. Based upon this, we developed and externally validated a new nomogram, which was well calibrated and highly accurate and, in our opinion, is a valuable tool for patients and physicians to predict BCR after RP.
Acknowledgments
This work is supported by Department of Veterans Affairs, National Institute of Health R01CA100938 (WJA), NIH Specialized Programs of Research Excellence Grant P50 CA92131-01A1 (WJA), the Georgia Cancer Coalition (MKT), the Department of Defense, Prostate Cancer Research Program, and the American Urological Association Foundation/Astellas Rising Star in Urology Award (SJF). Views and opinions of, and endorsements by, the author(s) do not reflect those of the US Army or the Department of Defense.
References
- 1.Klein EA, Bianco FJ, Serio AM, et al. Surgeon experience is strongly associated with biochemical recurrence after radical prostatectomy for all preoperative risk categories. J. Urol. 2008;179:2212–16. doi: 10.1016/j.juro.2008.01.107. discussion 2216–17. [DOI] [PMC free article] [PubMed] [Google Scholar]
- 2.Freedland SJ, Humphreys EB, Mangold LA, et al. Risk of prostate cancer-specific mortality following biochemical recurrence after radical prostatectomy. JAMA. 2005;294:433–9. doi: 10.1001/jama.294.4.433. [DOI] [PubMed] [Google Scholar]
- 3.Thompson IM, Jr, Tangen CM, Paradelo J, et al. Adjuvant radiotherapy for pathologically advanced prostate cancer: a randomized clinical trial. JAMA. 2006;296:2329–35. doi: 10.1001/jama.296.19.2329. [DOI] [PubMed] [Google Scholar]
- 4.Wiegel T, Bottke D, Steiner U, et al. Phase III postoperative adjuvant radiotherapy after radical prostatectomy compared with radical prostatectomy alone in pT3 prostate cancer with postoperative undetectable prostate-specific antigen: ARO 96-02/AUO AP 09/95. J. Clin. Oncol. 2009;20:2898–9. doi: 10.1200/JCO.2008.18.9563. [DOI] [PubMed] [Google Scholar]
- 5.Bolla M, van Poppel H, Collette L, et al. Postoperative radiotherapy after radical prostatectomy: a randomised controlled trial (EORTC trial 22911) Lancet. 2005;366:572–8. doi: 10.1016/S0140-6736(05)67101-2. [DOI] [PubMed] [Google Scholar]
- 6.Trock BJ, Han M, Freedland SJ, et al. Prostate cancer-specific survival following salvage radiotherapy vs observation in men with biochemical recurrence after radical prostatectomy. JAMA. 2008;299:2760–9. doi: 10.1001/jama.299.23.2760. [DOI] [PMC free article] [PubMed] [Google Scholar]
- 7.Chun FK, Karakiewicz PI, Briganti A. Prostate cancer diagnosis: importance of individualized risk stratification models over PSA alone. Eur. Urol. 2008;54:241–2. doi: 10.1016/j.eururo.2008.05.024. [DOI] [PubMed] [Google Scholar]
- 8.Shariat SF, Karakiewicz PI, Roehrborn CG, Kattan MW. An updated catalog of prostate cancer predictive tools. Cancer. 2008;113:3075–99. doi: 10.1002/cncr.23908. [DOI] [PubMed] [Google Scholar]
- 9.Moreira DM, Presti JC, Jr, Aronson WJ, et al. Definition and preoperative predictors of persistently elevated prostate-specific antigen after radical prostatectomy: results from the Shared Equal Access Regional Cancer Hospital (SEARCH) database. BJU Int. 2010;105:1541–7. doi: 10.1111/j.1464-410X.2009.09016.x. [DOI] [PubMed] [Google Scholar]
- 10.Moreira DM, Presti JC, Jr, Aronson WJ, et al. Natural history of persistently elevated prostate specific antigen after radical prostatectomy: results from the SEARCH database. J. Urol. 2009;182:2250–5. doi: 10.1016/j.juro.2009.07.022. [DOI] [PubMed] [Google Scholar]
- 11.Fitzsimons NJ, Sun LL, Dahm P, et al. A single-institution comparison between radical perineal and radical retropubic prostatectomy on perioperative and pathological outcomes for obese men: an analysis of the Duke Prostate Center database. Urology. 2007;70:1146–51. doi: 10.1016/j.urology.2007.07.065. [DOI] [PubMed] [Google Scholar]
- 12.Schroeck FR, Sun L, Freedland SJ, Jayachandran J, Robertson CN, Moul JW. Race and prostate weight as independent predictors for biochemical recurrence after radical prostatectomy. Prostate Cancer Prostatic Dis. 2008;11:371–6. doi: 10.1038/pcan.2008.18. [DOI] [PubMed] [Google Scholar]
- 13.Cookson MS, Aus G, Burnett AL, et al. Variation in the definition of biochemical recurrence in patients treated for localized prostate cancer: the American Urological Association Prostate Guidelines for Localized Prostate Cancer Update Panel report and recommendations for a standard in the reporting of surgical outcomes. J. Urol. 2007;177:540–5. doi: 10.1016/j.juro.2006.10.097. [DOI] [PubMed] [Google Scholar]
- 14.D'Amico AV, Whittington R, Malkowicz SB, et al. Biochemical outcome after radical prostatectomy, external beam radiation therapy, or interstitial radiation therapy for clinically localized prostate cancer. JAMA. 1998;280:969–74. doi: 10.1001/jama.280.11.969. [DOI] [PubMed] [Google Scholar]
- 15.Kattan MW, Eastham JA, Stapleton AM, Wheeler TM, Scardino PT. A preoperative nomogram for disease recurrence following radical prostatectomy for prostate cancer. J. Natl. Cancer Inst. 1998;90:766–71. doi: 10.1093/jnci/90.10.766. [DOI] [PubMed] [Google Scholar]
- 16.Stephenson AJ, Scardino PT, Eastham JA, et al. Postoperative nomogram predicting the 10-year probability of prostate cancer recurrence after radical prostatectomy. J. Clin. Oncol. 2005;23:7005–12. doi: 10.1200/JCO.2005.01.867. [DOI] [PMC free article] [PubMed] [Google Scholar]
- 17.Cooperberg MR, Pasta DJ, Elkin EP, et al. The University of California, San Francisco Cancer of the Prostate Risk Assessment score: a straightforward and reliable preoperative predictor of disease recurrence after radical prostatectomy. J. Urol. 2005;173:1938–42. doi: 10.1097/01.ju.0000158155.33890.e7. [DOI] [PMC free article] [PubMed] [Google Scholar]
- 18.Moul JW, Connelly RR, Lubeck DP, et al. Predicting risk of prostate specific antigen recurrence after radical prostatectomy with the Center for Prostate Disease Research and Cancer of the Prostate Strategic Urologic Research Endeavor databases. J. Urol. 2001;166:1322–7. [PubMed] [Google Scholar]
- 19.Roberts WW, Bergstralh EJ, Blute ML, et al. Contemporary identification of patients at high risk of early prostate cancer recurrence after radical retropubic prostatectomy. Urology. 2001;57:1033–7. doi: 10.1016/s0090-4295(01)00978-5. [DOI] [PubMed] [Google Scholar]
- 20.Harrell FE, Jr, Califf RM, Pryor DB, Lee KL, Rosati RA. Evaluating the yield of medical tests. JAMA. 1982;247:2543–6. [PubMed] [Google Scholar]
- 21.Svatek RS, Jeldres C, Karakiewicz PI, et al. Pre-treatment biomarker levels improve the accuracy of post-prostatectomy nomogram for prediction of biochemical recurrence. Prostate. 2009;69:886–94. doi: 10.1002/pros.20938. [DOI] [PubMed] [Google Scholar]
- 22.Shariat SF, Walz J, Roehrborn CG, et al. Early postoperative plasma transforming growth factor-beta1 is a strong predictor of biochemical progression after radical prostatectomy. J. Urol. 2008;179:1593–7. doi: 10.1016/j.juro.2007.11.044. [DOI] [PubMed] [Google Scholar]
- 23.Kattan MW, Shariat SF, Andrews B, et al. The addition of interleukin-6 soluble receptor and transforming growth factor beta1 improves a preoperative nomogram for predicting biochemical progression in patients with clinically localized prostate cancer. J. Clin. Oncol. 2003;21:3573–9. doi: 10.1200/JCO.2003.12.037. [DOI] [PubMed] [Google Scholar]
- 24.Eggener SE, Vickers AJ, Serio AM, et al. Comparison of models to predict clinical failure after radical prostatectomy. Cancer. 2009;115:303–10. doi: 10.1002/cncr.24016. [DOI] [PMC free article] [PubMed] [Google Scholar]
- 25.Isharwal S, Miller MC, Epstein JI, et al. Prognostic value of Her-2/neu and DNA index for progression, metastasis and prostate cancer-specific death in men with long-term follow-up after radical prostatectomy. Int. J. Cancer. 2008;123:2636–43. doi: 10.1002/ijc.23838. [DOI] [PMC free article] [PubMed] [Google Scholar]
- 26.Bjartell AS, Al-Ahmadie H, Serio AM, et al. Association of cysteine-rich secretory protein 3 and beta-microseminoprotein with outcome after radical prostatectomy. Clin. Cancer Res. 2007;13:4130–8. doi: 10.1158/1078-0432.CCR-06-3031. [DOI] [PMC free article] [PubMed] [Google Scholar]
- 27.Kinoshita H, Kamoto T, Nishiyama H, Nakamura E, Matsuda T, Ogawa O. Prostate specific antigen nadir determined using ultra-sensitive prostate specific antigen as a predictor of biochemical progression after radical prostatectomy in Japanese males. Int. J. Urol. 2007;14:930–4. doi: 10.1111/j.1442-2042.2007.01858.x. discussion 934. [DOI] [PubMed] [Google Scholar]
- 28.Shen S, Lepor H, Yaffee R, Taneja SS. Ultrasensitive serum prostate specific antigen nadir accurately predicts the risk of early relapse after radical prostatectomy. J. Urol. 2005;173:777–80. doi: 10.1097/01.ju.0000153619.33446.60. [DOI] [PubMed] [Google Scholar]
- 29.Stephenson AJ, Kattan MW, Eastham JA, et al. Defining biochemical recurrence of prostate cancer after radical prostatectomy: a proposal for a standardized definition. J. Clin. Oncol. 2006;24:3973–8. doi: 10.1200/JCO.2005.04.0756. [DOI] [PubMed] [Google Scholar]
- 30.Freedland SJ, Humphreys EB, Mangold LA, Eisenberger M, Partin AW. Time to prostate specific antigen recurrence after radical prostatectomy and risk of prostate cancer specific mortality. J. Urol. 2006;176:1404–8. doi: 10.1016/j.juro.2006.06.017. [DOI] [PubMed] [Google Scholar]