Abstract
In the experiments reported here, the amplitude and the latency of human compound action potentials (CAPs) evoked from a chirp stimulus are compared to those evoked from a traditional click stimulus. The chirp stimulus was created with a frequency sweep to compensate for basilar membrane traveling wave delay using the O-Chirp equations from Fobel and Dau [(2004). J. Acoust. Soc. Am. 116, 2213–2222] derived from otoacoustic emission data. Human cochlear traveling wave delay estimates were obtained from derived compound band action potentials provided by Eggermont [(1979). J. Acoust. Soc. Am. 65, 463–470]. CAPs were recorded from an electrode placed on the tympanic membrane (TM), and the acoustic signals were monitored with a probe tube microphone attached to the TM electrode. Results showed that the amplitude and latency of chirp-evoked N1 of the CAP differed from click-evoked CAPs in several regards. For the chirp-evoked CAP, the N1 amplitude was significantly larger than the click-evoked N1s. The latency-intensity function was significantly shallower for chirp-evoked CAPs as compared to click-evoked CAPs. This suggests that auditory nerve fibers respond with more unison to a chirp stimulus than to a click stimulus.
INTRODUCTION
Electrocochleography is a technique that is used to record electrical potentials generated from cochlear hair cells and auditory nerve. The electrical signal that reflects the synchronous firing of numerous auditory nerve fibers is the compound action potential (CAP). In humans, the CAP can be recorded from an electrode placed on the promontory (Ferraro et al., 1994a), tympanic membrane [TM; Ferraro et al. (1994b)], ear canal, or mastoid (Starr et al., 2001).
Clicks are a commonly used stimulus for CAPs. Clicks have an abrupt onset, are short in duration, and have a broad spectrum. The broad frequency spectrum is meant to evoke responses of numerous nerve fibers along the cochlear partition. Because of temporal delays associated with the high to low cochlear characteristic frequency distributions from base to apex in the cochlea, when using a click stimulus the nerve fiber responses in the basal region of the cochlear partition precede activity in the apical region by several milliseconds (von Bekesy, 1960; Kiang, 1965). This dispersion causes click-evoked auditory nerve fiber responses to occur at different times and thus leads to “smearing” of neural activity that contributes to the CAP. To enhance the unison of neural discharges one can use a stimulus that compensates for these delays.
A chirp stimulus is a signal that can be designed to compensate for basilar membrane delays. A chirp is a transient stimulus with instantaneous frequencies that are delayed. In this study the frequencies are delayed so that low frequencies are presented first and are then followed by high frequencies (i.e., rising frequency chirp). There has been growing interest in using the chirp stimulus for recording human auditory brainstem responses (Dau et al., 2000; Wegner and Dau, 2002; Fobel and Dau, 2004; Junius and Dau, 2005), rat auditory brainstem responses (Spankovich et al., 2008), human acoustic reflexes (Müller-Wehlau et al., 2005), human post-auricular-muscle response (Agung et al., 2005), and human auditory steady-state responses (Elberling et al., 2007; Elberling and Don, 2008). For chirp-evoked CAPs, however, the only previous work is from one of the earliest chirp-experiments, which was conducted by Shore and Nuttall (1985). Shore and Nuttall evoked CAPs from guinea pig ears using “rising frequency-swept tone bursts”—a chirp. They found that, as compared to clicks and reversed chirps, chirp-evoked CAPs had larger N1 amplitudes and longer N1 latencies.
Here we compare chirp-evoked CAPs to click-evoked CAPs. CAPs were recorded from the TM of normal hearing human ears. Our report is the first to describe the affect of a chirp stimulus on human CAPs. We hypothesized that the chirp stimulus, as compared to the click stimulus, would result in larger CAP amplitudes and longer peak latencies.
METHODS
Subjects
Our subjects were sixteen young adults (1 male and 15 females). All subjects had normal hearing sensitivity—hearing thresholds lower than, or equal to, 25 dB HL—from 250 to 8000 Hz. Subjects also had normal otoscopic findings, tympanometric measures, and acoustic reflexes. Participants were informed of the nature of the experiment and participant consent was obtained from each individual. All experimental procedures were approved by the Human Subjects Committee at the University of Kansas Medical Center (HSC No. 7881).
Stimuli
The chirp stimulus was constructed in MATLAB (The Mathworks) using the equations for the “O chirp” provided in Eqs. (2)–(4) of Fobel and Dau (2004). However, instead of using the parameters that relate frequency to basilar membrane delay based on otoacoustic emissions or auditory brainstem responses, we chose parameters from human derived band CAPs (Eggermont, 1979), a physiologic measure similar to what we measure here. Specifically, the relation between basilar membrane delay and frequency is given as
where f is the frequency range (450–10 000 Hz) and c and α are constants (0.69 and −77, respectively).
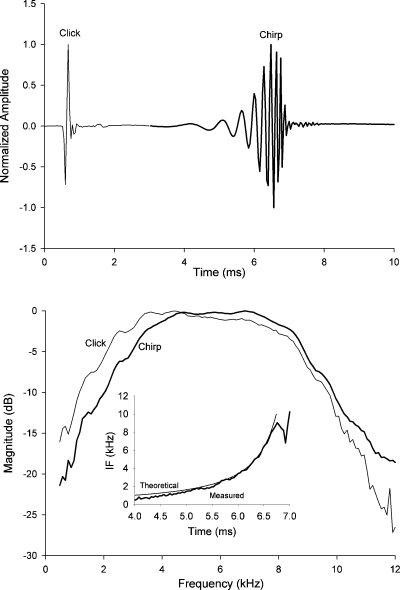
We uploaded our chirp stimulus to our Bio-logic Navigator PRO data acquisition system (version 6.1.0) while our click was created within the Bio-logic system from a 100 microsecond rectangular pulse. Figure 1 shows each of our two stimuli in both the time and frequency domain. For the purposes of making this figure, we recorded these stimuli with a probe microphone (Etymotic Research microphone system, ER-7C) placed inside the tube of the Bio-logic head phone that was later used to deliver these stimuli to subjects’ ears. The top panel illustrates the chirp (solid lines) and click stimulus (thin lines). The bottom panel illustrates the stimulus spectra. Of importance here is the similar spectral content between the click and chirp stimuli. A small difference in spectral contents between the two stimuli exists below 4 kHz where the click stimulus had more energy than the chirp stimulus. The instantaneous frequency of the desired signal (computed) and the acoustically measured chirp stimulus is shown in the inset of the bottom panel. As shown, low frequencies begin at about 4 ms after the onset of the chirp stimulus and are followed by high frequencies.
Figure 1.
Top panel illustrates the acoustic waveforms of the standard click and chirp stimuli. The rising frequency chirp stimulus was constructed in a fashion similar to Fobel and Dau (2004) using a place-frequency map obtained from derived band CAP latencies obtained by Eggermont (1979). The bottom panel is the corresponding spectra. Inset is the instantaneous frequency (IF) of the measured chirp stimulus (thick line) and desired or theoretical IF (thin line).
Acoustic and electrophysiologic recording
During the experiment, the acoustic stimuli were monitored with the probe tube microphone attached to the TM electrode using Super Glue and directed to a Tektronix oscilloscope (TDS 2014). Stimuli were presented at a rate of 11∕sec, and the levels for all stimuli varied between 125–75 dB peak sound pressure level (dB pSPL), decreasing in 10 dB steps. TM electrodes were custom made according to the procedure indicated by Ferraro and Durant (2002). Teflon-coated silver wire was cut to a length of about 50 mm and stripped at both ends. One end of the wire wrapped around a piece of cotton and the opposing end was threaded through medical grade silicon tubing cut to about 38.1 mm in length. The cotton was soaked in electrolyte gel using a 1 cc syringe. The non-cotton portion of the wire was fastened to a copper alligator clip, which was soldered to the end of an electrode cable. The TM electrode was plugged into the preamplifier to be non-inverting. One silver-chloride cup surface electrode was placed on the forehead (inverting) and another on the earlobe ipsilateral to the TM electrode (ground).
Electrical signals were amplified 240 000 times and filtered between 3 and 3000 Hz. Recording epochs were 16 ms in duration and made up of 256 sampling points. CAPs evoked from high stimuli intensities (125 and 115 dB pSPL) were averaged from no more than 1024 stimulus presentations to mitigate the possibility of creating a temporary hearing loss (Lichtenhan and Chertoff, 2008). Responses from the remaining stimulus intensities (105 to 75 dB pSPL) were averaged from 2048 presentations to improve the signal-to-noise ratio. Artifact rejection was not used during the recordings.
Procedures
Pure tone audiometric thresholds were measured. Only subjects with normal hearing were included in this study. After hearing thresholds were determined, the skin was cleaned with NuPrep™ abrasive skin prepping gel to minimize electrode resistance. Subjects were seated in a reclining chair located in a single-walled sound treated booth. While seated upright in the chair, surface electrodes were positioned on the forehead and right ear, then attached using surgical tape. The chair was then reclined so the subject could relax neck musculature and thus help to minimize any physiologic noise. Subjects were directed to reduce the amount of unnecessary movements during the test conditions and to sleep if possible. The TM electrode was put into position. The microphone probe tube connected to the TM electrode was positioned to be less than 8 mm from the ear drum to prevent standing-wave nulls, particularly from the highest frequency content of our stimuli (Gilman and Dirks, 1986). The room lights were turned off at the beginning of the test session. A typical recording session lasted approximately 1 h.
Data analysis
N1 amplitudes were obtained by reading the voltage between the computer’s cursor at the negative peak of the CAP and a second curser at the initial positive or onset of the N1. N1 amplitude was defined as the difference between the voltages obtained from the two cursor positions. N1 latency was defined as the delay from peak of stimulus to peak of N1. Amplitude and latency data were analyzed using a two-factor (click and chirp) analysis of variance (ANOVA) using a within-subject repeated measures (stimuli intensity) design with pairwise T-tests performed post hoc.
RESULTS
Representative subject
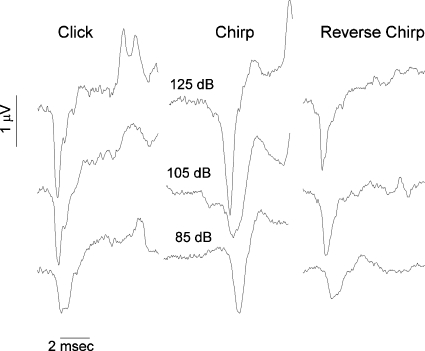
Figure 2 illustrates the click- and chirp-evoked responses from one subject. The stimuli for this example were presented at 125, 105, and 85 dB pSPL. The CAP latency from the chirp stimulus, when compared to that from the click stimulus, was markedly delayed. The N1 amplitude evoked from the chirp was larger than the N1 evoked from the click stimulus at the highest and lowest signals. Also illustrated is that the CAP evoked from the reversed (i.e., falling) chirp—a chirp stimulus in which the high frequency components occurred before the low frequency components (i.e., not compensated for cochlear travel time)—was slightly smaller than that evoked by the click stimulus.
Figure 2.
CAP responses from one subject, evoked by either a click (left panel), chirp (middle panel), or reverse chirp (right panel) stimulus. Responses were obtained at 125, 105, and 85 dB pSPL.
N1 Amplitude
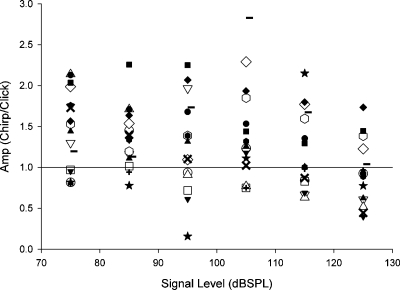
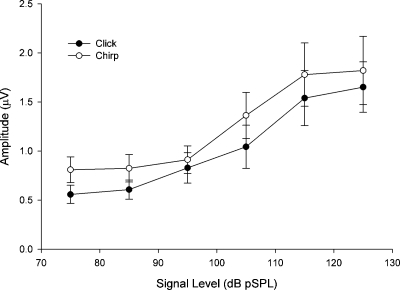
The N1 amplitude evoked from the chirp stimulus was generally larger than that evoked from the click stimulus. Figure 3 shows a scatter plot of the N1 amplitude evoked from the chirp stimulus relative to the N1 amplitude evoked from the click stimulus for all subjects. For most subjects, the N1 evoked from the chirp stimulus was larger, especially for stimuli below about 115 dB pSPL. The actual N1 amplitudes (i.e., not ratios) evoked from the chirp and click stimuli were compared using a two-factor ANOVA within-subjects repeated measures design with stimulus type and intensity as within-subject factors. The sphericity assumption was not met, so the Huynh–Feldt estimate of epsilon was applied for the signal intensity factor. The main effect of stimulus type, F(1,15)=5.233, p<0.05, and the main effect of stimulus intensity, F(2.29,34.38)=19.284, p<0.05 were significant. The stimulus type and intensity interaction was not significant. The effects of stimulus type and intensity are illustrated in Fig. 4.
Figure 3.
Ratio of the amplitude of N1 obtained with the chirp stimulus relative to the amplitude of N1 obtained with the click stimulus for each subject. Data points above 1 indicate that responses obtained from the chirp stimulus were larger than those obtained with the click stimulus.
Figure 4.
Average (±1 SEM) amplitude of N1 computed from all subjects for each signal level used in this study. The open circles represent the mean values for the chirp stimulus and the filled symbols indicate the values for the click stimulus.
N1 latency
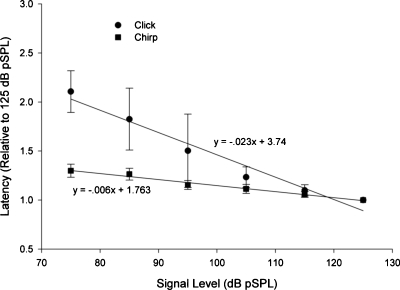
N1 latency evoked from both the click and chirp stimuli decreased as intensity increased from 75 to 125 dB pSPL (Fig. 5). However, the N1 latencies evoked from the click stimulus decreased at a faster rate than N1s evoked from the chirp stimulus. Linear regression analysis indicated a significant linear trend for responses to both the click and chirp stimuli [F(1,93)=319.566, p<0.05 and F(1,92)=730.018, p<0.05, respectively]. The slopes of the regression equations differed with the click latency-intensity slope being approximately four times larger than that of the chirp latency-intensity function. The relation between N1 latency and stimulus intensity was strong, correlations ranging from 0.88 for the click stimulus and 0.94 for the chirp stimulus.
Figure 5.
Average (±1 SD) N1 latencies computed relative to the N1 latency at 125 dB pSPL. Filled circles represent responses to click stimuli and filled squares are responses from chirp stimuli. Linear regression indicated a decrease in N1 latency (re 125 dB pSPL) of −0.006∕dB for the chirp stimulus as opposed to −0.023∕dB for the click stimulus.
DISCUSSION
The goal of this research was to determine how click-evoked CAPs recorded from the TMs of normal hearing humans compare to chirp-evoked CAPs. Our data show that the amplitude of the chirp-evoked N1s were larger than click-evoked N1s. Our reversed chirp stimulus evoked N1 amplitudes that were similar to those evoked from click stimuli, indicating that the delay of the frequencies in the chirp stimulus was the dominant factor contributing to the larger N1 amplitude obtained with the chirp stimulus than the click stimulus. In addition to stimulus-dependent N1 amplitude differences, the N1 latency-intensity function was shallower for the chirp stimulus than that obtained for the click stimulus.
As suggested by other investigators, the large chirp-N1 might be attributable to an improvement in neural synchrony (Shore and Nuttall, 1985). By delaying the frequency components of the chirp stimulus in accordance to the delays of the cochlear characteristic frequency place map we estimated from Eggermont’s (1979) derived band CAPs, our chirp stimulus, theoretically, allows the traveling waves for each frequency to reach maximum displacement at the same time everywhere in the cochlea. This apparently causes all the cochlear frequency places to be displaced at the same time and results in all of the auditory nerve fibers contributing to a CAP to respond in unison.
Our data in Fig. 5 show that the latency-intensity function slope was smaller for the chirp-evoked N1s than for the click-evoked N1s. This effect probably reflects a difference in the length of cochlear partition that is stimulated when using the chirp signal as oppose to the click signal. That is, the chirp signal causes synchronous displacement along a larger portion of the basilar membrane than the click stimulus. With an increase in signal level, there is less distance for the peak displacement to shift toward the base of the cochlea. In contrast, with the click stimulus presented at low signal levels, the basilar membrane displacement is dominated by a more local and apical region than the response to the chirp. As signal level increases, this “local” region shifts toward the base.
It is possible that our chirp’s latency-intensity function in Fig. 5 is influenced primarily by intensity-dependent single-fiber responses, while the click’s latency-intensity function is influenced by basalward spread of excitation. Because the goal of the chirp is to cause single-fibers throughout the length of cochlea to respond in unison, we expect to see similarities between our data and that from a single-fiber. Our Fig. 5 shows an approximately 0.3 ms latency difference between the peak of the CAP evoked from our lowest intensity chirp stimulus and that evoked from our highest intensity chirp. A roughly 0.3 ms latency difference is also seen between the peak of low- and high-intensity time-domain waveforms single-fiber responses in Fig. 14.A of Recio-Spinoso et al. (2005) and also from basilar membrane responses in Fig. 2.A of Recio-Spinoso et al. (2009). This suggests that our chirp stimulus yields unison responses among single-fiber responses that are intensity independent and that the chirp-evoked CAPs closely resemble single-fiber responses.
Although Fig. 4 shows that the chirp-evoked N1 amplitude was larger than the click-evoked N1 amplitude, our ANOVA results did not show any statistically significant interaction with stimulus intensity. However, as shown in Fig. 3 more subjects clearly had larger chirp-evoked N1 amplitudes, particularly for stimulus intensities below 125 dB pSPL. This finding is consistent with Fobel and Dau (2004) who showed larger auditory brainstem responses at low stimulus intensities as compared with high stimulus intensities, especially when the frequency delay of the chirp was designed from latency-intensity functions using tone-burst evoked auditory brainstem responses and not necessarily from otoacoustic emissions. The lack of the interaction in our present study could have been due to the lack of statistical power.
A stimulus that evokes larger N1s than the more traditionally used click stimulus would be useful for clinical application. Patients with sensorineural hearing loss often have poor evoked-potential waveform morphology, small peak amplitudes, and increased absolute latency. We have shown that chirp-evoked CAPs recorded from human TM have enhanced CAP morphology and larger peak amplitudes than those recorded with click stimuli. The chirp enhanced attributes we report here may potentially facilitate stimulation of auditory nerve fibers that remain in ears with sensorineural hearing loss. Such improvement of stimulation in ears with sensorineural hearing loss may lead to (1) better estimates of auditory threshold then presently available, (2) an improved estimate of wave 1 of the ABR to determine inter-peak intervals for neurological evaluation in patients with peripheral hearing loss, and (3) a technique development to assess auditory nerve survival by evoking responses from auditory nerve fibers across a broader region of the cochlea.
ACKNOWLEDGMENTS
We thank Christopher A. Shera for several helpful discussions on this research. J.T.L. was supported by grants from the University of Kansas Medical Center Biomedical Research Training Program and Grant No. F32 DC010112 from the NIDCD, National Institutes of Health.
References
- Agung, K., Purdy, S., Patuzzi, R. B., O’Beirne, G., and Newall, P. (2005). “Rising frequency chirps and headphones with extended high frequency response enhance the post-auricular muscle response,” Int. J. Audiol. 44, 631–636. 10.1080/14992020500266613 [DOI] [PubMed] [Google Scholar]
- Dau, T., Wegner, O., Mellert, V., and Kollmeier, B. (2000). “Auditory brainstem responses with optimized chirp signals compensating basilar-membrane dispersion,” J. Acoust. Soc. Am. 107, 1530–1540. 10.1121/1.428438 [DOI] [PubMed] [Google Scholar]
- Eggermont, J. J. (1979). “Narrow-band AP latencies in normal and recruiting human ears,” J. Acoust. Soc. Am. 65, 463–470. 10.1121/1.382345 [DOI] [PubMed] [Google Scholar]
- Elberling, C., and Don, M. (2008). “Auditory brainstem responses to a chirp stimulus designed from derived-band latencies in normal-hearing subjects,” J. Acoust. Soc. Am. 124, 3022–3037. 10.1121/1.2990709 [DOI] [PMC free article] [PubMed] [Google Scholar]
- Elberling, C., Don, M., Cebulla, M., and Sturzebecher, E. (2007). “Auditory steady-state responses to chirp stimuli based on cochlear traveling wave delay,” J. Acoust. Soc. Am. 122, 2772–2785. 10.1121/1.2783985 [DOI] [PubMed] [Google Scholar]
- Ferraro, J. A., and Durant, J. D. (2002). “Electrocochleography,” in Handbook of Clinical Audiology, 5th edition, edited by Katz J. (Lippincott Williams & Wilkins, Philadelphia, PA: ), pp. 249–273. [Google Scholar]
- Ferraro, J. A., Blackwell, W. L., Mediavilla, S. J., and Thedinger, B. S. (1994b). “Normal summating potential to tone bursts recorded from the TM in humans,” J. Am. Acad. Audiol 5, 17–23. [PubMed] [Google Scholar]
- Ferraro, J. A., Thedinger, B. S., Mediavilla, S. J., and Blackwell, W. L. (1994a). “Human summating potential to tone bursts: Observations on TM versus promontory recordings in the same patients,” J. Am. Acad. Audiol 5, 24–29. [PubMed] [Google Scholar]
- Fobel, O., and Dau, T. (2004). “Searching for the optimal stimulus eliciting auditory brainstem responses in humans,” J. Acoust. Soc. Am. 116, 2213–2222. 10.1121/1.1787523 [DOI] [PubMed] [Google Scholar]
- Gilman, S., and Dirks, D. D. (1986). “Acoustics of ear canal measurement of eardrum SPL in simulators,” J. Acoust. Soc. Am. 80, 783–793. 10.1121/1.393953 [DOI] [PubMed] [Google Scholar]
- Junius, D., and Dau. T. (2005). “Influence of cochlear traveling wave and neural adaptation on auditory brainstem responses,” Hear. Res. 205, 53–67. 10.1016/j.heares.2005.03.001 [DOI] [PubMed] [Google Scholar]
- Kiang, N. Y. S. (1965). “Discharge patterns of single fibers in the cat’s auditory nerve,” in M.I.T. Research Monograph No. 35 (MIT, Cambridge, MA: ). [Google Scholar]
- Lichtenhan, J. T., and Chertoff, M. E. (2008). “Temporary hearing loss influences post-stimulus time histogram and single neuron action potential estimates from human compound action potentials,” J. Acoust. Soc. Am. 123, 2200–2212. 10.1121/1.2885748 [DOI] [PMC free article] [PubMed] [Google Scholar]
- Müller-Wehlau, M., Mauermann, M., Dau, T., and Kollmeier, B. (2005). “The effects of neural synchronization and peripheral compression on the acoustic-reflex threshold,” J. Acoust. Soc. Am. 117, 3016–3027. 10.1121/1.1867932 [DOI] [PubMed] [Google Scholar]
- Recio-Spinoso, A., Narayan S. S., and Ruggero M. A. (2009). “Basilar membrane responses to noise at a basal site of the chinchilla cochlea: Quasi-linear filtering,” J. Assoc. Res. Otolaryngol. 10, 471–484. 10.1007/s10162-009-0172-0 [DOI] [PMC free article] [PubMed] [Google Scholar]
- Recio-Spinoso, A., Temchin A. N., van Dijk P., Fan Y. H., and Ruggero M. A. (2005). “Wiener-kernel analysis of responses to noise of chinchilla auditory-nerve fibers,” J. Neurophysiol. 93, 3615–3634. 10.1152/jn.00882.2004 [DOI] [PubMed] [Google Scholar]
- Shore, S. E., and Nuttall, A. L. (1985). “High-synchrony cochlear compound action potentials evoked by rising frequency-swept tone bursts,” J. Acoust. Soc. Am. 78, 1286–1295. 10.1121/1.392898 [DOI] [PubMed] [Google Scholar]
- Spankovich, C., Hood, L. J., Grantham, D. W., and Polley, D. B. (2008). “Application of frequency modulated chirp stimuli for rapid and sensitive ABR measurements in the rat,” Hear. Res. 245, 92–97. 10.1016/j.heares.2008.09.001 [DOI] [PubMed] [Google Scholar]
- Starr, A., Sininger, Y., Nguyen, T., Michalewski, H. J., Oba, S., and Abdala, C. (2001). “Cochlear receptor (microphonic and summating potentials, otoacoustic emissions) and auditory pathway (auditory brain stem potentials) activity in auditory neuropathy,” Ear Hear. 22, 91–99. 10.1097/00003446-200104000-00002 [DOI] [PubMed] [Google Scholar]
- von Bekesy, G. (1960). Experiments in Hearing (McGraw-Hill, New York: ). [Google Scholar]
- Wegner, O., and Dau, T. (2002). “Frequency specificity of chirp-evoked auditory brainstem responses,” J. Acoust. Soc. Am. 111, 1318–1329. 10.1121/1.1433805 [DOI] [PubMed] [Google Scholar]


