Abstract
Purpose: The purpose of this work is to determine the statistical correlation between per-beam, planar IMRT QA passing rates and several clinically relevant, anatomy-based dose errors for per-patient IMRT QA. The intent is to assess the predictive power of a common conventional IMRT QA performance metric, the Gamma passing rate per beam.
Methods: Ninety-six unique data sets were created by inducing four types of dose errors in 24 clinical head and neck IMRT plans, each planned with 6 MV Varian 120-leaf MLC linear accelerators using a commercial treatment planning system and step-and-shoot delivery. The error-free beams∕plans were used as “simulated measurements” (for generating the IMRT QA dose planes and the anatomy dose metrics) to compare to the corresponding data calculated by the error-induced plans. The degree of the induced errors was tuned to mimic IMRT QA passing rates that are commonly achieved using conventional methods.
Results: Analysis of clinical metrics (parotid mean doses, spinal cord max and D1cc, CTV D95, and larynx mean) vs IMRT QA Gamma analysis (3%∕3 mm, 2∕2, 1∕1) showed that in all cases, there were only weak to moderate correlations (range of Pearson’s r-values: −0.295 to 0.653). Moreover, the moderate correlations actually had positive Pearson’s r-values (i.e., clinically relevant metric differences increased with increasing IMRT QA passing rate), indicating that some of the largest anatomy-based dose differences occurred in the cases of high IMRT QA passing rates, which may be called “false negatives.” The results also show numerous instances of false positives or cases where low IMRT QA passing rates do not imply large errors in anatomy dose metrics. In none of the cases was there correlation consistent with high predictive power of planar IMRT passing rates, i.e., in none of the cases did high IMRT QA Gamma passing rates predict low errors in anatomy dose metrics or vice versa.
Conclusions: There is a lack of correlation between conventional IMRT QA performance metrics (Gamma passing rates) and dose errors in anatomic regions-of-interest. The most common acceptance criteria and published actions levels therefore have insufficient, or at least unproven, predictive power for per-patient IMRT QA.
Keywords: IMRT QA, IMRT, quality assurance
INTRODUCTION
In modern radiation therapy, each patient treatment plan is customized and unique. In the case of intensity-modulated radiation therapy (IMRT), each treatment field can be highly complex and justifies quality assurance (QA) to verify (1) the treatment planning system’s (TPS) ability to calculate the dose accurately and (2) the delivery system’s ability to deliver the dose accurately. A very common method of per-beam planar IMRT QA is to measure the dose to a flat phantom and compare to the TPS calculated dose in the same geometry, a method summarized in a recent published survey.1
Published studies on IMRT QA acceptance criteria
There have been many studies on suggested acceptance∕action levels for planar IMRT QA.2, 3, 4, 5, 6, 7 Some of these studies base action levels on retrospective statistical analysis of the performance levels∕metrics that have been achieved over many plans and IMRT beams.2, 3, 4, 5 It has been suggested that meeting such action levels should be a requirement in order to take part in clinical trials.6 In a recent report of the AAPM Task Group 119 (Ref. 5) and, in fact, the other studies2, 3, 4 as well, the “3%∕3 mm” criteria is common, employed as either the composite distance-to-agreement (DTA) metric or the Gamma index.8 It is not surprising then that the 3% dose difference and 3 mm DTA criteria were reported as those most commonly used by clinicians1 in per-patient, planar IMRT QA.
Are the standard acceptance criteria adequate?
However, despite these retrospective studies and many years of clinical IMRT treatments, the following have not been proven: (1) The power of the accepted methods and performance metrics to predict clinically relevant patient dose errors and (2) the certainty to which abiding the standards mitigates risk of significant error. In other words, there have not yet been correlation studies to prove (or disprove) if these accepted methods for IMRT QA and their associated acceptance criteria are good predictors of clinically relevant patient dose errors in per-patient IMRT QA, though such studies have been suggested by Nelms et al.,1 who wrote: “Before we define standards, it would be useful to connect the conventional planar QA analyses to their resulting impact on the overall plan, using clinically relevant metrics.” In fact, one can imagine scenarios of “false positives” in IMRT QA (where beam-by-beam QA results fail to meet criteria, yet clinical impact is negligible) as well as “false negatives” (where beam-by-beam QA meets criteria, yet relevant and actionable patient dose errors still occur). In either scenario, the magnitude and locations of the errors (and where they overlap when all sub-beams are summed) may prove more important than the quantity of errors, i.e., the “passing rate” per field. For example, one cannot assume that a field achieving a 95% passing rate for a standard 3%∕3 mm Gamma analysis is necessarily safer than one achieving only 85% for any specific patient IMRT field (though it may imply a better commissioned TPS or delivery system). In fact, a recent work9 has illustrated insensitivities of per-beam dose plane QA in predicting IMRT QA errors.
The purpose of this work is to explore the statistical correlation of conventional IMRT QA performance metrics to per-patient∕plan clinically relevant dose difference metrics and, in the process, determine if today’s standards and published action levels (which have been based on the statistics of what is commonly achieved) are justified.
MATERIALS AND METHODS
Experimental design and data acquisition
Twenty-four clinically approved and treated head and neck IMRT treatment plans were chosen from our database and fully anonymized for the purpose of this study. All plans were generated using the Pinnacle TPS (Philips Radiation Oncology Systems, Fitchburg, WI) using 6 MV x-ray beams from Varian (Palo Alto, CA) linear accelerators with 120-leaf MLC. Head and neck IMRT plans are highly complex, with multiple target volumes as well as multiple organs at risk distributed throughout the treatment volume, and hence these plans were desirable for QA sensitivity and specificity analysis.
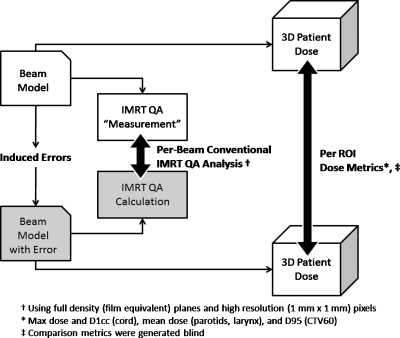
A schematic of our simulation methodology is summarized in Fig. 1. It is important to note that inducing beam model errors serves the purpose of creating dose differences that can be simulated and quantified in both the planar IMRT QA schema as well as in the patient model. The point was not to study beam model errors per se, but rather to create a system where IMRT QA metrics and patient anatomy-based dose differences could be quantified and used to study statistical correlation. In all cases, the error-free beam model was used as the “simulated measurement” for the IMRT QA dose planes and patient dose. The degree of the errors induced for this study were selected to result in realistic IMRT QA performance metrics, i.e., passing rates commonly accepted in clinical practice without further investigation.
Figure 1.
Schematic of the methodology of data generation for the correlation study.
In order to simulate errors with impact on dose gradients and dose levels, we generated four experimental beam models. Two beam models were modified to calculate a shallower penumbra than the error-free model, while the other two beam models were modified by (1) halving and (2) doubling the MLC transmission of the error-free model. For the first two beam models, hereafter called the shallow penumbra beam model (SPBM) and the very shallow penumbra beam model (VSPBM), we modified the error-free penumbra (80%–20%) of 4.5 (Dmax) and 5.9 mm (depth 10 cm) for a 10×10 cm2 open field in a water phantom, calculated on a 1 mm×1 mm×1 mm dose grid. The modified SPBM penumbra (80%–20%) was 7.2 (Dmax) and 9.2 mm (depth 10 cm). The modified VSPBM penumbra (80%–20%) was 8.6 (Dmax) and 11.0 mm (depth 10 cm). The third experimental model was the high transmission beam model, for which the error-free MLC transmission (1.94%) was doubled (3.88%). The final experimental model was the low transmission beam model, for which the MLC transmission was halved (0.97%).
For each of the 24 head and neck patients, four new IMRT plans were generated using each of the modified beam models that have been described above and each employing the same dose objectives and number of iterations. All 3D patient plans were calculated on a 4 mm×4 mm×4 mm dose grid. QA dose planes were calculated with the following parameters: 1 mm×1 mm resolution, normal to the beam axis at source-to-plane distance 100 cm, depth 10 cm, in a flat homogeneous phantom, and using the patient plan beam MU. (Note: Using this method simulates a full density and high resolution IMRT QA plane, i.e., equivalent to an ideal film and not the sparse density of commercial arrays made of diodes or ion chambers.) Then, the same 96 plan doses were recalculated using the error-free beam model but with all other parameters held constant (i.e., all beam parameters, IMRT segment shapes and weights, and the monitor units for each segment∕beam were set equal to those arrived at in the original optimization with the modified beam models). Thus, the only sources of variation between the 96 pairs of plans were the beam model modifications. The following data were exported from the TPS per-patient plan: (1) DICOM RT plan, (2) DICOM RT structure set, (3) 3D patient dose volume as DICOM RT dose, and (4) 2D dose planes as ASCII text files per beam. In this study, the error-free beam model was used to produce virtual measurements on the virtual linear accelerator. This allows for a controlled study since it eliminates output variations present in a real medical linear accelerator and allows one to compare planar IMRT QA films of optimal data density, independent of any density or resolution limitations of commercial arrays.
Correlation of IMRT QA metrics vs clinical metrics
The “simulated-measured” and planned QA planar dose planes were analyzed using MAPCHECK software (Sun Nuclear Corporation) employing the Gamma passing rate metric, which is a common metric employed in conventional IMRT QA. QA scores (percentage of dose points with a gamma value less than 1) were generated for each pair of planes using the following Gamma criteria: 1%∕1 mm, 2%∕2 mm, and 3%∕3 mm, where the percent is the per-voxel dose difference given as a percent of global normalization dose and the distance is the distance-to-agreement criterion. Dose values below 10% of the per-beam normalization (max) dose were ignored. 3DVH software (Sun Nuclear Corporation), an IMRT QA software module capable of quantifying 3D dose comparisons, was used to generate the following anatomy dose metrics for select volumes: Spinal cord max dose, spinal cord dose to 1 cc (D1cc), contralateral parotid mean dose, ipsilateral parotid mean dose, larynx mean dose, and CTV60 dose to 95% volume (D95). These anatomy dose metrics were generated for both the planned and the simulated-measured patient dose. The resulting absolute values of the errors of the clinical dose metrics were plotted vs IMRT QA performance metrics (Gamma passing rates as %). The term dose metric “error” is used throughout this paper to quantify the difference between the actual dose (generated using the error-free system) and the expected∕planned dose (generated using the error-induced system) relative to the expected∕planned dose. The dose errors are thus calculated according to the following equations:
To assess correlation, simple linear regression lines and their corresponding Pearson product moment correlation values, hereafter simply denoted as Pearson’s r-values, were generated. In order to quantify the incidence of false negatives, the ranges of the observed clinical dose metric errors along with the average absolute errors were generated for populations of IMRT QA performance metrics with 95+% conventional QA passing rates using 3%∕3 mm, 2%∕2 mm, and 1%∕1 mm Gamma.
RESULTS
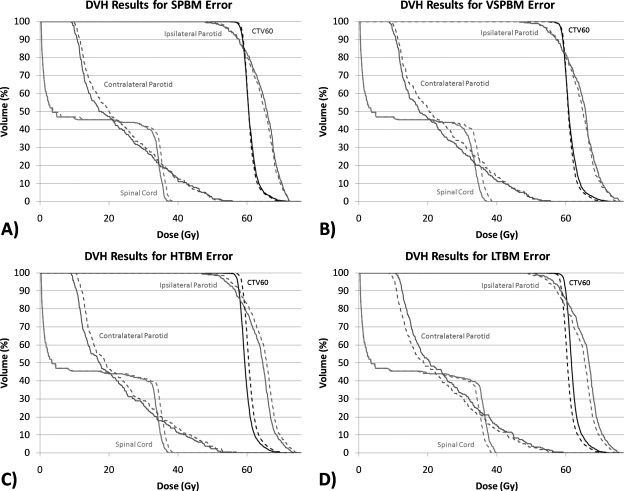
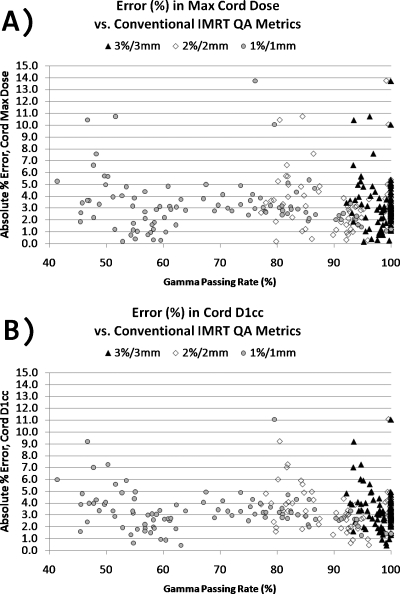
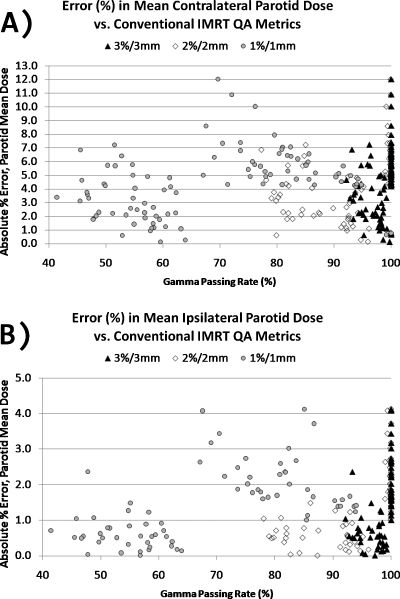
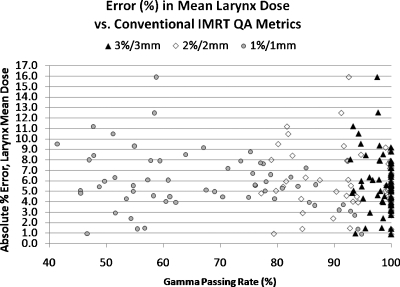
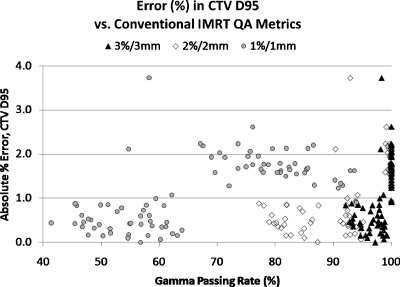
Figure 2 illustrates, for the sake of example, the DVH variation of the error-induced beams vs error-free beams for one of the 24 plans studied. Figures 3456 show the magnitude of the anatomy-based dose difference metrics (ordinate) vs conventional IMRT QA passing rates (3%∕3 mm, 2%∕2 mm, and 1%∕1 mm Gamma, global percent normalization to field max, 10% lower threshold cutoff). For each point, the average IMRT QA passing rate (of all fields in each plan) was used as the abscissa value. The r-values are shown in Table 1 along with the respective p-values. Table 2 gives the ranges and the sample standard deviations of the clinical dose errors for plans exceeding 95% passing rates for two sets of Gamma analyses (3%∕3 mm and 2%∕2 mm) and exceeding 90% passing rates for Gamma analysis at 1%∕1 mm.
Figure 2.
Sample DVH differences between the induced-error beam models (dashed lines) and the virtual measurement beam models (solid lines). These are the results for patient plan no. 22 (of 24).
Figure 3.
Magnitude of errors in the maximum cord dose and the cord D1cc vs the conventional IMRT QA performance metric of passing rate (%) averaged over all beams per plan, shown for three different sets of Gamma parameters.
Figure 4.
(a) Magnitude of errors in the mean contralateral parotid dose vs conventional IMRT QA performance metric of Gamma passing rate (%) averaged over all beams per plan. (b) Magnitude of errors in the mean ipsilateral parotid dose vs conventional IMRT QA performance metric of Gamma passing rate (%) averaged over all beams per plan. Data are shown for three different sets of Gamma parameters.
Figure 5.
Magnitude of errors in the mean larynx dose vs the conventional IMRT QA performance metric of passing rate (%) averaged over all beams per plan, shown for three different sets of Gamma parameters
Figure 6.
Magnitude of errors in CTV60’s D95 dose vs the conventional IMRT QA performance metric of passing rate (%) averaged over all beams per plan, shown for three different sets of Gamma parameters
Table 1.
Pearson correlation values (r) and two-tailed p-values correlating the magnitude of anatomy dose errors to three IMRT QA Gamma passing rate performance metrics. Significant p-values (p<0.01) are italicized for emphasis. (Note: The statistically significant correlations have positive r-value (positive slope) indicating that the highest critical dose errors happen at the higher Gamma passing rates.)
| IMRT QA criteriaa | Spinal cord D1cc error | Contralateral parotid mean dose error | Ipsilateral parotid mean dose error | Larynx mean dose error | CTV D95 error | |||||
|---|---|---|---|---|---|---|---|---|---|---|
| r | p -value | r | p -value | r | p -value | r | p -value | r | p -value | |
| 3%∕3 mm | −0.183 | 0.07 | 0.328 | <0.01 | 0.523 | <0.01 | −0.167 | 0.20 | 0.604 | <0.01 |
| 2%∕2 mm | −0.141 | 0.17 | 0.118 | 0.25 | 0.588 | <0.01 | −0.134 | 0.31 | 0.653 | <0.01 |
| 1%∕1 mm | −0.130 | 0.21 | 0.10 | 0.33 | 0.551 | <0.01 | −0.295 | 0.022 | 0.619 | <0.01 |
Analysis criteria method: Global % difference (normalized to max dose), 10% lower threshold, and γ index≤1 as the passing criterion.
Table 2.
Range of errors (%) and mean absolute errors (%) for clinically relevant metrics in the case of all plans (N) meeting a specified threshold Gamma passing rate for three sets of Gamma parameters
| Anatomy dose metric | Observed errorsa (%) in DVH dose metrics for plans exceeding ≥95% passing rateb (3∕3 and 2∕2 criteria) and exceeding ≥90% passing rateb (1∕1 criteria) | |||
|---|---|---|---|---|
| 3%∕3 mm (N=83) | 2%∕2 mm (N=51) | 1%∕1 mm (N=12) | ||
| Spinal cord | Range of % Errors | [−11.1, 15.7] | [−11.1, 15.7] | [−2.7, 3.3] |
| D1cc | Mean absolute errorc (%) | 3.222 | 3.367 | 2.309 |
| Contralateral | Range of % errors | [−10.9, 12.0] | [−10.9, 12.0] | [−5.1, 5.7] |
| Parotid mean | Mean absolute errorc (%) | 4.50 | 5.52 | 4.04 |
| Ipsilateral | Range of % errors | [−3.7, 4.1] | [−3.7, 4.1] | [−1.4, 1.7] |
| Parotid mean | Mean absolute errorc (%) | 1.49 | 2.06 | 1.45 |
| Larynx mean | Range of % errors | [−15.9, 9.2] | [−7.6, 9.2] | [−3.2, 3.7] |
| Mean absolute errorc (%) | 5.66 | 5.32 | 2.50 | |
| CTV D95 | Range of % errors | [−3.7, 2.6] | [−2.2, 2.6] | [−1.6, 1.6] |
| Mean absolute errorc (%) | 1.26 | 1.66 | 1.30 | |
Error ranges and the mean absolute errors are given as percent errors (%) using the error-free plans as the baseline.
Analysis criteria method: Global % difference (normalized to max dose), 10% lower threshold, and γ index≤1 as the passing criterion.
The average of error magnitudes, i.e., absolute values of errors (%).
These data clearly show that there are only weak to moderate correlations between conventional IMRT QA performance metrics and anatomy-based dose difference metrics, as evidenced by their corresponding Pearson’s r-values (cf. Table 1). Moreover, all moderate correlations (0.3<|r|<0.7) and statistically significant p-values (p<0.05) have positive Pearson’s r-values, indicating that the larger clinical errors happen for higher IMRT QA Gamma passing rates. This suggests a large incidence of false negatives. As evidenced in Figs. 3456 and Table 2, some of the largest errors to critical structures occurred when IMRT QA results were very high (95% or above). From this, one can conclude that conventional IMRT QA metrics do not necessarily predict the likelihood of clinically relevant dose difference metrics and that significant errors that could lead to the induction of unwanted normal tissue toxicities if the dose is pushed above currently acceptable dose tolerance values or to a decrease in expected local tumor control (+14.8% max cord dose error, +12.0% mean parotid dose error, +9.2% mean larynx dose error, and −3.7% CTV D95 error) happen even at the highest levels of conventional IMRT QA success.
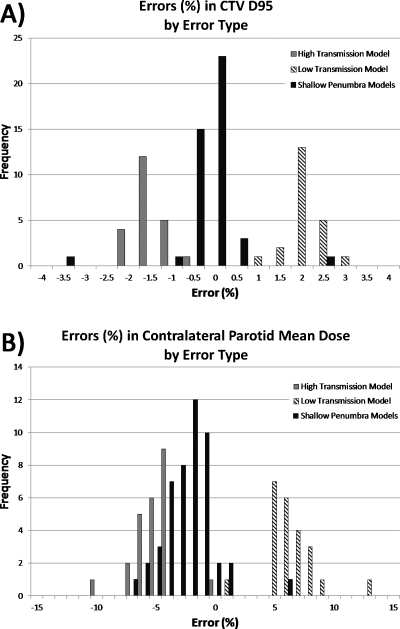
Patient dose errors due to different induced error types are shown in Fig. 7 for two of the critical anatomy dose metrics (CTV D95 and contralateral parotid mean dose, chosen because these exhibited a small range and a large range of errors, respectively).
Figure 7.
Distribution of errors in two critical anatomy dose metrics for three types of errors induced. (a) Errors in CTV D95 (low range of errors, overall) and (b) errors in contralateral parotid mean dose (higher range of errors).
DISCUSSION
These results show there are only weak to moderate correlations between conventional IMRT QA performance metrics and clinically relevant dose difference metrics, with the moderate correlation∕statistically significant cases having a positive slope, indicating that many of the larger critical errors in patient dose are occurring even when QA Gamma passing rates are high. In fact, some of the largest anatomy-based dose differences occurred in cases where the IMRT QA passing rates were 95%–100% (3%∕3 mm Gamma). Instances of high IMRT QA passing rates despite high anatomy-based dose differences can be called false negatives, i.e., the IMRT QA Gamma passing rates, if taken alone, would lead one to conclude that there are no problems. Similarly, the results also show instances of low IMRT QA passing rates without any large differences in the anatomy-based dose metrics, which could be called false positives.
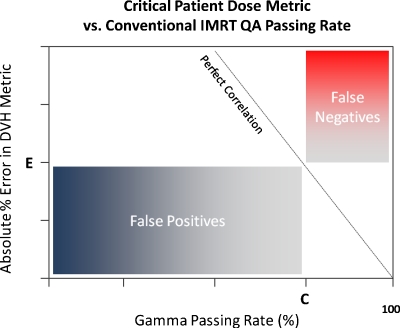
It can be concluded that Gamma passing rates, a very common conventional measured vs calculated QA performance metric, though perhaps useful in general commissioning of a system (TPS∕delivery) or in catching gross errors, are clearly not sensitive to clinically relevant patient dose errors on a per-patient∕plan basis. These findings call into question the value of conventional, per-beam QA methods employed for per-patient IMRT dose QA. First of all, it is intuitive that with per-patient dose errors, the importance is the location and overlap of these per-beam errors in terms of critical volumes (targets and organs at risk) and not about per-beam passing rates in a phantom. Take, as an example of a false negative, a hypothetical IMRT plan where there are small regions of “hot” dose error in each field but not so large in size that the IMRT QA passing rate falls below, say, 95%. If those regions of higher-than-planned dose all overlap exactly at one portion of the spinal cord, there could be dire consequences. The anatomy-specific impact of these types of errors is not captured by conventional per-beam metrics, which do not have weight factors of errors vis-à-vis anatomy intersections. As an example of a false positive, consider another hypothetical IMRT plan where each field exhibits low IMRT QA passing rates due to both hot and cold regions. However, suppose that these hot and cold regions do not overlap in any particular pattern in 3D and, rather, somewhat cancel each other (or at least dilute each other in magnitude) resulting in critical volume dose metrics that are not compromised beyond tolerance. In fact, in the case of a false positive, it is possible that the critical dose metrics of the true 3D patient dose may be superior to the planned dose. Figure 8 illustrates the regions of false positives (low QA passing rates but with noncritical patient dose errors) and regions of false negatives (high QA passing rates despite critical patient dose errors) which may be useful when examining Figs. 3456.
Figure 8.
Generalized illustration of regions of false negatives (high passing rates despite critical patient dose errors) and false positives (low QA passing rates but with noncritical patient dose errors) when correlating critical patient dose errors to conventional IMRT QA Gamma passing rates. In this schematic, the critical dose error threshold is “E” and the standard acceptance criteria for Gamma passing rates is “C.”
The conventional wisdom of percent difference∕DTA-based criteria was based on commissioning TPS dose calculation algorithms and not on per-patient QA.7 In fact, when commissioning a treatment planning or dose delivery system, these conventional methods may be useful, as they provide quantified metrics that a physicist can use to optimize aspects of a beam model (or beam delivery) by comparing calculations to measurements (in phantom) and rigorously tuning the system for highest accuracy and consistency. However, in per-patient IMRT dose QA, the DTA (and the even more lenient Gamma) might hide significant errors. The current standard of 3 mm DTA is quite large considering that today’s margins in the area of image guidance are often near this level. It is easily shown, for instance, that if one shifts a very conformal 3D dose grid by 3 mm, the planned DVHs become quite unacceptable even though the “3 mm” criterion will still be met. Likewise, the use of global percent difference (normalize error percentages to the max dose in a plan or in a field) can hide significant low dose errors that may overlap in critical structures where an organ tolerance is already near its limit. The potential for such errors is illustrated by the error ranges in Table 2, as all of these observed errors happened for plans where the average IMRT QA passing rate was 95% or greater (3%∕3 mm and 2%∕2 mm). Employing 1%∕1 mm criteria closed the tolerance substantially.
One might question if our methodology and results are merely a function of the contrived nature of the induced errors, but for the sake of correlation studies, the methods of error induction are not of primary importance. We merely needed to induce differences in the treatment beams and then quantify how those differences manifest in the patient dose. In fact, the induced errors used in this work, though not comprehensive, widely cover two possible categories of errors in radiation therapy, namely, dose profile shape and dose magnitude. Dose profile shapes (gradient differences) were induced with shallow penumbra beam models. Dose magnitude changes were induced by the modified MLC transmission beam models. The “high transmission” model’s simulated measurements showed lower dose in actuality, while the “low transmission” model’s simulated measurements were slightly higher. All of this is clearly illustrated in Fig. 7.
It must be restated that the induced errors in this study were purposely designed to give conventional Gamma passing rates similar to those commonly seen in practice. With this in mind, the observed potential for dose errors in critical anatomy and the clear lack of correlation are troubling. It is possible that an expected trend of correlation might appear if we had induced much larger or even catastrophic errors (wrong fields delivered, wrong beam energies, gross MU errors, etc.). Additional studies on larger induced errors and∕or on different types of errors would be interesting. However, for the sake of this study, we focused exclusively on the QA passing rates that are above, or at least near, commonly accepted levels. It could be argued that any proposed QA standards (i.e., methods, performance metrics, acceptance criteria, tolerances, etc.) should be proven effective∕sensitive∕predictive before they are recommended as standards and their weaknesses and potential failures should be carefully documented. It is not valuable to keep searching for instances where the current methods “might work” if enough evidence has been shown to the contrary. The results of this work certainly call into question the utility of the 3%∕3 mm Gamma passing rates5 as an adequate metric for per-patient IMRT QA.
This study has focused on “per-field” planar dose analysis, a method which is less relevant for rotational treatments such as tomotherapy or VMAT. For rotational therapy, 3D dosimetry phantoms are used and composite dose (from all sub-beams) is measured and compared to the TPS calculation of the plan-on-phantom. It is of vital importance that correlation studies should also be performed for these types of commercial phantoms with their varying detector locations. Intuitively, one might expect that the QA phantom dose analysis might only correlate with anatomy-based dose differences if the detectors overlap in 3D where the critical structures are, which is different for each patient. However, nothing has been proven yet either supporting or questioning the usefulness of these 3D phantom methods or designs and they are also in need of similar correlation studies.
Finally, it could be argued that the methodology of basing action levels on prior performance achievements2, 3, 4, 5, 6 is not warranted because meeting these criteria does not ensure that clinically acceptable dose errors are within tolerance per patient. The converse is true as well, i.e., not meeting IMRT QA performance goals does not imply that clinically relevant dose differences would be significant.
Clearly, given the uniqueness and complexity of each and every radiation therapy plan, one possible per-patient dose QA methodology to pursue is to accurately estimate the impact of errors on patient anatomy dose metrics. Software systems that estimate patient dose errors based on measurements have become available such as the COMPASS system (IBA-Wellhofer), DOSIMETRYCHECK (Math Resolutions LLC), and 3DVH (Sun Nuclear Corporation). These systems show promise, but their accuracy must be established as they are to be employed as “virtual measurements” of patient dose which are then compared to the original TPS plan. In the absence of such systems, it must be realized that high passing rates in conventional IMRT QA do not alone imply accurate dose calculation and∕or delivery and steps should be taken to analyze where the per-beam errors overlap in 3D space in relation to critical structures.
CONCLUSIONS
There is a lack of correlation between conventional IMRT QA performance metrics (Gamma passing rates) and dose differences in critical anatomic regions-of-interest. The most common acceptance criteria and published actions levels therefore have insufficient, or at least unproven, predictive power for per-patient IMRT QA. Moreover, the methodology of basing action levels on prior performance achievements using these conventional methods is unwarranted because meeting these criteria does not ensure that clinically acceptable dose errors.
ACKNOWLEDGMENTS
The authors wish to thank Sun Nuclear Corporation for allowing us the use of a prerelease version of the 3DVH analysis software to generate the patient∕anatomy DVHs and metrics. Partial support of this work through a grant (Grant No. R01-109656) from the National Cancer Institute is gratefully acknowledged.
Conflict of interest: Dr. Nelms serves as a paid consultant to Sun Nuclear Corporation. However, this work was neither funded nor requested as part of that consultancy.
References
- Nelms B. E. and Simon J. A., “A survey on planar IMRT QA analysis,” J. Appl. Clin. Med. Phys. 8(3), 76–90 (2007). 10.1120/jacmp.v8i3.2448 [DOI] [PMC free article] [PubMed] [Google Scholar]
- Both S. et al. , “A study to establish reasonable action limits for patient-specific quality assurance in intensity-modulated radiation therapy,” J. Appl. Clin. Med. Phys. 8(2), 1–8 (2007). [DOI] [PMC free article] [PubMed] [Google Scholar]
- Basran P. S. and Woo M. K., “An analysis of tolerance levels in IMRT quality assurance procedures,” Med. Phys. 35(6), 2300–2307 (2008). 10.1118/1.2919075 [DOI] [PubMed] [Google Scholar]
- Howell R. M., Smith I. P., and Jarrio C. S., “Establishing action levels for EPID-based QA for IMRT,” J. Appl. Clin. Med. Phys. 9(3), 16–25 (2008). 10.1120/jacmp.v9i3.2721 [DOI] [PMC free article] [PubMed] [Google Scholar]
- Ezzell G. A. et al. , “IMRT commissioning: Multiple institution planning and dosimetry comparisons, a report from AAPM Task Group 119,” Med. Phys. 36(11), 5359–5373 (2009). 10.1118/1.3238104 [DOI] [PubMed] [Google Scholar]
- Pawlicki T. et al. , “Process control analysis of IMRT QA: Implications for clinical trials,” Phys. Med. Biol. 53(18), 5193–5205 (2008). 10.1088/0031-9155/53/18/023 [DOI] [PubMed] [Google Scholar]
- Van Dyk J. et al. , “Commissioning and quality assurance of treatment planning computers,” Int. J. Radiat. Oncol., Biol., Phys. 26(2), 261–273 (1993). 10.1016/0360-3016(93)90206-B [DOI] [PubMed] [Google Scholar]
- Low D. A. et al. , “A technique for the quantitative evaluation of dose distributions,” Med. Phys. 25(5), 656–661 (1998). 10.1118/1.598248 [DOI] [PubMed] [Google Scholar]
- Kruse J. J., “On the insensitivity of single field planar dosimetry to IMRT inaccuracies,” Med. Phys. 37(6), 2516–2524 (2010). 10.1118/1.3425781 [DOI] [PubMed] [Google Scholar]


