Abstract
Purpose: A number of ultrasound techniques have been applied to identify the biomechanical properties of the vocal folds. These conventional ultrasound methods, however, are not capable of visually mapping the concentration of collagen and elastic fibers in the vocal folds in the form of a parametric image. This study proposes to use a statistical parameter, the Nakagami factor estimated from the statistical distribution of the ultrasonic signals backscattered from tissues, as a means for parametric imaging of the biomechanical properties of the vocal folds.
Methods: The ultrasonic backscattered signals were acquired from four larynges (eight vocal folds) obtained from individuals without vocal fold pathology for constructing the Nakagami images. The textures of the Nakagami image in the lamina propria (LP) and the vocal muscle (VM) were observed and compared. The average and standard deviation of the Nakagami parameter for the LP and the VM were also calculated.
Results: The results showed that the Nakagami parameter of the LP is larger than that of the VM. Moreover, the LP and the VM have different shading features in the Nakagami images. It was found that the Nakagami parameter may depend on the concentration of collagen and elastic fibers, demonstrating that the Nakagami imaging may allow visual differentiation between the LP and the VM in the vocal folds.
Conclusions: Current preliminary results suggested that the high-frequency Nakagami imaging may allow real-time visual characterization of the vocal fold tissues in clinical routine examinations.
Keywords: vocal fold, ultrasound image, Nakagami image, ultrasonic backscattering
INTRODUCTION
The vocal folds play important roles in the phonation process. The vibration of the vocal folds propelled by the glottal airflow periodically interrupts the airflow, causing a pulse train of transient sounds at periodic intervals, which forms the source for human voice.1 The vocal fold has a unique multilayered structure, which is divided into the “cover” and the “body” layers, each with different biomechanical properties.2 Because the mechanical properties of the vocal folds are the critical factors in the mechanism of pitch control, it is necessary to better understand the nature of the vocal fold tissue.
In previous studies, the mechanical properties of the vocal folds have been investigated in vitro by studying the stress-strain relationship of the tissue.3, 4, 5 Several in vivo methods have also been designed to measure the elastic modulus of the vocal folds directly by tagging the cover.6, 7 Several studies instead measured the displacement velocity, which was the horizontal component of the mucosal wave velocity, with a laryngoscope, to indirectly estimate the stiffness of the vocal folds.8, 9 It was found that the cover based on mucosa and the superficial layer of lamina propria (LP) are typically much more pliable than the body consisting of vocal ligament and vocal muscle (VM). Note that these methods were either invasive or inconvenient, making them difficult to apply in routine clinical studies and examinations.
Medical imaging modalities may be used as routine tools to noninvasively investigate the mechanical properties of the vocal folds. Among all possibilities, such as computed tomography, magnetic resonance image, or optical coherent tomography, ultrasound imaging has gradually become a very convenient and powerful tool in examining the head and neck regions due to its low cost, nonionizing radiation, noninvasiveness, and real-time capability. To date, few reports on ultrasonic characterization of the vocal folds can be found. We generalize the ultrasound methods that have been used to characterize the material of the vocal folds into two types. The first approach is based on Doppler ultrasound imaging, which is applied to evaluate the vibratory behavior of the vocal folds for indirectly estimating the elasticity.10, 11 The ultrasound B-mode imaging can also be used to study the vibratory phenomena of the vocal folds.12 The second approach is to measure the acoustic parameters of the vocal folds. A previous study indicated that the integrated backscatter, attenuation coefficient, and sound velocity of the LP were larger than those of the VM,13 maybe due to that the anatomical structures of LP and the VM are different.
The above existing ultrasonic methods may have shortcomings in the vocal fold characterization. First, we note that the conventional ultrasound B-scan, Doppler technique, and the measurements of the acoustic parameters cannot visually quantify local material properties of the vocal folds. For physicians and radiologists, imaging the tissue properties may be more user-friendly and convenient for routine clinical examinations. Second, the previously proposed ultrasonic methods cannot provide additional information associated with the concentrations and arrangements of scatterers in the vocal folds, which may be important clues for the detection of the mechanical properties of the tissue material and the phonation mechanism. In order to overcome the above limitations, an imaging-based approach capable of describing the scatterer properties of a tissue may be a better option.
Recently, ultrasonic Nakagami imaging, a new ultrasound parametric imaging approach, depicting the Nakagami parameter of the Nakagami statistical distribution in an image, has gradually received attention in the field of medical ultrasound. The reason is that the Nakagami model, initially proposed to describe the statistics of radar echoes, has been demonstrated to be a general model applicable for all conditions of ultrasonic backscattering.14 By estimating the Nakagami parameter from the ultrasonic backscattered envelopes returned from a scattering medium, it allows the identification of the nature of the statistical distribution of the backscattered envelopes, which is determined by the concentrations and arrangements of scatterers in a tissue.14, 15 For this reason, Nakagami parametric imaging has been under development for several years. The concept of Nakagami parametric imaging was originally suggested by Shankar,16 Kolar et al.,17 and Davignon et al.18 The standard criterion for constructing a Nakagami image was established in these and subsequent pilot studies.19 It has been shown that Nakagami imaging is capable of visualizing the difference in the scatterer concentration between normal and abnormal tissues, complementing conventional ultrasound imaging in improving the diagnostic performance.20, 21, 22, 23, 24 Hence, it seems worthwhile to explore the feasibility of the Nakagami imaging as a new ultrasound tool to map the scatterer properties in the vocal folds for the purpose of interpreting the biomechanical properties of the tissue.
In this study, the ultrasonic Nakagami images of the LP and the VM in the human vocal folds were obtained. The textures of the Nakagami image in the LP and the VM were analyzed, and the average Nakagami parameters were calculated to investigate the relationship between the backscattered statistics and the biomechanical properties of the vocal folds. The performance of Nakagami imaging in differentiating LP and VM was also examined. Finally, possible advantages and contributions of Nakagami imaging in characterizing the vocal folds were discussed.
MATERIALS AND METHODS
VF samples
This study was approved by Institutional Review Boards of both University of Southern California and University of Wisconsin–Madison. Larynges were obtained from human cadavers at the University of Wisconsin–Madison, School of Medicine’s Department of Anatomy within 1 h after death. Four larynges (eight vocal folds) obtained from individuals without vocal fold pathology ranging in age from 40 to 73 (64±19) yr old from four Caucasian males were included in this study. The larynges were split in the midsagittal plane to yield two hemilarynges with easily accessed vocal folds. The vocal folds were then cut away from the attached cartilaginous framework of the larynx.
Data acquisition
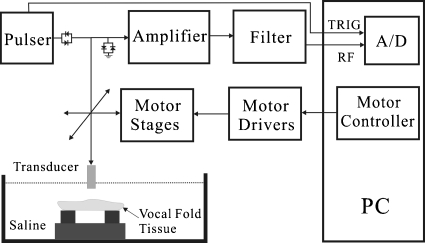
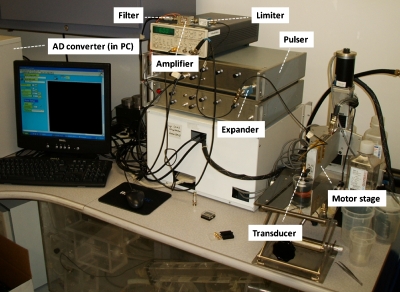
The raw radio-frequency (RF) ultrasound signals backscattered from the vocal folds were acquired for ultrasound B-mode and Nakagami imaging. Prior to the measurements, both the transducer and the vocal folds were placed in a water tank filled with saline solution at room temperature. Because both the LP and the VM in the vocal folds were approximately 1 mm thick, ultrasound transducers at central frequencies of 50 and 60 MHz (NIH Ultrasonic Transducer Resource Center, USC, USA) were used for high resolution imaging. The ultrasound scanning system is illustrated in Fig. 1 and shown in Fig. 2. The transducer movement was controlled using a motorized stage and controller (Parker Hannifin Corp., Cleveland, OH) for acquiring the images. An ultrasonic pulser (AVB2-TB-C, Avtech Electrosystems, Ltd., Ottawa, Ontario, Canada) was used to drive the transducer through an expander (Matec Instruments Co., Northborough, MA) and a T-junction. The backscattered signals received from the vocal folds were subsequently amplified by a low-noise amplifier (Miteq 1166, Miteq, Inc., Hauppauge, NY) and digitalized using a 14-bit analog-to-digital converter (ADC) (CS14200, Gage Applied Technologies, Inc., Lachine, Quebec, Canada) at a sampling rate of 200 MHz. Note that an electronic limiter (Matec Instruments Co., Northborough, MA) was placed in front of ADC for protection purposes. For each vocal fold sample, a total of 800 A-lines of the backscattered signals was acquired to form an image. The distance between each scan-line was 12 μm. A Hilbert-transform was then performed for each scan-line to obtain the envelope of the echoes in creating the image of a vocal fold. The log-compressed B-mode image was displayed with a dynamic range of 40 dB.
Figure 1.
Block diagram of the experimental setup.
Figure 2.
A photo of the experimental setup.
Nakagami imaging
The probability distribution function (pdf) of the ultrasonic backscattered envelope R under the Nakagami statistical model is given by14
| (1) |
where Γ(⋅) and U(⋅) are the gamma function and the unit step function, respectively. Let E(⋅) denote the statistical mean, then the scaling parameter Ω and the Nakagami parameter m associated with the Nakagami distribution can be, respectively, obtained from
| (2) |
and
| (3) |
Note that the Nakagami parameter estimated from the second and fourth moments of the backscattered envelopes is a shape parameter to determine the pdf of the Nakagami distribution based on Eq. 1. It has been shown that the Nakagami statistics would change from pre-Rayleigh to Rayleigh distribution if the Nakagami parameter varies from 0 to 1, and the Nakagami statistics conform to post-Rayleigh distributions when the Nakagami parameter is larger than 1.14 The previous study has also showed that the Nakagami distributions at different Nakagami parameters have the ability to well fit all the backscattered statistics in medical ultrasound, including pre-Rayleigh, Rayleigh, and post-Rayleigh distributions.14 In other words, Eq. 1 could be treated as an approximate function to model the histogram of the ultrasonic backscattered envelope data. This property makes the Nakagami distribution a good general model for ultrasonic backscattering.
The ultrasonic Nakagami image is based on the Nakagami parameter map, which is constructed using a square sliding window to process the envelope image.19 This mainly contains two steps.
-
(1)
A square window within the envelope image is used to collect the local backscattered envelopes for estimating the local Nakagami parameter mw, which is assigned as the new pixel located at the center of the window.
-
(2)
Step (1) is repeated with the window moving throughout the entire envelope image in steps of 1 pixel, which yields the Nakagami image as the map of mw values.
Note that the window size determines the resolution of the Nakagami image. As the window size decreases, the resolution of the Nakagami image gets better. However, a small window has fewer envelope data points, leading to an unstable estimation of the parameter mw. Therefore, prior to the construction of the Nakagami image, the optimal size of the window that can simultaneously satisfy both the stable estimation of mw and an acceptable resolution of the Nakagami image needed to be determined. A previous study19 suggested that the appropriate sliding window needed to construct the Nakagami image should be a square with a side length equal to three times the pulse length of the incident ultrasound.
The Nakagami image of each vocal fold sample was constructed according to the algorithmic procedure described earlier. A pseudocolor scale was applied to clearly reveal the information in the Nakagami image. Values of mw smaller than 1 were assigned a blue shading, which changed from dark to light with increasing value. Pixels with mw equal to 1 were shaded white, and those larger than 1 were assigned a red shading from dark to light with increasing value. Then, we manually chose the region of interest (ROI) in the Nakagami image of each vocal fold to calculate the average and the standard deviation of the Nakagami parameter for the LP and the VM. The performance of using the Nakagami image to discriminate the LP and the VM was evaluated using the probability value (i.e., p value) calculated from the t-test. The programming was implemented using a MATLAB software on a personal computer.
RESULTS AND DISCUSSION
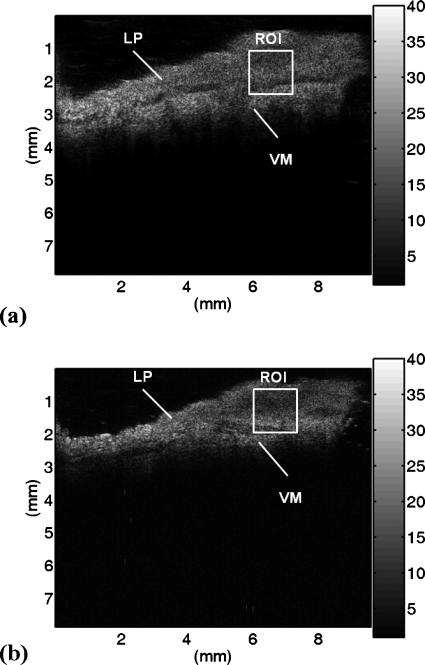
Figures 3a, 3b show the representative B-mode images of the vocal folds at ultrasonic frequencies of 50 and 60 MHz, respectively. The white lines indicate that the upper layer is the LP and the lower layer is the VM. It can be observed that there is no significant difference in the grayscale level in the B-mode image between the LP and the VM, indicating that the conventional ultrasound imaging is not capable of distinguishing different properties of the vocal folds.
Figure 3.
The B-mode images of the vocal folds at different ultrasonic frequencies: (a) 50 MHz and (b) 60 MHz.
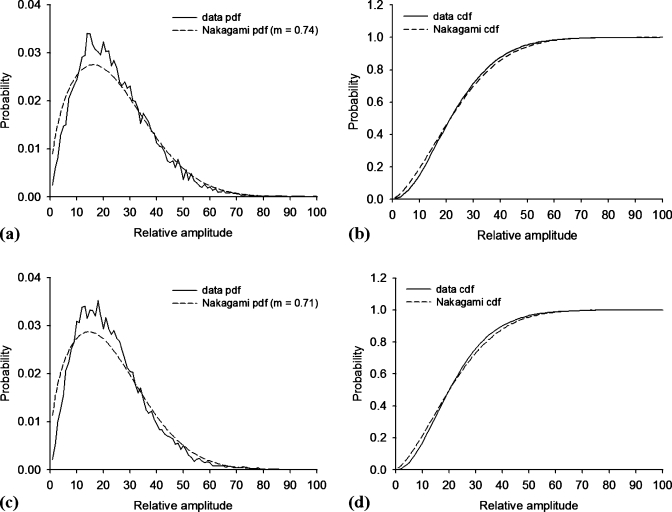
Prior to constructing the Nakagami images of the vocal folds, it is necessary to confirm whether the backscattered envelopes of the ultrasonic signals from the vocal fold tissues are Nakagami-distributed data, although it has been shown that the backscattered data return from tissues follows the Nakagami statistics.14, 15, 16 We chose a ROI with a size of 1.5×1.5 mm2 (white squares in Fig. 3) to acquire the backscattered envelopes. Then, the Kolmogorov–Smirnov goodness of fit hypothesis test was carried out by using the function “kstest” in the MATLAB software to confirm the null hypothesis that the backscattered data are Nakagami-distributed. Figure 4 shows the pdfs and the cumulative distribution functions (cdfs) of the empirical data from the vocal folds and the data fittings by the Nakagami distribution measured using different frequencies. At a setting of 5% significance level, the test result showed that the null hypothesis was accepted, representing that the envelope data from the vocal folds for 50 and 60 MHz ultrasound indeed follow the Nakagami distribution.
Figure 4.
pdfs (left side) and cdfs (right side) of the empirical envelope data from the vocal folds and their fittings by the Nakagami distribution measured using different ultrasonic frequencies: [(a) and (b)] 50 MHz and [(c) and (d)] 60 MHz. At a 5% significance level, the Kolmogorov–Smirnov goodness of fit test showed that the envelope data at 50 and 60 MHz follows the Nakagami distribution.
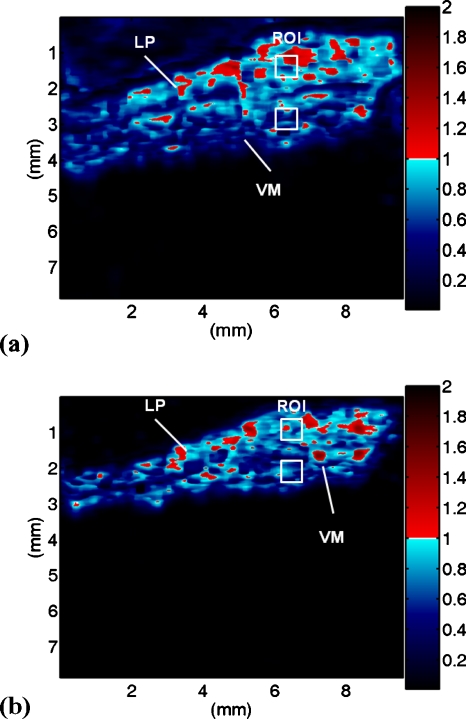
Figures 5a, 5b show the Nakagami images of the vocal folds corresponding to the B-mode images in Figs. 3a, 3b, respectively. Here, we found a very interesting phenomenon. That is, the LP and the VM seemed to have different shading features in the Nakagami images. The LP was associated with red-blue-interlaced shading in the Nakagami image. According to the pseudocolor scale we designed in the Nakagami image, the LP had a large diversity of the local backscattered statistics, in which pre-Rayleigh, Rayleigh, and post-Rayleigh distributions could be found. However, the VM regions were associated with more blue shading, mainly corresponding to the pre-Rayleigh statistics.
Figure 5.
The Nakagami images of the vocal folds at different ultrasonic frequencies: (a) 50 MHz and (b) 60 MHz.
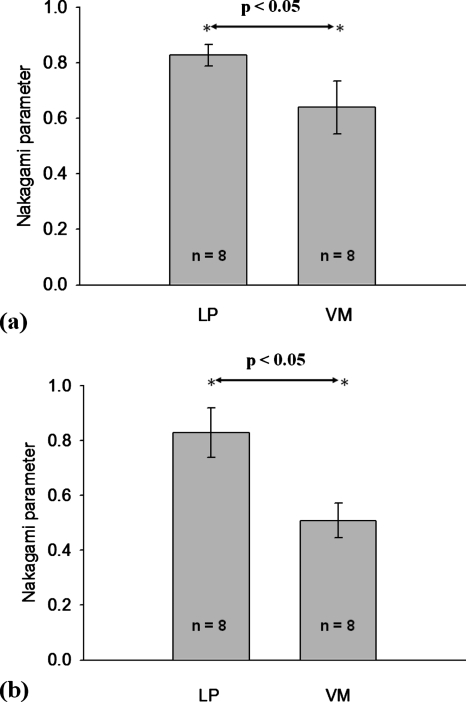
In order to more precisely describe the backscattered statistics of the LP and the VM in the vocal folds, we calculated the averages and the standard deviations of the Nakagami parameter corresponding to the LP (n=8) and the VM (n=8). The manual choice of the ROI was based on the visual inspection because the interface between the LP and the VM in the ultrasound B-mode image is distinguishable. In order to collect reliable data, we have to prevent the ROI from simultaneously containing both the LP and the VM. As mentioned earlier, both the LP and the VM in the vocal folds were approximately 1 mm thick. Therefore, a ROI with a size of 0.5×0.5 mm2 (white squares in Fig. 5) was used to avoid possible biases in a manual condition. The results are shown in Fig. 6. At 50 MHz, the Nakagami parameters of the LP and the VM were 0.83±0.04 and 0.64±0.08, respectively (p value <0.05). When the frequency was increased to 60 MHz, the Nakagami parameters of the LP and the VM corresponded to 0.83±0.09 and 0.51±0.06, respectively (p value <0.05). The results in Fig. 6 agree well with those in Fig. 5, indicating that the ultrasonic echoes returned from the VM is more pre-Rayleigh-distributed than that of the LP.
Figure 6.
The averages and the standard deviations of the Nakagami parameter for the LP and the VM in the vocal folds measured using different ultrasonic frequencies: (a) 50 MHz and (b) 60 MHz.
The reason why the LP and the VM produce varying backscattered statistics may be attributable to the structure of elastic and collagen fibers differing between the LP and the VM. In the previous studies, the Picrosirius-polarization visualization method was used to show that the collagen fibers in the LP form an intertwined network arranged in the form of a wicker basket.25 The collagen fibers were found to be highly branched and anastomosed, not forming bundles but instead forming a delicate three-dimensional network whose empty spaces were filled with glycoproteins, glycosaminoglycans, and elastic fibers. Such a dense arrangement of elastic and collagen fibers in the LP may be thought as a structure with a high concentration of acoustic scatterers (i.e., the number density of scatterers). It is well known that high scatterer concentration is favorable to producing a significant effect of constructive interference for the backscattered ultrasound, making the envelope statistics tend to approach Rayleigh distribution corresponding to the Nakagami parameter=1.14, 15 This is why pre-Rayleigh, Rayleigh, and post-Rayleigh distributions simultaneously exist in the LP and, on the average, the Nakagami parameter is 0.83, corresponding to a global backscattered statistics of roughly Rayleigh distribution, as shown in Fig. 6.
On the contrary, the VM tissue comprises of cylindrical muscle fibers and is found not to have the similar network arrangement structures in the LP.25 According to the observations on the three-dimensional graphic illustrations of the histoarchitecture of the human vocal folds in the previous study,25 the VM layer has a lower number of fibers and a larger spacing between fibers than the LP. Recall that a low scatterer concentration and a larger spacing between scatterers in a scattering medium would produce a high degree of variability in the scattering cross section of the scatterers, resulting in that the backscattered signals follow pre-Rayleigh distribution corresponding to the Nakagami parameters smaller than 1.14, 15 This explains the reason why the most backscattered statistics in the VM are pre-Rayleigh distributions, and the average Nakagami parameter of the VM is smaller than that of the LP, as shown in Fig. 6.
It becomes plausible from experimental findings and discussion given above why the LP is much more elastic than the VM. These results demonstrate convincingly that Nakagami parametric imaging outperforms B-mode imaging in classifying the LP and the VM in the vocal folds. Furthermore, Nakagami imaging is better because it provides a capability to characterize the vocal folds by visualizing the statistical distributions of the backscattered data from the LP and the VM, which are associated with the anatomical structures and thus the corresponding biomechanical properties of the vocal fold tissue to some degree.
In addition, it is worthwhile to note the effect of ultrasound frequency on the performance of Nakagami imaging in visualizing the biomechanical properties of the vocal folds. We found that the Nakagami parameter of the VM measured at 60 MHz ultrasound was smaller than that measured at 50 MHz. Note that increasing the ultrasound frequency accentuates the difference in the Nakagami parameter between the LP and the VM, thus suggesting that the Nakagami parameter is better in classifying the properties of the vocal folds and the Nakagami image may yield a better contrast to visualize the fiber concentrations in the LP and the VM. This difference is actually attributable to the size of the resolution cell defined by the beam cross-sectional area and the transducer pulse length. The previous study indicated that the number of scatterers in the resolution cell was a key factor to determine the ultrasonic statistical parameter.15, 26, 27, 28 Increasing the ultrasound frequency would shorten the pulse length of the transducer, decreasing the size of the resolution cell. Under this circumstance, the effective number of scatterers in the resolution cell decreases and, accordingly, the Nakagami parameter decreases.15 Nevertheless, a decrease in the Nakagami parameter with increasing ultrasound frequency was not found in the results of the LP measurements. This may be due to fact that the LP has already had a very large number of scatterers (i.e., fibers), making the Nakagami parameter less dependent on the change in the size of the resolution cell.
According to the above discussion, we could further assume that the difference in the Nakagami parameter between the LP and the VM may be dependent on the ultrasound frequency to some degree. It should be noted that the vocal folds used in this study were obtained from four individuals without any pathology. Compared to normal samples, diseased cases may have different scatterer properties, resulting in a different frequency dependency of the Nakagami parameter difference between the LP and the VM. This assumption is an interesting issue and may be useful to exploring some clinical problems associated with phonation disorder and pitch control.
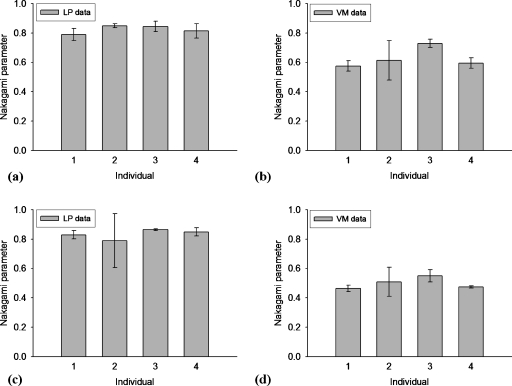
It is also interesting to observe the variation in the Nakagami parameter between four male individuals, although two tissue samples for each individual are too less to have a statistical meaning. Figure 7 shows the average and the standard deviation of the Nakagami parameter for each individual. It can be found that there is no significant difference in the Nakagami parameter between the LP regions of each individual [Figs. 7a, 7c]. Nevertheless, the Nakagami parameter of the VM seems to have a trend fluctuation as a function of an individual [Figs. 7b, 7d]. A possible reason may be due to estimating the Nakagami parameter of the vocal folds would also be affected by age, which is a critical determinant for tissue properties. In other words, when using the Nakagami parametric image to characterize the vocal folds, intersubjective (e.g., age or sex) and intrasubjective variabilities (i.e., scatterer properties) should be simultaneously taken into account to better explain the results.
Figure 7.
The average and the standard deviation of the Nakagami parameter for the LP (left side) and the VM (right side) in each individual measured using different frequencies: [(a) and (b)] 50 MHz and [(c) and (d)] 60 MHz.
Now we are trying to figure out solutions to collect more cadaveric larynges. On one hand, we would like to further evaluate the accuracy of the proposed Nakagami method and the feasibilities of using the shape parameters of some other statistical distributions to distinguish the LP and the VM. On the other hand, we want to obtain more information as references for future clinical studies and the development of a high-frequency ultrasound system dedicated to vocal fold examination.
CONCLUSION
This paper is the first pilot study to explore the feasibility of using the Nakagami imaging to visualize the biomechanical properties of the vocal folds. The raw ultrasonic RF signals backscattered from the LP and the VM were measured to construct the Nakagami images. We found that the Nakagami images better reflected anatomical differences in LP and VM than B-mode images. Nakagami imaging may be considered as a functional ultrasound imaging tool for visualizing the relative concentration of collagen and elastic fibers, which are key factors to determine the biomechanical properties of the vocal folds. The current preliminary results suggested that the Nakagami imaging may be combined with high-frequency ultrasound devices to allow real-time characterization of the vocal fold tissues in clinical routine examinations.
ACKNOWLEDGMENTS
This work was supported in part by the National Science Council of the Republic of China (Taiwan) under Grant No. NSC99-2218-E-182-009. The authors would like to thank the reviewers for their valuable comments.
References
- Hirano M., “Phonosurgery: Basic and clinical investigations,” Otologia Fukuoka 21(1), 239–262 (1975). [Google Scholar]
- Hirano M., “Morphological structure of the vocal cord as a vibrator and its variations,” Folia Phoniatrica (Basel) 26, 89–94 (1974). 10.1159/000263771 [DOI] [PubMed] [Google Scholar]
- Min Y. B., Titze I. R., and Alipour-Haghighi F., “Stress-strain response of the human vocal ligament,” Ann. Otol. Rhinol. Laryngol. 104, 563–569 (1995). [DOI] [PubMed] [Google Scholar]
- Haji T., Mori K., Omori K., and Isshiki N., “Mechanical properties of the vocal fold. Stress-strain studies,” Acta Oto-Laryngol. 112, 559–565 (1992). 10.3109/00016489209137440 [DOI] [PubMed] [Google Scholar]
- Haji T., Mori K., Omori K., and Isshiki N., “Experimental studies on the viscoelasticity of the vocal fold,” Acta Oto-Laryngol. 112, 151–159 (1992). 10.3109/00016489209100797 [DOI] [PubMed] [Google Scholar]
- Tran Q. T., Berke G. S., Gerratt B. R., and Kreiman J., “Measurement of Young’s modulus in the in vivo human vocal folds,” Ann. Otol. Rhinol. Laryngol. 102, 584–591 (1993). [DOI] [PubMed] [Google Scholar]
- Tanaka S. and Hirano M., “Fiberscopic estimation of vocal fold stiffness in vivo using the sucking method,” Arch. Otolaryngol. Head Neck Surg. 116, 721–724 (1990). [DOI] [PubMed] [Google Scholar]
- Nasri S., Sercarz J. A., and Berke G. S., “Noninvasive measurement of traveling wave velocity in the canine larynx,” Ann. Otol. Rhinol. Laryngol. 103, 758–766 (1994). [DOI] [PubMed] [Google Scholar]
- Hanson D. G., Jiang J., D’Agostino M., and Herzon G., “Clinical measurement of mucosal wave velocity using simultaneous photoglottography and laryngostroboscopy,” Ann. Otol. Rhinol. Laryngol. 104, 340–349 (1995). [DOI] [PubMed] [Google Scholar]
- Hsiao T. Y., Wang C. L., Chen C. N., Hsieh F. J., and Shau Y. W., “Noninvasive assessment of laryngeal phonation function using color Doppler ultrasound imaging,” Ultrasound Med. Biol. 27, 1035–1040 (2001). 10.1016/S0301-5629(01)00399-4 [DOI] [PubMed] [Google Scholar]
- Hsiao T. Y., Wang C. L., Chen C. N., Hsieh F. J., and Shau Y. W., “Elasticity of human vocal folds measured in vivo using color Doppler imaging,” Ultrasound Med. Biol. 28, 1145–1152 (2002). 10.1016/S0301-5629(02)00559-8 [DOI] [PubMed] [Google Scholar]
- Tsai C. G., Chen J. H., Shau Y. W., and Hsiao T. Y., “Dynamic B-mode ultrasound imaging of vocal fold vibration during phonation,” Ultrasound Med. Biol. 35, 1812–1818 (2009). 10.1016/j.ultrasmedbio.2009.06.002 [DOI] [PubMed] [Google Scholar]
- Huang C. C., Sun L., Dailey S. H., Wang S. H., and Shung K. K., “High frequency ultrasonic characterization of human vocal fold tissue,” J. Acoust. Soc. Am. 122, 1827–1832 (2007). 10.1121/1.2756759 [DOI] [PubMed] [Google Scholar]
- Shankar P. M., “A general statistical model for ultrasonic backscattering from tissues,” IEEE Trans. Ultrason. Ferroelectr. Freq. Control 47, 727–736 (2000). 10.1109/58.842062 [DOI] [PubMed] [Google Scholar]
- Tsui P. H. and Wang S. H., “The effect of transducer characteristics on the estimation of Nakagami parameter as a function of scatterer concentration,” Ultrasound Med. Biol. 30, 1345–1353 (2004). 10.1016/j.ultrasmedbio.2004.08.009 [DOI] [PubMed] [Google Scholar]
- Shankar P. M., “Statistical modeling of scattering from biological media,” J. Acoust. Soc. Am. 111, 2463 (2002). [Google Scholar]
- Kolar R., Jirik R., and Jan J., “Estimator comparison of the Nakagami-m parameter and its application in echocardiography,” Radioengineering 13, 8–12 (2004). [Google Scholar]
- Davignon F., Deprez J. F., and Basset O., “A parametric imaging approach for the segmentation of ultrasound data,” Ultrasonics 43, 789–801 (2005). 10.1016/j.ultras.2005.06.001 [DOI] [PubMed] [Google Scholar]
- Tsui P. H. and Chang C. C., “Imaging local scatterer concentrations by the Nakagami statistical model,” Ultrasound Med. Biol. 33, 608–619 (2007). 10.1016/j.ultrasmedbio.2006.10.005 [DOI] [PubMed] [Google Scholar]
- Tsui P. H., Huang C. C., Chang C. C., Wang S. H., and Shung K. K., “Feasibility study of using high-frequency ultrasonic Nakagami imaging for characterizing the cataract lens in vitro,” Phys. Med. Biol. 52, 6413–6425 (2007). 10.1088/0031-9155/52/21/005 [DOI] [PubMed] [Google Scholar]
- Tsui P. H., Yeh C. K., Chang C. C., and Liao Y. Y., “Classification of breast masses by ultrasonic Nakagami imaging,” Phys. Med. Biol. 53, 6027–6044 (2008). 10.1088/0031-9155/53/21/009 [DOI] [PubMed] [Google Scholar]
- Tsui P. H., Yeh C. K., Chang C. C., and Chen W. S., “Performance evaluation of ultrasonic Nakagami image in tissue characterization,” Ultrason. Imaging 30, 78–94 (2008). [DOI] [PubMed] [Google Scholar]
- Tsui P. H., Yeh C. K., and Chang C. C., “Feasibility exploration of blood flow estimation by contrast-assisted Nakagami imaging,” Ultrason. Imaging 30, 133–150 (2008). [DOI] [PubMed] [Google Scholar]
- Liao Y. Y., Tsui P. H., and Yeh C. K., “Classification of benign and malignant breast tumors by ultrasound B-scan and Nakagami-based images,” J. Med. Biol. Eng. 30, 307–312 (2010). 10.5405/jmbe.30.5.06 [DOI] [Google Scholar]
- d. Melo E. C. M., Lemos M., Filho J. A. X., Sennes L. U., Saldiva P. H. N., and Tsuji D. H., “Distribution of collagen in the lamina propria of the human vocal fold,” Laryngoscope 113, 2187–2191 (2003). 10.1097/00005537-200312000-00027 [DOI] [PubMed] [Google Scholar]
- Tuthill T. A., Sperry R. H., and Parker K. J., “Deviations from Rayleigh statistics in ultrasonic speckle,” Ultrason. Imaging 10, 81–89 (1988). 10.1016/0161-7346(88)90051-X [DOI] [PubMed] [Google Scholar]
- Chen J. F., Zagzebski J. A., and Madsen E. L., “Non-Gaussian versus non-Rayleigh statistical properties of ultrasound echo signals,” IEEE Trans. Ultrason. Ferroelectr. Freq. Control 41, 435–440 (1994). 10.1109/58.294102 [DOI] [PubMed] [Google Scholar]
- Zagzebski J. A., Chen J. F., Dong F., and Wilson T., “Intervening attenuation affects first-order statistical properties of ultrasound echo signals,” IEEE Trans. Ultrason. Ferroelectr. Freq. Control 46, 35–40 (1999). 10.1109/58.741421 [DOI] [PubMed] [Google Scholar]


