Abstract
Background
Mutations in the TP53 tumor suppressor gene are common in HNSCC and correlate with radioresistance. Currently, there are no clinically available therapeutic approaches targeting p53 in HNSCC. Here we propose a strategy which uses TP53 mutational status to individualize anti-metabolic strategies for potentiation of radiation toxicity in HNSCC cells.
Methods
Glycolytic flux and mitochondrial respiration were evaluated in wild-type (wt) and mutant (mut) TP53 HNSCC cell lines. Sensitivity to external beam radiation (XRT) was measured using a clonogenic assay.
Results
HNSCC cells expressing mutTP53 demonstrated radioresistance compared to HNSCC cells expressing wtTP53. Glycolytic inhibition potentiated radiation toxicity in mutTP53, but not wtTP53 expressing HNSCC cells. The relative sensitivity of mutp53 HNSCC cells to glycolytic inhibition is due to a glycolytic dependence associated with decreased mitochondrial complex II and IV activity. Wild-typeTP53 expressing cells maintain mitochondrial reserves and are relatively insensitive to glycolytic inhibition. Inhibition of respiration using metformin increases glycolytic dependence in wtTP53 expressing cells and potentiates the effects of glycolyic inhibition on radiation toxicity.
Conclusion
TP53 mutation in HNSCC cells correlates with a metabolic shift away from mitochondrial respiration toward glycolysis resulting in increased sensitivity to the potentiating effects of glycolytic inhibition on radiation toxicity. In contrast, wtTP53 expressing cells require inhibition of both mitochondrial respiration and glycolysis to become sensitized to radiation. One can therefore, use TP53 mutational status as a marker of altered tumor cell metabolism to individualize HNSCC treatment selection of specific targeted metabolic agents that can overcome cellular resistance to radiation therapy.
Keywords: p53, 2-deoxyglucose, metformin, mitochondria, radiation
Introduction
HNSCC is the 5th most common cancer in the US, with over 40,000 new cases per year.1 Despite advances in diagnostic modalities, a significant number of patients present with advanced disease requiring multi-modality treatment combining surgery with adjuvant chemotherapy and external beam radiation.2 Mutations in TP53 have been shown to correlate with aggressive HNSCC disease and relative radioresistance.3, 4 Due to toxicity concerns, dose escalation is often not a viable option for patients presenting with TP53 mutations. Therefore, it is imperative to identify novel radiosensitizing approaches for patients with relatively radioresistant mutant TP53 HNSCC.
The role of p53 in tumor biology is complex, spanning effects on cell proliferation, death and response to exogenous stress.5 Loss of p53 function via missense mutation can disrupt cell cycle arrest and death in response to DNA damage, resulting in resistance to cytotoxic treatments.6 P53 has been demonstrated to play a role in metabolic homeostasis by balancing glycolytic activity and mitochondrial respiration. Loss of wild-type (wt) p53 function through deletion or mutation results in an unbalanced metabolic phenotype in which glycolytic activity predominates at the expense of adequate mitochondrial function.7–11 We suggest that this phenomenon represents a unique therapeutic opportunity to address mutant TP53 driven disease. Tumor cells which maintain a diversified metabolic profile are less likely to succumb to targeted inhibition of specific metabolic pathways. Conversely, tumor cells which become exclusively dependent on a single metabolic pathway through loss of wtp53 function may display increased susceptibility to targeted metabolic agents.
Impaired mitochondrial function has been described in HNSCC samples, and shown to correlate with adverse clinical outcomes.12–14, 15, 16 We have previously shown that HNSCC cells predominantly catabolize glucose resulting in a generalized sensitivity to glycolytic inhibition. This sensitivity was dramatically increased following loss of p53 function.17 Based on these data, we hypothesized that TP53 status can be used to select anti-metabolic strategies aimed at sensitizing HNSCC cells to external beam radiation (XRT) toxicity.
Materials and Methods
Chemicals
2-deoxyglucose, metformin, oligomycin, rotenone, antimycin A, N-acetyl cysteine and carbonylcyanide p-trifluoromethoxyphenylhydrazone (FCCP) were purchased from Sigma-Aldrich (StLouis, MO). D-glucose was purchased from ICN Biomedical (Irvine, CA).
Cells
HNSCC cell lines utilized in this study were authenticated by short tandem repeat (STR) profiling and were maintained in Dulbecco’s modified Eagle’s medium (DMEM) containing fetal bovine serum, penicillin/streptomycin, glutamine, sodium pyruvate, nonessential amino acids, and vitamins. Stable knock-downs of wild-type (HN30) and mutant p53(HN31) have been previously described.17
Expression array analysis
Total RNA was isolated with Tri Reagent. Total RNA (100ng) was analyzed with the Illumina Whole Genome DASL Assay, hybridized to the HumanRef-8 v3 beadchip and read on the Illumina BeadArray Reader. Raw data, exported from the Illumina BeadStudio software, was background corrected, log transformed and quantile normalized in R. Batch effects were removed by fitting linear models for each gene. Class comparisons were performed using BRB Array Tools developed by Dr. Richard Simon and the BRB-ArrayTools Development Team.
Metabolic studies
Oxygen consumption rates (OCR) and extra-cellular acidification rates (ECAR) were assayed under basal conditions (25mM D-glc, 1mM pyruvate, 4mM glutamine, 0% serum) and following administration of various drugs using a Seahorse Bioscience XF24 Extracellular Flux Analyzer (Billerica, MA) as previously described.18 Electron transport chain (ETC) activity was assayed at 30°C using a temperature-controlled spectrophotometer; Infinite 200, Tecan Systems Inc., (Mannedorf, Switzerland). The activities of complex I (NADH dehydrogenase), complex II (Succinate dehydrogenase), total and rotenone sensitive complex I+III (NADH:Cytochrome C Oxidoreductase), complex II+III (Succinate:Cytochrome C Oxidoreductase), complex III (cytochrome c reductase), complex IV (cytochrome c oxidase), and CS (citrate synthase) were measured using appropriate electron acceptors/donors. The increase or decrease in the absorbance of cytochrome c at 550 nm was measured for complex I+III, II+III, III, and complex IV. The activity of complex I was measured by oxidation of NADH at 340 nm. For complex II, the reduction of 2,6-dichloroindophenol (DCIP) at 600 nm was measured. Decylubiquinone, a more hydrophilic component, was used in place of ubiquinone (or coenzyme Q10).19 Citrate synthase (CS) was assayed by measuring the rate of production coenzyme A (CoA.SH) from oxaloacetate using Ellman’s reagent (DTNB). Enzyme activities were expressed as nmol/min/mg protein.19, 20
Clonogenic assay
HNSCC cells were irradiated using a high dose-rate 137Cs unit (4.5 Gy/min) to the indicated dose. Cells were incubated for 10–14 days to allow for visible colony development, then fixed and stained using a 1% formalin/crystal violet solution. Colonies were counted and surviving fractions were determined based upon the plating efficiency of the non-irradiated control group.
Reactive oxygen species (ROS) measurement
Intra-cellular ROS levels were measured using 5-(and-6)-carboxy-2′,7′-dichlorofluorescein (CM-H2DCFDA) using a combination of 96-well spectrophotometric analysis and flow cytometry as previously described.21 Briefly, cells were loaded with dye for 30–60 minutes. Excess dye was removed and cells were incubated with various drugs prior to exposure to XRT. Fluorescence was normalized to the control condition and cell number as assayed by total DNA.22
Results
Glycolytic inhibition potentiates radiation toxicity in HNSCC cell lines expressing mutant but not wild-type TP53
Using an isogenic cell line pair divergent for TP53 mutational status we demonstrated radioresistance associated with mutant TP53 (HN31) compared to its wild-type counterpart (HN30) (Fig. 1A). These results have been confirmed in a series of parallel studies performed on multiple HNSCC cell lines (data not shown). We have previously reported that HN31 displays increased glycolytic dependence compared to its counterpart HN30.17 Based on these initial observations regarding differential radiosensitvity and metabolic profile, we set out to evaluate the ability of metabolic targeting to potentiate the effects of radiation in mutant TP53 expressing HNSCC cell lines.
Figure 1. Glycolytic inhibition potentiates radiation toxicity in HNSCC cell lines expressing mutant but not wild-type TP53.
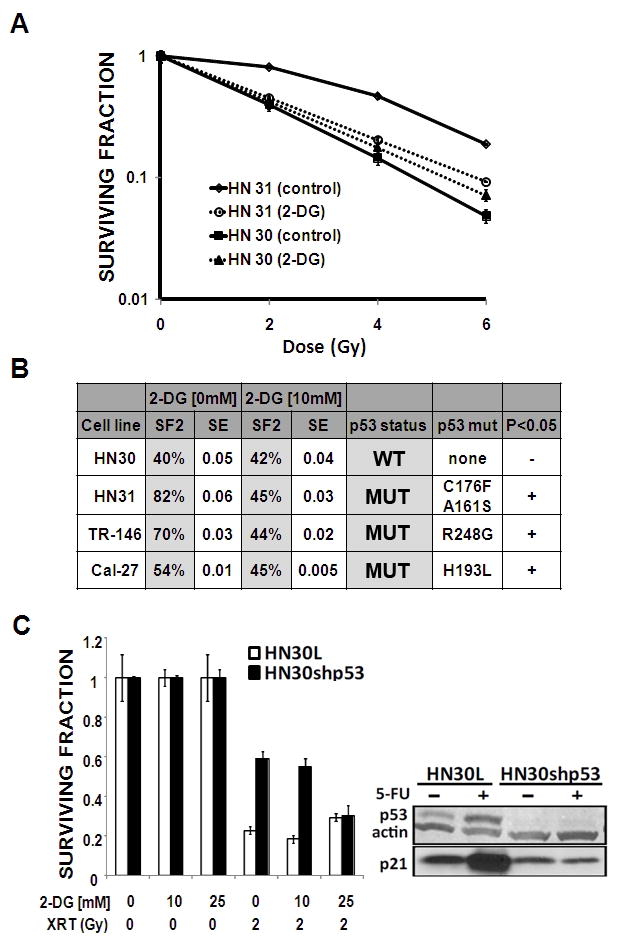
A) Mutant TP53 expressing HN31 cells exhibited relative radioresistance compared to wtTP53 expressing HN30 cells. Cells were exposed to radiation in the presence or absence of 2-DG [10 mM]. Colonies were counted and used to calculate surviving fraction. B) 2-DG treatment decreased SF2 (surviving fraction at 2Gy) values for HN31, TR-146 and Cal-27 but not HN30. C) Stable knockdown of wtTP53 results in increased radiosensitization by 2-DG in HN30 cells. P53 and p21 protein levels were ascertained in HN30 lentiviral transfected (HN30L) control cell lines compared to their shRNA p53 stable knockdown counterparts (HN30shp53). Treatment with 5-FU (5 ng/ml) for 24 hours resulted in increased p53 protein levels.
Treatment of HN31 with 2-DG resulted in significant potentiation of radiation toxicity at multiple radiation doses; in contrast, 2-DG failed to induce significant potentiation of radiation toxicity in HN30(wtp53) (Fig. 1A). In order to determine whether this effect was unique to the TP53 mutations expressed by HN31, we extended our analysis to 2 other cell lines which contain TP53 missense mutations that stabilize the p53 protein (Fig. 1B and data not shown). Treatment with 2-DG significantly decreased the surviving fraction at 2Gy (SF2) in all three mutant TP53 expressing cell lines, but not in HN30. Consistent effects across 3 cells lines that express different TP53 mutations suggest that this phenomenon is due to loss of wtTP53 function as opposed to a specific gain of function for a particular mutation. To further demonstrate this, we used a previously described stable shRNA knockdown of wtTP53 in HN30. As shown in Fig. 1C, stable knockdown of wtTP53 led to decreased transcriptional activity as demonstrated by decreased p21 activation in HN30 resulted in increased sensitivity to the potentiation of radiation toxicity by 2-DG.
2-DG effects on radiation toxicity are driven by changes in intra-cellular ROS levels
The effects of 2-DG on tumor cells are complex and may depend on tumor type.23 Here we sought to determine whether the effects of 2-DG on radiation toxicity are mediated through intra-cellular ROS by measuring ROS levels using CM-H2DCFDA.21 External beam radiation (XRT) increased intra-cellular ROS in a dose dependent manner (data not shown). This effect was potentiated by the addition of 2-DG and reversed by the free radical scavenger N-acetyl cysteine (NAC) (Fig. 2). Potentiation of XRT driven intra-cellular ROS levels by 2-DG was time dependent (with respect to length of 2-DG exposure) suggesting that the relative effectiveness of anti-glycolytic strategies in the context of conventional treatment will depend on the timing and manner of administration (Fig. 2C). Reversal of increased ROS using NAC resulted in abrogation of the effects of 2-DG (Fig. 2C, D).
Figure 2. 2-DG potentiates radiation toxicity in mutant TP53 expressing HNSCC cells (HN31) by increasing intra-cellular ROS levels.
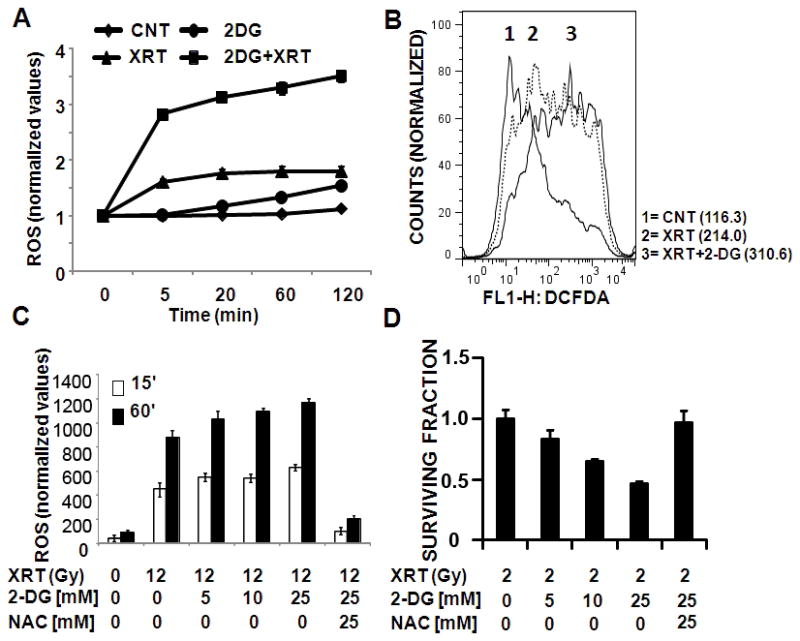
A) Cells were incubated with CM-H2DCFDA for 45 min prior to 2-DG [50 mM] treatment and radiation (24Gy). Fluorescence was measured and normalized to total DNA content. Data are presented as averages with error bars indicating standard deviation. B) Cells were exposed to radiation (6Gy) in the presence or absence of 2-DG [25 mM] and ROS levels were analysed using flow cytometry. Numbers in parentheses denote average DCFDA values for each condition. C) Cells were incubated with CM-H2DCFDA for 45 min followed by 2-DG incubation for either 15′ or 60′ prior to XRT exposure. D) Cells were exposed to radiation in the presence or absence of 2-DG and NAC. Colonies were counted and used to calculate surviving fraction.
TP53 mutation is not associated with differential expression of glucose transporters or glycolytic enzymes
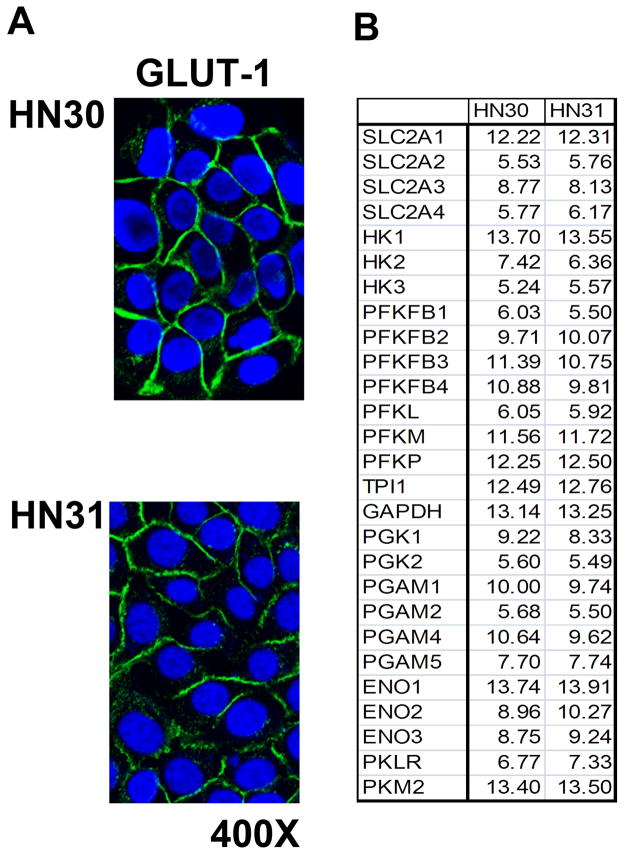
TP53 is an important regulator of cellular metabolic homeostasis. Following loss of p53 function through deletion or mutation a cell’s metabolism shifts away from mitochondrial respiration toward glycolysis.7 Our analysis of HNSCC cell lines suggests that mutation of TP53 does not result in increased glycolytic activity under baseline conditions. GLUT-1 expression was found to be similar across cell lines expressing wild-type or mutant TP53 (Fig. 3A). A more detailed gene array analysis of glucose transporter and glycolytic enzyme expression found no differences in their expression between wild-type and mutant TP53 expressing HNSCC cells (Fig. 3B and data not shown).
Figure 3. TP53 mutation is not associated with over-expression of glucose transporters or glycolytic enzymes in HNSCC cells.
A) HN30 and HN31 cells displayed equivalent expression of GLUT-1 levels as ascertained by immune-fluorescence. B) Cells were grown under standard conditions and mRNA levels for glucose transporters and glycolytic enzymes were analyzed using gene array. Data are presented as relative expression (ln).
HNSCC cells expressing mutant TP53 display decreased mitochondrial respiratory capacity and increased sensitivity to 2-DG inhibition of glycolysis
A well characterized wtTP53 breast cancer cell line (MCF-7) was used to establish a baseline metabolic profile of glycolytic and mitochondrial activity (Fig. 4A). MCF-7 displays robust mitochondrial respiration, functioning at sub-capacity levels. Loss of mitochondrial ATP generating capacity results in glycolytic compensation and increased lactic acid production. These data were reproduced in the wtTP53 expressing HN30 but not in its mutTP53 expressing counterpart, HN31 (Fig. 4B). Following uncoupling of the proton gradient using FCCP, HN30 cells display significant reserve mitochondrial capacity, while HN31 cells functioned at maximal capacity under both coupled and uncoupled conditions. Of note, baseline mitochondrial activity expressed as a function of the oxygen consumption rate (OCR) was similar between the 2 cell lines. Oligomycin, an inhibitor of the mitochondrial ATP synthase (F0 subunit), triggered a robust increase in lactic acid production, expressed as a function of the extra-cellular acidification rate (ECAR) in both MCF-7 and HN30, but a much smaller increase in HN31. This analysis was extended to 3 other HNSCC cell lines which exhibit point mutations in TP53 and protein stabilization (data not shown). As shown in Fig. 4D, all 4 cell lines expressing mutant p53 had substantially lower respiratory capacity under uncoupled conditions, as well as decreased glycolytic compensation following oligomycin inhibition of mitochondrial respiration. These data suggest that the metabolic defect observed in the HN30-HN31 isogenic cell pair may be indicative of a larger metabolic phenotype associated with mutant TP53 across HNSCC cell lines. Decreased mitochondrial capacity correlated with increased susceptibility of mutant TP53 expressing HN31 cells to glycolytic inhibition by 2-DG (Fig. 4C).
Figure 4. HNSCC cells expressing mutant TP53 display decreased mitochondrial respiratory capacity and increased sensitivity to 2-DG inhibition of glycolysis.
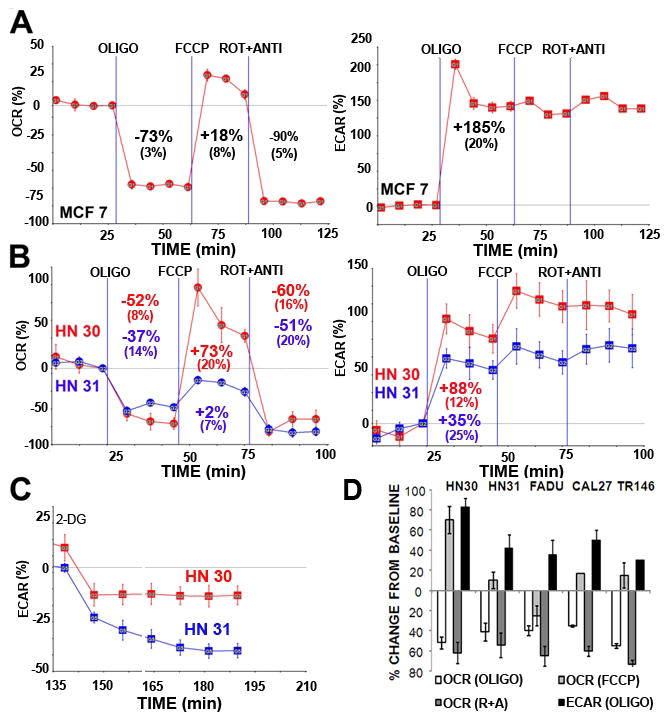
MCF-7 (A), HN30, HN31 (B,D), FADU, CAL27 TR146 (D) cells were seeded 24 hours prior to analysis. Oxygen consumption (OCR) and lactic acid production (ECAR) were continuously measured throughout the experimental period at baseline and in the presence of indicated drugs. OLIGO= oligomycin 1 μg/ml, FCCP= FCCP 1 μM, ROT + ANTI= rotenone 1 μM, antimycin 1 μM. C) Cells were exposed to 2-DG [25 mM] and ECAR was measured continuously for the indicated time period. Note: A, B) Experiments were performed at least in duplicate. Representative tracings are presented for each cell line with inset values indicating average change from baseline across multiple experiments (+/− indicates standard error of the mean). D) Data are presented as average change from baseline across multiple experiments under indicated conditions (error bars represent standard error of the mean).
Existing literature conflicts as to the manner in which loss of wtTP53 alters mitochondrial function.7, 10, 11 Gene array analysis of all nuclear encoded mitochondrial related genes (including SCO1 and SCO2) demonstrated no significant differences between wild-type and mutant TP53 expressing HNSCC cells (data not shown). Staining of HNSCC cells with Mitotracker CMXRos demonstrated no difference in the amount of mitochondria between cells expressing wild-type and mutant TP53 (Fig. 5A). A more detailed in vitro analysis of individual complex activity in HN30 and HN31 cells demonstrated decreased activity for mitochondrial membrane enzyme complexes II, II+III and IV, with similar activity for complex I and I+III in the mutant p53 bearing HN31 cells. Citrate synthase activity was similar in both cell lines, suggesting similar mitochondrial biomass (Fig. 5B).
Figure 5. HNSCC cells expressing mutant TP53 maintain similar mitochondrial levels and citrate synthase activity but have decreased complex II, II+III and IV activity.
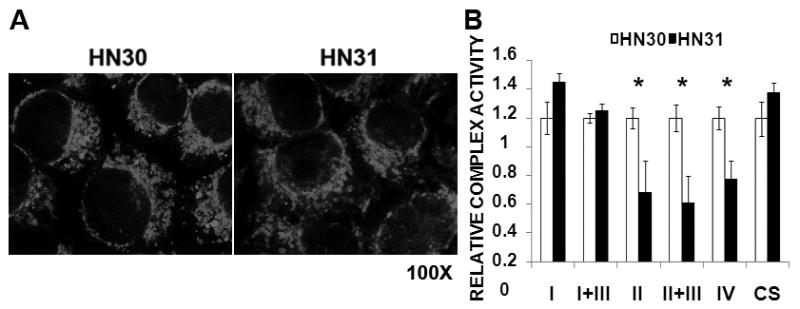
A) Cells were grown under standard conditions; mitochondria were highlighted using MitoTracker CMXROS. B) Cell lysates were analyzed for ETC complex activity in the presence of appropriate substrates and pharmacologic inhibitors of remaining complexes. Substrate reduction was assayed in real time for a period of 3 minutes and a complex activity rate was calculated. Each lysate was analyzed in duplicate. Complex activity was standardized to total citrate synthase (CS) activity. Data represent average values for 3 independent experiments. * indicates p-value <0.05.
Stable knock-down of p53 in HNSCC cells results in decreased mitochondrial capacity and increased sensitivity to 2-DG
Knock-down of wtTP53 using shRNA in HN30 cells resulted in decreased mitochondrial reserve capacity and increased susceptibility to 2-DG glycolytic inhibition (Fig. 6A, B). Decreased complex II, II+III and IV activity was detected in HN30shp53 cells compared to their HN30lenti counterpart (Fig. 6C); the magnitude of these differences was decreased compared to the parental cell lines, likely due to incomplete knockdown of wtp53 activity (data not shown). No consistent differences in mitochondrial activity were detected between HN31lenti and HN31 shp53 indicating that the loss of wtp53 function rather than gain of a mutp53 function is likely is underlying the mitochondrial alterations seen (data not shown). Analysis of Electron Transport Chain (ETC) complex activity in HN30, HN31, CAL27 and TR146 demonstrated that all 3 mutTP53 expressing HNSCC cell lines exhibit similar decreases in complex II, II+III and IV activity compared to HN30 (Fig. 6D).
Figure 6. Stable knock-down of TP53 in HNSCC cells results in decreased mitochondrial capacity and increased sensitivity to 2-DG.
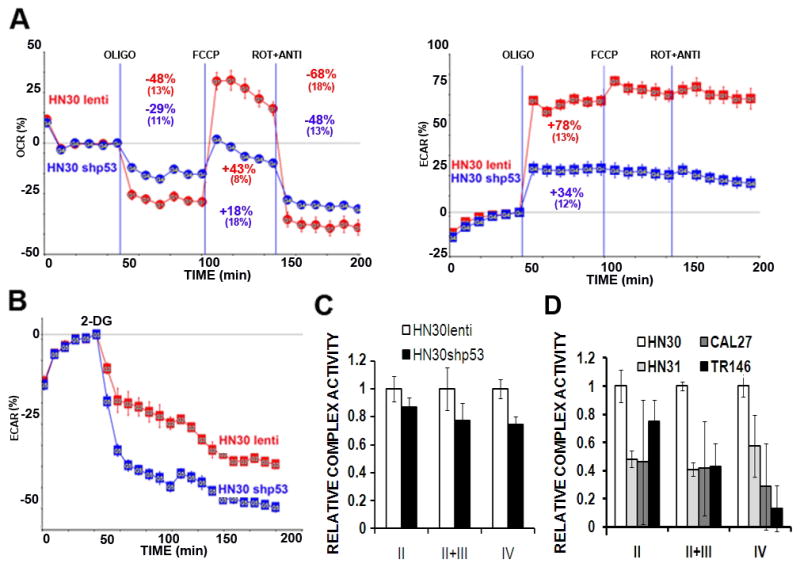
A) Cells were seeded 24 hours prior to analysis. Oxygen consumption (OCR) and lactic acid production (ECAR) were continuously measured throughout the experimental period at baseline and in the presence of indicated drugs. OLIGO= oligomycin 1 μg/ml, FCCP= FCCP 1 μM, ROT + ANTI= rotenone 1 μM, antimycin 1 μM. B) Cells were exposed to 2-DG [25 mM] and ECAR was measured continuously for the indicated time period. C, D) Cell lysates were analyzed for ETC complex activity in the presence of appropriate substrates and pharmacologic inhibitors of remaining complexes. Complex activity was standardized to total citrate synthase (CS) activity. Data represent averages of multiple independent experiments for each cell line.
Starvation activates catabolic mechanisms but not p53 stabilization in HNSCC cells
Previous studies have reported that glucose starvation or treatment with metabolic inhibitors (2-DG, metformin) can result in increased p53 protein levels.24 Starvation or treatment of HN30 cells with 2-DG failed to stabilize p53 levels in contrast to the elevation of p53 levels seen after treatment with the known DNA damaging agent, 5-fluorouracil (5-FU) (Fig. 7). Interestingly, both starvation and 2-DG decreased p53 levels at longer time points in both wtTP53 and mutTP53 expressing HNSCC cells (Fig. 7 and data not shown). This may represent a specific degradation phenomenon or simply indicate increased protein turnover due to energetic depletion. Lack of p53 stabilization in HN30 cells in response to metabolic stress was also confirmed using reverse phospho-protein analysis (RPPA) which failed to detect p53 phosphorylation at serine 15 in response to either glucose starvation or 2-DG treatment (data not shown). Glucose starvation and 2-DG inhibition of glycolysis triggered increased phosphorylation of AMPK, a key intra-cellular energy sensor. Phosphorylation of AMPK was more pronounced in HN31 compared to HN30, correlating with their respective sensitivity to glucose starvation. Activation of catabolic pathways in both cell lines is further demonstrated by increased cleavage of the autophagy marker, LC-3b (Fig. 7).
Figure 7. HNSCC starvation results in AMPK phosphorylation and LC-3b cleavage in the absence of p53 protein stabilization.
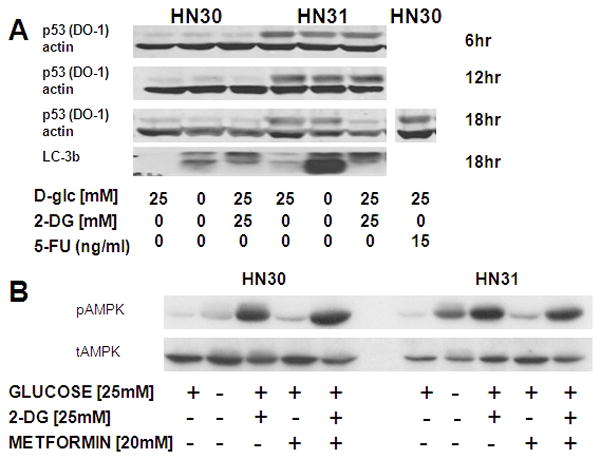
Cells were exposed to glucose starvation, 2-DG, metformin or 5-FU in the concentrations indicated. A) Glucose starvation or 2-DG failed to stabilize p53 protein levels, but resulted in activation of autophagy as indicated by LC-3b cleavage. B) Glucose starvation or treatment with 2-DG triggered phosphorylation of AMPK to a greater degree in mutant TP53 expressing cells.
Metformin potentiates the effects of 2-DG by impairing mitochondrial respiration in both wt and mutTP53 HNSCC
Metformin is a commonly used anti-diabetic drug, with demonstrated activity against mitochondrial respiration.25 As shown in Fig. 8A, C, metformin reduced HN30 oxygen consumption rates (OCR) to levels consistent with complete absence of mitochondrial activity. Both acute and prolonged exposure resulted in a compensatory increase in glycolytic activity (Fig. 8B, D). Consistent with its effects on altering mitochondrial activity, the addition of metformin significantly potentiated intra-cellular ROS levels in response to XRT (Fig. 8E). In combination with 2-DG, metformin resulted in potentiation of XRT toxicity, despite minimal single agent effects (Fig. 8F). Although in combination with 2-DG metformin triggered phosphorylation of AMPK, as a single agent, metformin did not induce increased pAMPK levels (Fig. 7).
Figure 8. Metformin inhibits mitochondrial respiration, potentiates ROS production and sensitizes wtTP53 HNSCC cells to XRT.
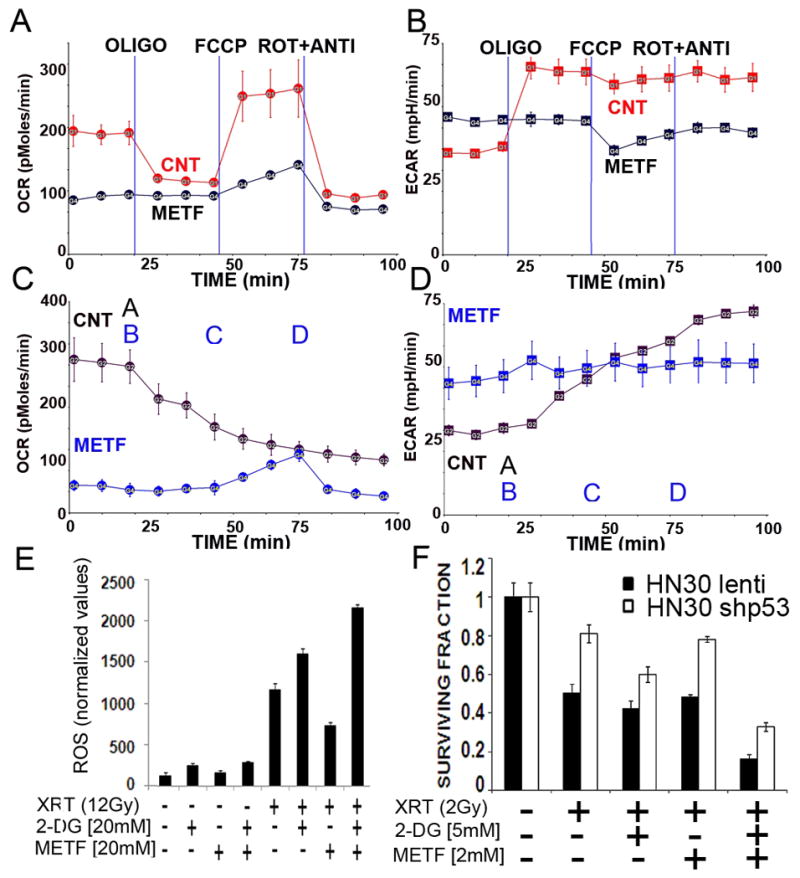
A–D) Cells were seeded 24 hours prior to analysis. OCR and ECAR were measured continuously for 100 min. METF= 16 hr pretreatment with metformin [10 mM]. A= metformin [30 mM] (applies to CNT curve only). B= oligomycin 1 μg/ml, C= FCCP 1 μM, D= rotenone 1 μM, antimycin 1 μM (applies to HN30 METF curve only). E) HN30 cells were pre-treated with 2-DG and/or metformin for 1 hr prior to XRT. Intra-cellular ROS levels were measured as described above. F) Cells were exposed to XRT in the presence of 2-DG and/or metformin and allowed to recover for 10 days. Colonies were counted and used to calculate surviving fraction.
Discussion
Tumor cell metabolism has received increased scrutiny over the last two decades as investigators seek out new biomarkers and therapeutic targets. Although specific alterations in tumor cell metabolism such as single gene (IDH1/IDH2) mutations are encountered only in a select number of solid tumors, generalized disruption of normal metabolic homeostasis may occur to some degree in all solid tumors.26 Chief among recorded metabolic perturbations is a shift away from mitochondrial respiration toward aerobic glycolysis.27 Although the precise sequence of events and driving forces which push tumor cells toward this metabolic phenotype remains in dispute, it is evident that multiple oncogenic events can play key roles in this metabolic shift.28 One oncogenic event that contributes to this metabolic shift is mutation of TP53, a gene which regulates cell metabolism through the transcriptional control of glucose transporters, glycolytic enzymes, mitochondrial associated genes and fidelity of mitochondrial DNA replication. 7,10,29 Overall, loss of wtTP53 is thought to contribute to an increased dependence on aerobic glycolysis. Here we provide evidence for a therapeutic strategy designed to address a difficult clinical scenario: mutant TP53 driven HNSCC. Over the last decade, significant advances in targeted therapies, improved fractionation of XRT and better strategies for combining chemotherapy and radiotherapy have helped provide more effective treatment strategies for patients with HNSCC.30 Despite these advances, the survival rates for patients with advanced HNSCC remain poor. TP53 is the most commonly altered gene in HNSCC, and TP53 mutations have been linked to poor clinical outcomes.4 To date, there are no clinically available treatment strategies designed to specifically address mutant TP53 disease and the associated radioresistance. Here, we propose a therapeutic approach which uses TP53 status to improve the therapeutic efficacy of specific anti-metabolic strategies.
Our previous analysis of HNSCC cell lines has revealed a generalized sensitivity to anti-glycolytic agents, though significant heterogeneity was observed in the relative response of HNSCC cell lines.17 Since relative resistance and sensitivity can be driven by changes in the functionality of a single transporter or enzyme, we chose 2 cell lines derived from the same patient, with an isogenic background. Our initial analysis demonstrated that HNSCC cells expressing wtTP53 possess improved resistance to glucose withdrawal, and relative resistance to 2-DG.17 In the current study we demonstrate a difference in mitochondrial respiratory capacity between these two isogenic HNSCC cell lines that is dependent on TP53 status. Specifically, although baseline respiration appears similar, the reserve mitochondrial capacity of HNSCC cells expressing mutTP53 is diminished, suggesting that under baseline conditions they function at maximal mitochondrial capacity. This is in stark contrast with HNSCC cells expressing wtTP53 which possess significant reserve respiratory capacity. Interestingly, the glycolytic compensation of HNSCC cells without wtTP53 was also blunted in the acute setting suggesting a globalized loss of metabolic flexibility due to maximal utilization of available pathways. It is important to note that these effects were measured under baseline conditions and do not take into account potential adaptation via up-regulation of glucose transporters or glycolytic enzymes which may take place during chronic conditions of metabolic stress. The relative sensitivity to 2-DG inhibition of glycolytic flux previously described was further validated in real time, suggesting increased reliance on glycolytic flux among HNSCC cells without functional p53.
The discussed TP53 driven metabolic differences are important for 2 reasons. First, they suggest that TP53 driven metabolic perturbations may play an important role in HNSCC pathogenesis. Second, they point to an opportunity for anti-metabolic strategies tailored to the underlying metabolic phenotype. As such, we investigated the potential of metformin to potentiate the cytotoxic effects of radiation in HNSCC cell lines. Although more specific mitochondrial inhibitors such as rotenone and cyanide are available, their generalized toxicity makes them unlikely therapeutic options. Metformin, a commonly used anti-diabetic drug, has been shown to inhibit respiration and potentiate the effects of 2-DG.25, 31, 32 Here, we demonstrate that acute exposure to metformin can abrogate mitochondrial respiration, increase intra-cellular ROS in response to 2-DG and XRT and potentiate the toxicity of XRT in combination with 2-DG. This is an important proof of principle that in cells maintaining high rates of both glycolytic activity and robust respiration, that a dual targeted anti-metabolic strategy can be effective in potentiating radiation toxicity. The effects of metformin on intra-cellular ROS and radiation toxicity are particularly intriguing insofar as they may represent a novel explanation for TP53 driven radiosensitivity in HNSCC. Altered mitochondrial respiration has been shown to impact sensitivity to XRT through changes in intra-cellular ROS.33–35 It is possible that the relative radiosensitivity and resistance observed amongst HNSCC cell lines may at least in part be driven by differential mitochondrial activity. Decreased mitochondrial activity and increased dependence on aerobic glycolysis suggests that in the setting of mutTP53, HNSCC cells may be particularly susceptible to the effects of anti-glycolytic agents such as 2-DG on the intra-cellular energy state and ROS generation.
Therapeutic strategies are generally predicated on a significant therapeutic index of the chosen agent or combination of agents. Although anti-metabolic strategies have demonstrated significant potential in the pre-clinical setting, clinical results have been disappointing. Targeted agents such as 2-DG, which has been under investigation for nearly half a century, have not demonstrated a consistent response in solid tumors even when combined with conventional treatment.36, 37 One possible explanation for this phenomenon is the lack of available predictors to define patient populations for existing and developing drugs. We suggest that, in HNSCC tumors which do not express wtTP53, glycolytic inhibition could result in significant radiosensitization, favorably impacting as many as 40–60% of HNSCC patients’ tumors. HNSCC cells which express wtTP53 are likely to be resistant to this approach. Therefore in these cells, the addition of mitochondrial inhibition via metformin may provide an appropriate alternative approach. The effectiveness of these strategies will require extensive testing in a pre-clinical in vivo model in order to further validate this in vitro study. Nevertheless, we suggest a novel approach to the treatment of HNSCC which takes into account TP53 mutational status in determining a choice of radiosensitizing anti-metabolic agents.
Acknowledgments
The authors would like to thank Jay Dunn, PhD (Seahorse Inc.) for assistance with metabolic analysis.
Grant Support: This research is supported in part by the National Institutes of Health through National Research Science Award Research Training Grant (NCI) T32CA060374 (VCS), NIH RO1 DE14613, M.D Anderson through M. D. Anderson’s Cancer Center Support Grant CA016672 and PANTHEON program, American Society for Radiation Oncology (ASTRO) Resident Seed Award (HDS), American Academy of Otolaryngology-American Head and Neck Society Young Investigator Combined Award (TJO), and by an American Academy of Otolaryngology- American Head and Neck Society CORE Pilot Grant (VCS). The content is solely the responsibility of the authors and does not necessarily represent the official views of the National Cancer Institute or the National Institutes of Health.
Footnotes
Financial disclosure: There are no financial disclosures from any authors.
References
- 1.American Cancer Society. Cancer Facts & Figures 2009. 2009. [Google Scholar]
- 2.Forastiere AA. Chemotherapy in the treatment of locally advanced head and neck cancer. J Surg Oncol. 2008;97(8):701–7. doi: 10.1002/jso.21012. [DOI] [PubMed] [Google Scholar]
- 3.Bradford CR, Zhu S, Ogawa H, Ogawa T, Ubell M, Narayan A, et al. P53 mutation correlates with cisplatin sensitivity in head and neck squamous cell carcinoma lines. Head Neck. 2003;25(8):654–61. doi: 10.1002/hed.10274. [DOI] [PubMed] [Google Scholar]
- 4.Poeta ML, Manola J, Goldwasser MA, Forastiere A, Benoit N, Califano JA, et al. TP53 mutations and survival in squamous-cell carcinoma of the head and neck. N Engl J Med. 2007;357(25):2552–61. doi: 10.1056/NEJMoa073770. [DOI] [PMC free article] [PubMed] [Google Scholar]
- 5.Goldstein I, Marcel V, Olivier M, Oren M, Rotter V, Hainaut P. Understanding wild-type and mutant p53 activities in human cancer: new landmarks on the way to targeted therapies. Cancer Gene Ther. 18(1):2–11. doi: 10.1038/cgt.2010.63. [DOI] [PubMed] [Google Scholar]
- 6.Martinez JD. Restoring p53 tumor suppressor activity as an anticancer therapeutic strategy. Future Oncol. 6(12):1857–62. doi: 10.2217/fon.10.132. [DOI] [PMC free article] [PubMed] [Google Scholar]
- 7.Matoba S, Kang JG, Patino WD, Wragg A, Boehm M, Gavrilova O, et al. p53 regulates mitochondrial respiration. Science. 2006;312(5780):1650–3. doi: 10.1126/science.1126863. [DOI] [PubMed] [Google Scholar]
- 8.Bakhanashvili M, Grinberg S, Bonda E, Simon AJ, Moshitch-Moshkovitz S, Rahav G. p53 in mitochondria enhances the accuracy of DNA synthesis. Cell Death Differ. 2008;15(12):1865–74. doi: 10.1038/cdd.2008.122. [DOI] [PubMed] [Google Scholar]
- 9.Zhou S, Kachhap S, Singh KK. Mitochondrial impairment in p53-deficient human cancer cells. Mutagenesis. 2003;18(3):287–92. doi: 10.1093/mutage/18.3.287. [DOI] [PubMed] [Google Scholar]
- 10.Lebedeva MA, Eaton JS, Shadel GS. Loss of p53 causes mitochondrial DNA depletion and altered mitochondrial reactive oxygen species homeostasis. Biochim Biophys Acta. 2009;1787(5):328–34. doi: 10.1016/j.bbabio.2009.01.004. [DOI] [PMC free article] [PubMed] [Google Scholar]
- 11.Kulawiec M, Ayyasamy V, Singh KK. p53 regulates mtDNA copy number and mitocheckpoint pathway. J Carcinog. 2009;8:8. doi: 10.4103/1477-3163.50893. [DOI] [PMC free article] [PubMed] [Google Scholar]
- 12.McFate T, Mohyeldin A, Lu H, Thakar J, Henriques J, Halim ND, et al. Pyruvate dehydrogenase complex activity controls metabolic and malignant phenotype in cancer cells. J Biol Chem. 2008;283(33):22700–8. doi: 10.1074/jbc.M801765200. [DOI] [PMC free article] [PubMed] [Google Scholar]
- 13.Quennet V, Yaromina A, Zips D, Rosner A, Walenta S, Baumann M, et al. Tumor lactate content predicts for response to fractionated irradiation of human squamous cell carcinomas in nude mice. Radiother Oncol. 2006;81(2):130–5. doi: 10.1016/j.radonc.2006.08.012. [DOI] [PubMed] [Google Scholar]
- 14.Reisser C, Eichhorn K, Herold-Mende C, Born AI, Bannasch P. Expression of facilitative glucose transport proteins during development of squamous cell carcinomas of the head and neck. Int J Cancer. 1999;80(2):194–8. doi: 10.1002/(sici)1097-0215(19990118)80:2<194::aid-ijc6>3.0.co;2-m. [DOI] [PubMed] [Google Scholar]
- 15.Sun W, Zhou S, Chang SS, McFate T, Verma A, Califano JA. Mitochondrial mutations contribute to HIF1alpha accumulation via increased reactive oxygen species and up-regulated pyruvate dehydrogenease kinase 2 in head and neck squamous cell carcinoma. Clin Cancer Res. 2009;15(2):476–84. doi: 10.1158/1078-0432.CCR-08-0930. [DOI] [PMC free article] [PubMed] [Google Scholar]
- 16.Zhou S, Kachhap S, Sun W, Wu G, Chuang A, Poeta L, et al. Frequency and phenotypic implications of mitochondrial DNA mutations in human squamous cell cancers of the head and neck. Proc Natl Acad Sci U S A. 2007;104(18):7540–5. doi: 10.1073/pnas.0610818104. [DOI] [PMC free article] [PubMed] [Google Scholar]
- 17.Sandulache VC, Ow TJ, Pickering CR, Frederick MJ, Zhou G, Fokt I, et al. Glucose, not glutamine, is the dominant energy source required for proliferation and survival of head and neck squamous carcinoma cells. Cancer. 2011 doi: 10.1002/cncr.25868. (Epub ahead of print) [DOI] [PMC free article] [PubMed] [Google Scholar]
- 18.Wu M, Neilson A, Swift AL, Moran R, Tamagnine J, Parslow D, et al. Multiparameter metabolic analysis reveals a close link between attenuated mitochondrial bioenergetic function and enhanced glycolysis dependency in human tumor cells. Am J Physiol Cell Physiol. 2007;292(1):C125–36. doi: 10.1152/ajpcell.00247.2006. [DOI] [PubMed] [Google Scholar]
- 19.Medja F, Allouche S, Frachon P, Jardel C, Malgat M, Mousson de Camaret B, et al. Development and implementation of standardized respiratory chain spectrophotometric assays for clinical diagnosis. Mitochondrion. 2009;9(5):331–9. doi: 10.1016/j.mito.2009.05.001. [DOI] [PubMed] [Google Scholar]
- 20.Kirby DM, Thorburn DR, Turnbull DM, Taylor RW. Biochemical assays of respiratory chain complex activity. Methods Cell Biol. 2007;80:93–119. doi: 10.1016/S0091-679X(06)80004-X. [DOI] [PubMed] [Google Scholar]
- 21.Eruslanov E, Kusmartsev S. Identification of ROS using oxidized DCFDA and flow-cytometry. Methods Mol Biol. 594:57–72. doi: 10.1007/978-1-60761-411-1_4. [DOI] [PubMed] [Google Scholar]
- 22.Rago R, Mitchen J, Wilding G. DNA fluorometric assay in 96-well tissue culture plates using Hoechst 33258 after cell lysis by freezing in distilled water. Anal Biochem. 1990;191(1):31–4. doi: 10.1016/0003-2697(90)90382-j. [DOI] [PubMed] [Google Scholar]
- 23.Zhang XD, Deslandes E, Villedieu M, Poulain L, Duval M, Gauduchon P, et al. Effect of 2-deoxy-D-glucose on various malignant cell lines in vitro. Anticancer Res. 2006;26(5A):3561–6. [PubMed] [Google Scholar]
- 24.Okoshi R, Ozaki T, Yamamoto H, Ando K, Koida N, Ono S, et al. Activation of AMP-activated protein kinase induces p53-dependent apoptotic cell death in response to energetic stress. J Biol Chem. 2008;283(7):3979–87. doi: 10.1074/jbc.M705232200. [DOI] [PubMed] [Google Scholar]
- 25.El-Mir MY, Nogueira V, Fontaine E, Averet N, Rigoulet M, Leverve X. Dimethylbiguanide inhibits cell respiration via an indirect effect targeted on the respiratory chain complex I. J Biol Chem. 2000;275(1):223–8. doi: 10.1074/jbc.275.1.223. [DOI] [PubMed] [Google Scholar]
- 26.Yan H, Parsons DW, Jin G, McLendon R, Rasheed BA, Yuan W, et al. IDH1 and IDH2 mutations in gliomas. N Engl J Med. 2009;360(8):765–73. doi: 10.1056/NEJMoa0808710. [DOI] [PMC free article] [PubMed] [Google Scholar]
- 27.Warburg O. On the origin of cancer cells. Science. 1956;123(3191):309–14. doi: 10.1126/science.123.3191.309. [DOI] [PubMed] [Google Scholar]
- 28.Vander Heiden MG, Cantley LC, Thompson CB. Understanding the Warburg effect: the metabolic requirements of cell proliferation. Science. 2009;324(5930):1029–33. doi: 10.1126/science.1160809. [DOI] [PMC free article] [PubMed] [Google Scholar]
- 29.Mathupala SP, Heese C, Pedersen PL. Glucose catabolism in cancer cells. The type II hexokinase promoter contains functionally active response elements for the tumor suppressor p53. J Biol Chem. 1997;272(36):22776–80. doi: 10.1074/jbc.272.36.22776. [DOI] [PubMed] [Google Scholar]
- 30.Pignon JP, le Maitre A, Maillard E, Bourhis J. Meta-analysis of chemotherapy in head and neck cancer (MACH-NC): an update on 93 randomised trials and 17,346 patients. Radiother Oncol. 2009;92(1):4–14. doi: 10.1016/j.radonc.2009.04.014. [DOI] [PubMed] [Google Scholar]
- 31.Guigas B, Detaille D, Chauvin C, Batandier C, De Oliveira F, Fontaine E, et al. Metformin inhibits mitochondrial permeability transition and cell death: a pharmacological in vitro study. Biochem J. 2004;382(Pt 3):877–84. doi: 10.1042/BJ20040885. [DOI] [PMC free article] [PubMed] [Google Scholar]
- 32.Ben Sahra I, Laurent K, Giuliano S, Larbret F, Ponzio G, Gounon P, et al. Targeting cancer cell metabolism: the combination of metformin and 2-deoxyglucose induces p53-dependent apoptosis in prostate cancer cells. Cancer Res. 70(6):2465–75. doi: 10.1158/0008-5472.CAN-09-2782. [DOI] [PubMed] [Google Scholar]
- 33.Chen S, Zhao Y, Zhao G, Han W, Bao L, Yu KN, et al. Up-regulation of ROS by mitochondria-dependent bystander signaling contributes to genotoxicity of bystander effects. Mutat Res. 2009;666(1–2):68–73. doi: 10.1016/j.mrfmmm.2009.04.006. [DOI] [PubMed] [Google Scholar]
- 34.Fath MA, Diers AR, Aykin-Burns N, Simons AL, Hua L, Spitz DR. Mitochondrial electron transport chain blockers enhance 2-deoxy-D-glucose induced oxidative stress and cell killing in human colon carcinoma cells. Cancer Biol Ther. 2009;8(13):1228–36. doi: 10.4161/cbt.8.13.8631. [DOI] [PMC free article] [PubMed] [Google Scholar]
- 35.Kim GJ, Fiskum GM, Morgan WF. A role for mitochondrial dysfunction in perpetuating radiation-induced genomic instability. Cancer Res. 2006;66(21):10377–83. doi: 10.1158/0008-5472.CAN-05-3036. [DOI] [PMC free article] [PubMed] [Google Scholar]
- 36.Maschek G, Savaraj N, Priebe W, Braunschweiger P, Hamilton K, Tidmarsh GF, et al. 2-deoxy-D-glucose increases the efficacy of adriamycin and paclitaxel in human osteosarcoma and non-small cell lung cancers in vivo. Cancer Res. 2004;64(1):31–4. doi: 10.1158/0008-5472.can-03-3294. [DOI] [PubMed] [Google Scholar]
- 37.Dwarakanath BS, Singh D, Banerji AK, Sarin R, Venkataramana NK, Jalali R, et al. Clinical studies for improving radiotherapy with 2-deoxy-D-glucose: present status and future prospects. J Cancer Res Ther. 2009;5 (Suppl 1):S21–6. doi: 10.4103/0973-1482.55136. [DOI] [PubMed] [Google Scholar]


