Abstract
The cAMP-response element-binding protein (CREB)-binding protein and p300 are two highly conserved transcriptional coactivators and histone acetyltransferases that integrate signals from diverse signal transduction pathways in the nucleus and also link chromatin remodeling with transcription. In this report, we have examined the role of p300 in the control of the G1 phase of the cell cycle in nontransformed immortalized human breast epithelial cells (MCF10A) and fibroblasts (MSU) by using adenovirus vectors expressing p300-specific antisense sequences. Quiescent MCF10A and MSU cells expressing p300-specific antisense sequences synthesized p300 at much reduced levels and exited G1 phase without serum stimulation. These cells also showed an increase in cyclin A and cyclin A- and E-associated kinase activities characteristic of S phase induction. Further analysis of the p300-depleted quiescent MCF10A cells revealed a 5-fold induction of c-MYC and a 2-fold induction of c-JUN. A direct target of c-MYC, CAD, which is required for DNA synthesis, was also found to be up-regulated, indicating that up-regulation of c-MYC functionally contributed to DNA synthesis. Furthermore, S phase induction in p300-depleted cells was reversed when antisense c-MYC was expressed in these cells, indicating that up-regulation of c-MYC may directly contribute to S phase induction. Adenovirus E1A also induced DNA synthesis and increased the levels of c-MYC and c-JUN in serum-starved MCF10A cells in a p300-dependent manner. Our results suggest an important role of p300 in cell cycle regulation at G1 and raise the possibility that p300 may negatively regulate early response genes, including c-MYC and c-JUN, thereby preventing DNA synthesis in quiescent cells.
The cAMP-response element-binding protein (CREB)-binding protein (CBP) and p300 are two highly conserved transcriptional coactivators that integrate diverse signal transduction pathways in the nucleus and also, by their intrinsic histone acetylase activity, link chromatin remodeling with transcription (reviewed in ref. 1). p300 and CBP have also been shown to acetylate certain transcription factors, thereby affecting their DNA-binding or transcriptional activation activities (2–4). Targeted gene disruption studies have shown that p300 is essential for normal cell proliferation and development (5), and haploinsufficiency of CBP in humans gives rise to severe abnormalities characteristic of Rubinstein–Taybi syndrome (6). Similar abnormalities are observed in mice lacking one allele of CBP but not p300, suggesting that these two proteins have certain nonoverlapping functions (7). p300 and CBP are mutated in several cancers, suggesting a tumor-suppressor function of these proteins (reviewed in refs. 1 and 8).
Evidence for a role for p300 and CBP in cell cycle progression has been until now scant and indirect. Earlier studies have shown that adenoviral protein E1A can stimulate DNA synthesis in quiescent baby rat kidney cells through its p300/CBP-binding region, implying that p300/CBP may play a role in cell cycle regulation (9). E1A can also restimulate DNA replication in terminally differentiated cardiac myocytes through its p300/CBP-binding domain (10). There is evidence that p300 is involved in terminal differentiation in several cell types, including muscles, neurons, and enteroendocrine cells (1). During terminal differentiation, p300 transactivates p21 in cooperation with Sp1, Sp3, or tissue-specific transcription factors, suggesting that p300 may play a role in keeping cells in G0/G1 (1, 11). However, fibroblasts from p300 knockout mice are unable to replicate and appear to undergo cell cycle arrest, suggesting that some p300 function may be necessary for cell cycle progression (5). p300 is able to act as coactivator for both growth stimulatory transcription factors, such as E2F, and growth inhibitory proteins, such as p53 (2, 12). Therefore, the overall role of p300 in the cell cycle is unclear.
In this paper, we show that p300 plays a critical role in preventing DNA synthesis during G0/G1 phase of the cell cycle. Antisense (AS)-mediated depletion of p300 in quiescent cells caused a dramatic up-regulation of cyclin E and cyclin A/cyclin-dependent kinase (CDK) activities and onset of DNA synthesis. These cells showed elevated levels of c-MYC and c-JUN expression upon p300 depletion. By using appropriate AS vectors directed against c-MYC and c-JUN, we show that elevated levels of c-MYC are primarily responsible for the onset of DNA synthesis. Thus our results define a role for p300 in preventing DNA synthesis in G0/G1 cells.
Materials and Methods
Cells and Viruses.
MCF10A cells, a nontransformed human breast epithelial cell line, arose as a spontaneous immortalization of normal breast epithelial cells derived from a reduction mammoplasty specimen (13). MSU cells are v-MYC transformed, nontumorigenic, near diploid human fibroblasts with normal morphology. The growth conditions for these two cell lines were described earlier (14, 15). AS-1 and AS-2 are two replication defective adenovirus (Ad) vectors that express the 5′ 1784 or 3905 nucleotides, respectively, of p300 sequences in an AS orientation under the CMV promoter in the E1A region. Ad vectors AS-c-Myc and AS-c-Jun express human c-MYC and c-JUN coding sequences in AS orientation, respectively. Ad-β-galactosidase (Ad-β-gal) virus expressing β-galactosidase was used as control vector in all experiments reported here. All of the above-mentioned viruses were constructed as described (16). An Ad variant that expresses E1A-transforming protein (dl1500) and the mutant in which E1A residues 2–36 are deleted (dl2–36) were gifts of E. Moran, Temple University (9). Ad c-MYC was a kind gift from W. El-Diery, University of Pennsylvania (17). Ad-MAD was a gift of P. Nisen of Abbott Laboratory (18). In all experiments, cells were seeded at a density of 1 × 10⁶ cells per 100-mm dish and were serum starved for 16 h, infected at 200 plaque-forming units (pfu)/cell with appropriate Ad vectors under continued serum-starvation conditions.
Other Procedures.
MCF10A cells synchronized by serum starvation and infected with appropriate Ad vectors were harvested at different time intervals for FACS analysis or lysed with RIPA buffer (14) for immunoblotting and a kinase lysis buffer for CDK assays (19). CDK assays were carried out either with α-cyclin E or α-cyclin A antibodies, as described (19). Procedures for RNA extraction and the details of the probes used for assaying c-MYC, p21, and GAPDH mRNAs are described in a previous report (14). The riboprobe for carbomyl phosphate synthetase, aspartate transcarbomylase and dihydroorotase (CAD) was a gift of P. Farnham, University of Wisconsin. All RNase protection assays were carried out by using the RPNII kit from Ambion (Austin, TX). For transfection assays, MCF10A cells were transfected by using Superfect from Qiagen (Chatsworth, CA), and the luciferase activity was measured by using the Luciferase assay kit from Promega. The two plasmids, TBE1/2 and TBE1 m/2 m, were gifts of Bert Vogelstein, Johns Hopkins University. The plasmid TBE1/2 contains a 586-bp c-MYC promoter (20) placed upstream of c-FOS minimal promoter linked to the luciferase reporter. Plasmid TBE1 m/2 m contains mutations of the two T cell factor (TCF)-4-binding sites within the 586 bp of the c-MYC promoter sequence.
Results
Cells Expressing AS p300 Sequences Synthesize p300 in Much Reduced Amounts and Exit G1 Without Serum.
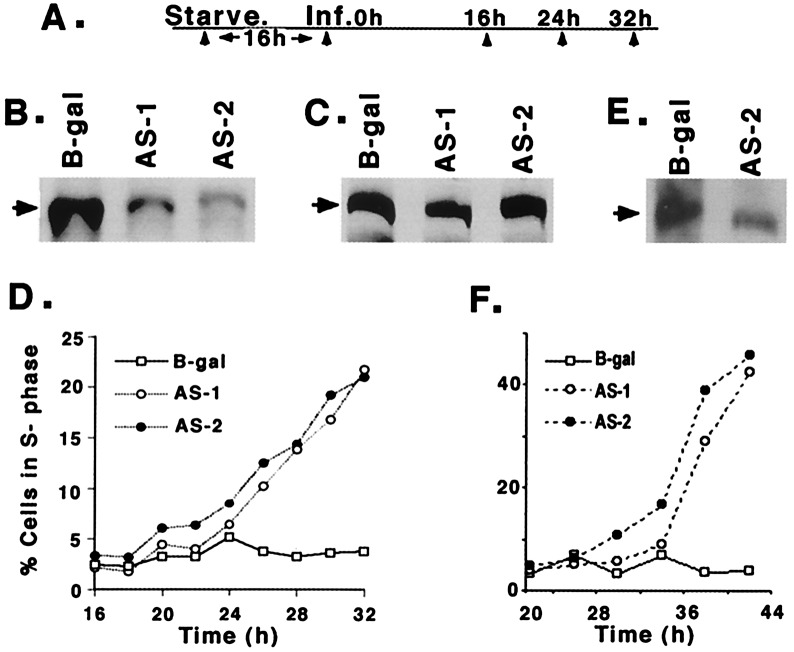
To efficiently deplete p300 levels in a population of cells, we constructed two replication-defective Ad vectors, AS-1 and AS-2, which express the first 1,784 or 3,905 nucleotides of p300 sequences in the AS orientation. Fig. 1 B and C show that the serum-starved MCF10A cells (see Fig. 1A for time course of infection) infected with these AS p300 vectors synthesize p300 at dramatically reduced levels, without altering the levels of CBP. This selective reduction of p300, but not CBP, also indicates that these AS vectors may not have affected the synthesis of other cellular proteins. To determine whether depletion of p300 affected cell cycle progression, cells infected as above were harvested for FACS analysis. AS-1- and AS-2-infected cells began to exit G1 by about 18–20 h after infection, and the percentage of cells in S phase continued to rise steadily, reaching about 20–25% at 32 h. In contrast, more than 90% of the cells infected with control vector expressing βgalactosidase (Ad-β-gal) remained in G1, indicating that the Ad vector per se had no effect on cell cycle progression (Fig. 1D). By using terminal deoxynucleotidyltransferase-mediated UTP end labeling (TUNEL) assay (21), we found no evidence of apoptosis in these cells at any of the time points used here (data not shown). Thus we conclude that the depletion of p300 in MCF10A cells causes these cells to synthesize DNA under serum-starvation conditions.
Figure 1.
Levels of p300 and CBP and S phase induction in quiescent MCF10A and MSU cells infected with Ad vectors expressing p300-specific AS sequences, AS-1 and AS-2. (A) Schematic representation of the time course used for infection of MCF10A cells with Ad vectors for cell cycle analysis, protein, and RNA quantitation. (B) Western blot showing reduced levels of p300 in AS-1- and AS-2-infected cells. Serum-starved MCF10A cells were infected with Ad vectors at 200 pfu/cell and 18 h after infection cells were lysed in RIPA buffer (14). Fifty micrograms of the protein was Western immunoblotted by using a SDS/7% polyacrylamide gel with an α-p300 polyclonal antibody (sc-584; Santa Cruz Biotechnology). Arrow shows the position of p300. All of the gels shown here and in the following figures were quantitated by using a densitometer (Molecular Dynamics). (C) Western blot showing equal levels of CBP in cells infected with AS-1, AS-2, and Ad-β-gal. Fifty micrograms of protein from the same cell lysate was Western immunoblotted with α-CBP polyclonal antibody (sc-369; Santa Cruz Biotechnology). (D) Induction of DNA synthesis in quiescent MCF10A cells infected with p300 AS vectors. MCF10A cells were infected as shown in Fig. 1A and the cells were harvested at the indicated times. The percentage of cells in G1, S, and G2-M were quantitated by FACS analysis as described in Materials and Methods. (E) Western blot shows depletion of p300 in AS p300-infected MSU cell lysates prepared as described above. MSU cells were serum starved for 48 h before infection. (F) Induction of DNA synthesis in serum-starved p300-depleted MSU cells as determined by FACS analysis.
To determine whether premature S phase induction of AS p300-infected cells also occurred in other human cell types, we used human fibroblasts (MSU), which can be readily growth arrested by serum starvation (15). p300 levels were significantly reduced in these serum-starved cells when infected with AS-1 or AS-2 (Fig. 1E; data not shown), and a significant number of these cells entered S phase early (Fig. 1F). Thus we conclude that a significant reduction in the levels of p300 in quiescent human cells leads to an induction of DNA synthesis.
Cells Depleted of p300 Show Elevated Levels of Cyclin A, Cyclin A/CDK2, and Cyclin E/CDK2 Activity.
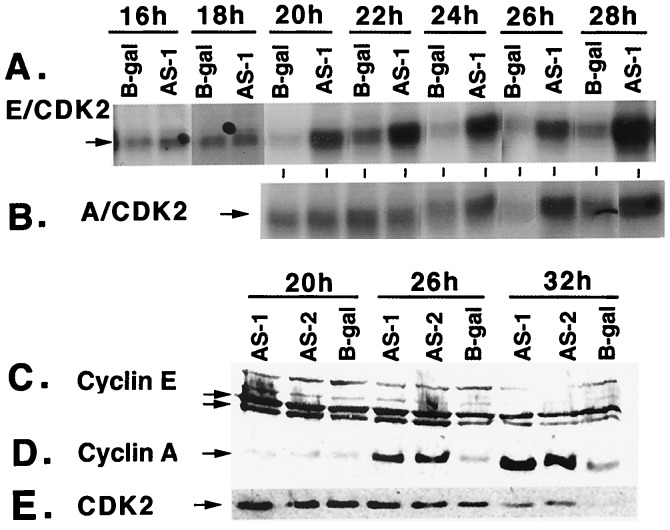
To determine whether induction of DNA synthesis in p300-depleted MCF10A cells is associated with increased levels of S phase-specific cyclins and associated CDK activities, cyclins E and A and the associated kinase activities of serum-starved MCF10A cells infected as shown in Fig. 1A were determined. Fig. 2A shows a significant increase in cyclin E-associated CDK2 activity starting from 20 h after infection, whereas the increase in cyclin A-associated CDK2 activity was observed a few hours later, starting from about 24 h after infection (Fig. 2B). Cyclin A levels were also up-regulated (Fig. 2D), whereas there was no change in cyclin E levels (Fig. 2C). There was a modest increase in CDK2 levels at 26- and 32-h time points (Fig. 2E); however, this small increase in CDK2 levels cannot account for the dramatic increase in cyclin E/CDK2 and cyclinA/CDK2 activities (Fig. 2 A and B).
Figure 2.
Analysis of cyclin A, cyclin E, CDK2, and CDK2 activity in quiescent MCF10A cells expressing p300 AS sequences. (A) Autoradiogram showing cyclin E/CDK2 activities of the cell lysates prepared at different time periods of infection. Infection protocols were as shown in Fig. 1A. One hundred micrograms of the protein was immunoprecipitated with α-cyclin E antibody, and the immunoprecipitated complexes were incubated with γ [32P]ATP and histone H1 (19). Phosphorylated histones were analyzed on a SDS/12% PAGE. (B) Autoradiogram showing cyclin A/CDK2 activities of cell lysates used in A. One hundred micrograms of the protein was immunoprecipitated with αcyclin A antibody, and the immunoprecipitated complexes were incubated with γ [32P]ATP and histone H1. Phosphorylated histones were analyzed on a SDS/12% PAGE. (C) Western blot showing levels of cyclin E in cells infected with Ad vectors at 20, 26, and 32 h after infection. Fifty micrograms of the protein from cell lysates was fractionated on SDS/10% PAGE and probed with an α-cyclin E antibody (sc-247; Santa Cruz Biotechnology). The arrows point to the cyclin E doublet. All Western blot membranes in this report were reprobed with α-actin antibody for loading control (data not shown). (D) Western blot showing levels of cyclin A in cell lysates used in C. Fifty micrograms of the protein from cell lysates was fractionated on SDS/10% PAGE and probed with an α-cyclin A antibody (sc-751; Santa Cruz Biotechnology). (E) Western blot showing CDK2 protein levels in serum-starved MCF10A cells infected with Ad vectors at various time points. Fifty micrograms of the protein from cell lysates was fractionated on a SDS/10% PAGE and immunoblotted by using α-CDK-2 antibody (sc-163; Santa Cruz Biotechnology).
p300-Depleted Cells Show Elevated Levels of c-MYC and c-JUN Protein and c-MYC RNA.
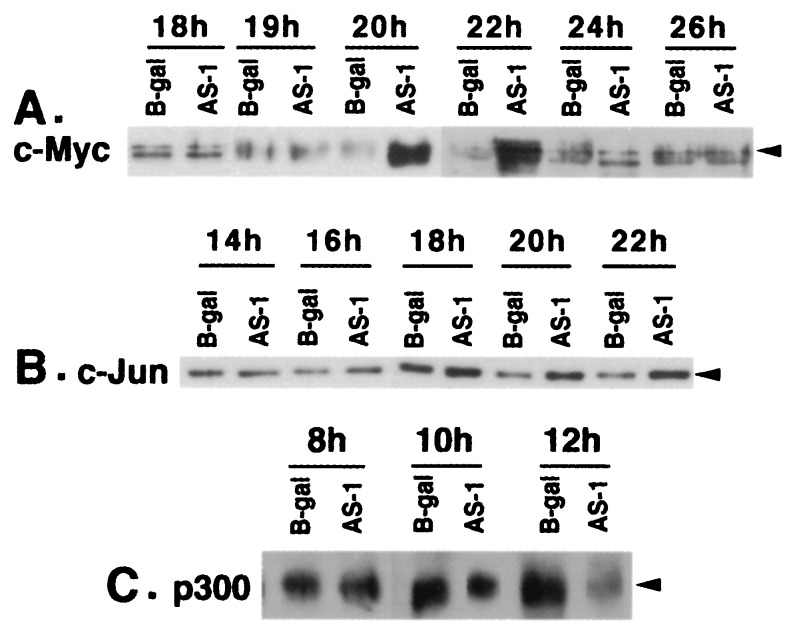
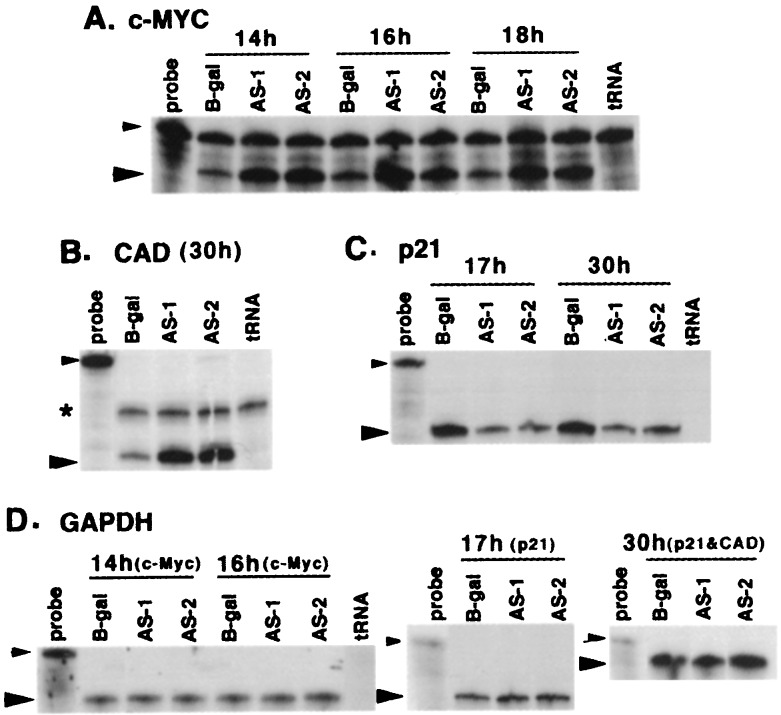
Because the p300-depleted cells exited G0/G1 without serum stimulation and showed an increase in cyclin A and cyclin E/CDK2 and cyclin A/CDK2 activities, it seemed possible that perturbations of molecular signals much earlier in G1 could be responsible for this phenotype. Other studies have shown that serum-starved cells overexpressing c-MYC start DNA synthesis under growth-arrested conditions and show increased cyclin A levels (22). Therefore, we reasoned that early DNA synthesis in p300-depleted cells may be caused by up-regulation of c-MYC and other early response genes. Accordingly, levels of c-MYC, c-JUN, and c-FOS were determined by using Western blots. As shown in Fig. 3A, c-MYC levels in AS-1- and AS-2-infected cells began to rise starting at 19 h, remained at high levels until 22 h after infection, and returned to normal levels thereafter. Levels of c-JUN also increased at about the same time (Fig. 3B). c-FOS protein levels in these cells did not appear to change in a Western blot analysis of lysates prepared at 15-min intervals starting 9.5–22.5 h after infection (data not shown). However, an extremely transient induction of c-FOS in these cells cannot be excluded. Quantitation of c-MYC RNA levels by RNase protection assay indicated MYC RNA levels also increased by about 5-fold in both AS-1- and AS-2-infected cells starting from 14 h after infection (Fig. 4A), about 4–5 h before the increase in protein levels (Fig. 3A). There was no change in MYC RNA levels at the 10-h time point and only a marginal increase at 12 h after infection (data not shown). To determine whether depletion of p300 by AS p300 vectors precedes c-MYC up-regulation, p300 depletion in AS p300-infected cells was monitored starting from 8 h after infection. As seen in Fig. 3C, p300 levels did not change at the 8-h time point but were moderately reduced at 10 h and significantly reduced at 12 h after infection. This is about 2–3 h before the increase in c-MYC RNA (Fig. 4A). To determine whether the increase in c-MYC leads to an increase in the expression of c-MYC target genes, we quantitated the mRNA levels of CAD required for pyrimidine biosynthesis (23), a definitive downstream target of c-MYC (24). As expected, there was a 10-fold increase in CAD mRNA levels at 30 h after infection (Fig. 4B). We also found a 4-fold decrease in p21 levels when p300 was depleted in MCF10A cells (Fig. 4C). This is consistent with a transcriptional coactivator role of p300 in p53-induced expression of p21 (11). Levels of other inhibitors p27 and p57 (MCF10A cells lack p16) did not change (data not shown).
Figure 3.
Levels of c-MYC, c-JUN, and p300 in serum-starved MCF10A cells infected with AS p300 vectors. (A) Western immunoblot of c-MYC in quiescent MCF10A cells infected with AS-1 or β-gal vectors. Twenty micrograms of the protein from cell lysates prepared from MCF10A cells at indicated time points was immunoblotted by using an α-c-MYC polyclonal antibody (sc-764; Santa Cruz Biotechnology). (B) Western analysis of c-JUN in serum-starved MCF10A cells infected with Ad vectors. Twenty micrograms of protein from the cell lysates used in A was assayed by Western immunoblotting by using an α-c-JUN antibody (sc-1694; Santa Cruz Biotechnology). (C) Time course of p300 depletion in serum-starved MCF10A cells. Fifty micrograms of the protein lysates at different time periods of infection was analyzed by Western immunoblotting by using an α-p300 antibody (sc-584, Santa Cruz Biotechnology).
Figure 4.
Riboprobe analysis of c-MYC, CAD, and p21. (A) RNase protection assay of c-MYC RNA. Twenty micrograms of total RNA extracted from MCF10A cells infected with AS vectors at indicated time points was assayed by RNase protection assay by using a c-MYC specific riboprobe (14). In the Probe lane, 1/100 of the radioactive probe used in RNase protection assays was loaded directly. The smaller arrow indicates the undigested probe, whereas the larger arrow indicates the protected fragment. Details of the probes and the procedures were as described in Materials and Methods. (B) RNase protection assay of CAD mRNA in quiescent MCF10A cells infected with Ad vectors at 30 h after infection. Thirty micrograms of the total RNA was used for the assay by using a CAD riboprobe. In the Probe lane, 1/100 of the probe used in the assay was loaded directly on the gel. As above, the small arrow points to the probe and the large arrow to the protected fragment. The asterisk indicates a nonspecific band. (C) RNase protection assay of p21 mRNA in AS-infected MCF10A cells at 17 and 30 h after infection. Twenty micrograms of total RNA was used in the assay. In the Probe lane, 1/100 of the probe used for assay was loaded directly. The small arrow points to the probe, whereas the large arrow points to the p21-protected fragment. (D) RNase protection assay for GAPDH mRNA samples used in Fig. 4 A, B, and C. Five micrograms of the total RNA was assayed by using a riboprobe specific for GAPDH. Data for the 18-h time point are not shown.
DNA Synthesis in p300-Depleted Cells Is Reversed by Inhibitors of c-MYC Expression.
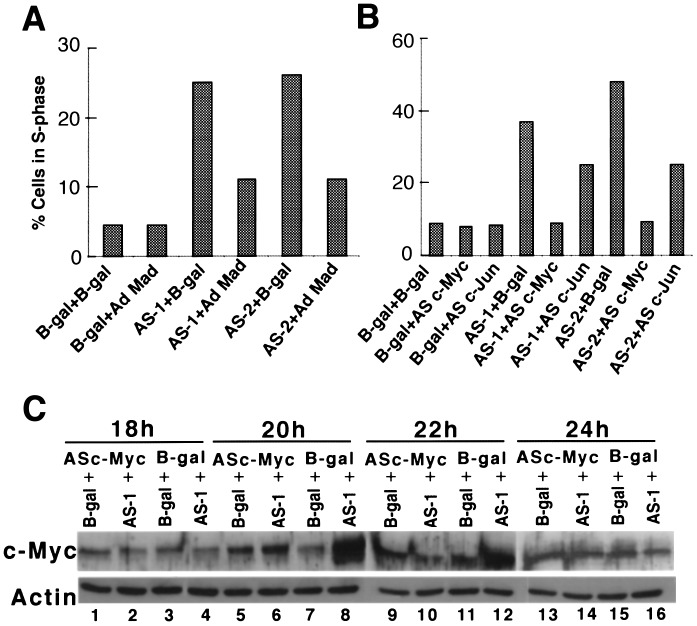
We reasoned that if up-regulation of c-MYC in p300 depleted cells was responsible for induction of DNA synthesis, then inhibition of c-MYC function in AS infected cells should prevent DNA synthesis. Cell cycle progression in MCF10A cells coinfected with an Ad vector expressing the inhibitor of c-MYC, MAD (Ad-MAD; ref 25), and AS-1 or AS-2 was monitored by FACS analysis. Ad-β-gal was used as a control for Ad-MAD to maintain the multiplicity of infection constant. As expected, expression of MAD in p300 depleted cells reduced the number of S phase cells by about 2.5-fold when compared with cells infected with AS-1 or AS-2 and Ad-β-gal (Fig. 5A). To obtain more direct evidence for the involvement of c-MYC, serum-starved MCF10A cells were coinfected with AS-1 or AS-2 and an Ad vector expressing AS c-MYC (AS-c-Myc). Fig. 5B shows that when cells were infected simultaneously with AS-1 or AS-2 and AS-c-Myc, premature DNA synthesis was abolished. Infection of MCF10A cells with AS-c-Myc 6 h before or 6 h after infection with AS-1 or AS-2 also abolished early DNA synthesis (data not shown). To confirm that the reversal of DNA synthesis in p300-depleted cells by AS-c-Myc is the result of AS-c-Myc-specific inhibition of c-MYC protein synthesis, c-MYC protein levels in cells infected with AS-1 and AS-c-Myc in appropriate combinations (see Fig. 5 B and C legends) were quantitated. As shown in Fig. 5C, levels of c-MYC increased several-fold in cells infected with AS-1 at 20 and 22 h (lanes 8 and 12, respectively). This induction of c-MYC synthesis was dramatically reduced when these cells were coinfected with AS-1 and AS-c-Myc (compare lane 8 with 6 and 12 with 10). To determine whether MYC alone is capable of forcing MCF10A cells to enter into S phase in the absence of serum, we overexpressed c-MYC in serum-starved MCF10A cells by using an Ad vector expressing c-MYC (Ad-c-Myc). FACS analysis of these cells indicated that a significant number of these cells entered S phase by about 24 h after infection (Table 1). Note that at the 40-h time point, there is a significant increase of MYC overexpressing cells in G2/M phase, indicating that these cells have traveled through S phase.
Figure 5.
Reversal of p300 depletion-dependent premature S phase induction. (A) Inhibition of premature S phase induction in p300-depleted MCF10A cells by overexpression of MAD. Serum-starved MCF10A cells were coinfected with AS Ad vectors at 200 pfu/cell with or without Ad-MAD (100 pfu/cell), which expresses MAD protein. Ad-β-gal was always used to maintain the multiplicity of infection uniform in all experiments. (B) Reversal of early S phase entry in p300-depleted cells. Serum-starved MCF10A cells were coinfected with either AS p300 sequences and AS-c-Myc or AS-c-Jun. Ad-β-gal was used to maintain the multiplicity of infection. (C) Inhibition of c-MYC protein synthesis in p300 depleted cells. Serum-starved MCF10A cells were coinfected with different adenoviral vectors in combinations as indicated below. In lanes 1, 5, 9, and 13 Ad-β-gal was mixed with AS-c-Myc; in lanes 2, 6, 10, and 14 AS-1 was mixed with AS-c-Myc; in lanes 3, 7, 11, and 15 Ad-β-gal was mixed with Ad -β-gal and in lanes 4, 8, 12, and 16, Ad-β-gal was mixed with AS-1. Protein lysates obtained from these cells at different periods of infection were assayed for c-MYC protein levels by Western blot analysis. Western blot membrane shown (Upper) was reprobed with α-actin antibody.
Table 1.
Distribution of quiescent MCF10A cells infected with Ad-β-gal or Ad-c-MYC vectors in G1/S/G2-M phases of cell cycle
| Vector | 24 h | 32 h | 40 h |
|---|---|---|---|
| G1/S/G2-M | G1/S/G2-M | G1/S/G2-M | |
| Ad-β-gal | 92/2/6 | 90/3/7 | 90/3/7 |
| Ad c-Myc | 84/8/8 | 74/13/13 | 71/10/19 |
The numbers represent percentage of cells in respective phases of the cell cycle.
Because c-JUN was also up-regulated in p300-depleted cells (Fig. 3B), we determined to what extent this increase in c-JUN contributes to early DNA synthesis. Coinfection of serum-starved MCF10A cells with AS-1 or AS-2 and an Ad vector expressing AS c-JUN sequences (AS-c-Jun) led to a 30–40% decrease in the number of S phase cells when compared with cells coinfected with AS-1 or AS-2 and Ad-β-gal (Fig. 5B). Coinfection with an Ad vector expressing Tam67, a dominant–negative form of c-JUN (26), also showed similar results (data not shown). Thus we conclude that up-regulation of both c-MYC and c-JUN contributes to the induction of DNA synthesis in p300-depleted serum-starved cells; however, the induction of c-MYC appears to be primarily responsible for the ability of quiescent p300-depleted cells to enter S phase.
Up-Regulation of Transiently Transfected c-MYC Promoter in p300 Depleted Cells.
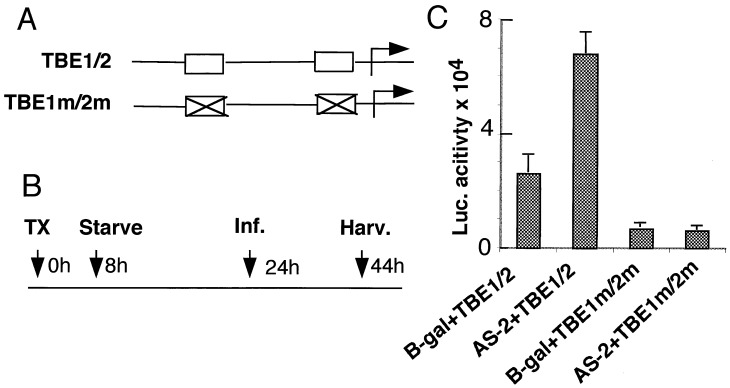
We next attempted to study the mechanism by which c-MYC is up-regulated in p300-depleted cells. Other studies have shown that Drosophila TCF activity is negatively regulated by CBP (4) and that in mammalian cells, TCF-4 transactivates c-MYC (20) and c-JUN (27) through their TCF-4-binding sites. Hence MCF10A cells were transfected for 8 h with either MYC promoter–reporter plasmid TBE1/2 containing two TCF-4 binding sites or TBE1 m/2 m, in which the two TCF-binding sites were mutated (Fig. 6A; ref 20). They were then serum starved for 16 h and infected with either AS-2 or Ad-β-gal for 20 h under serum starvation and then assayed for luciferase activity (Fig. 6B). As seen in Fig. 6C, the c-MYC promoter-dependent reporter activity increased by about 2- to 3-fold in p300-depleted cells, and this increase appeared to depend on the two TCF-binding sites, because reporter activity of the TBE1 m/2 m did not increase in p300-depleted cells.
Figure 6.
Up-regulation of c-MYC promoter in p300-depleted cells. (A) Diagram of the TBE1/2 (wild-type MYC) and TBE1 m/2 m in which two TCF-4-binding sites are mutated (20). (B) Time course of promoter–reporter assay. MCF 10A cells were transfected (TX) with appropriate reporter plasmids, serum starved, and infected with Ad vectors before being harvested for luciferase assay as shown. (C) MYC promoter-reporter activity in p300-depleted cells. Cells harvested after transfection and infection as described in B were assayed for luciferase activity. Average values of three experiments with error bars are shown.
Quiescent Cells Expressing E1A Exit G1 and Up-Regulate c-MYC and c-JUN.
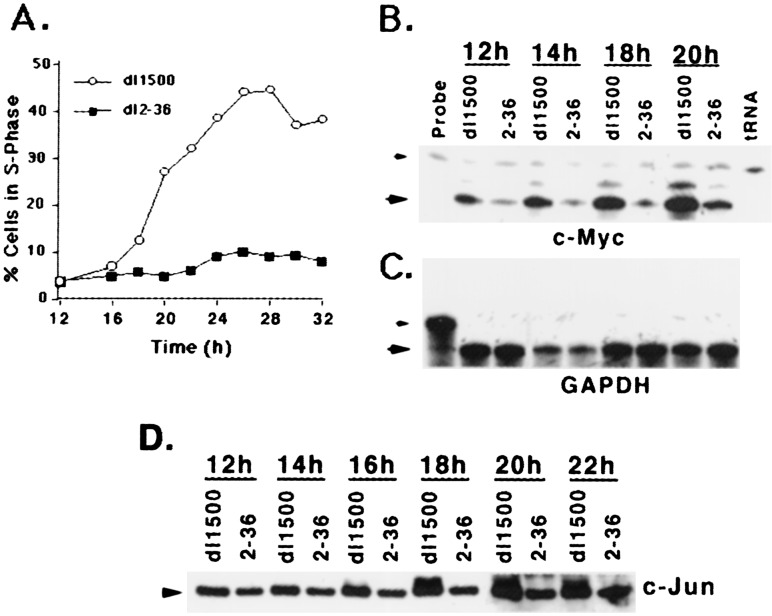
To obtain independent evidence that depletion of p300 in quiescent human cells leads to up-regulation of c-MYC and c-JUN and DNA synthesis, we used an Ad variant that expresses E1A (dl1500) that binds to p300 and abrogates p300 function. A mutant of E1A that could no longer bind p300 (dl2–36) served as a control (9). FACS analysis showed that dl1500-infected cells begin to enter S phase early, rapidly peaking around 26–28 h after infection. In contrast, less than 10% of the cells infected with dl2–36 were found in S phase at these time points (Fig. 7A). Riboprobe analysis showed that c-MYC RNA levels began to increase by about 12 h after infection, with a significant increase by about 14–16 h in dl1500-infected cells when compared with those infected with dl2–36 (Fig. 7B; data for earlier time points not shown). c-JUN protein levels also increased considerably at about 20 h after infection, with dl1500 (Fig. 7D). In summary, abrogation of p300 function by Ad E1A also leads to up-regulation of c-MYC and c-JUN expression and induction of DNA synthesis and provides additional evidence for the contention that in quiescent cells, p300 maintains G0/G1 arrest by negatively regulating c-MYC and c-JUN.
Figure 7.
S phase induction and c-MYC RNA and c-JUN protein in quiescent MCF10A cells infected at 20 pfu/cell with dl1500 (wild-type E1A) and dl2–36 (mutant E1A that does not bind to p300). (A) Cell cycle analysis of serum-starved cells infected with dl1500 or dl2–36. Cells were serum starved, infected, and harvested at the indicated times, and percent cells in S phase were quantitated by FACS analysis. (B) Levels of c-MYC RNA at the indicated times after infection. Riboprobe analysis was carried out as described in legend to Fig. 4A. The protected fragment is shown by a large arrow, whereas the undigested probe is indicated by a small arrow. (C) RNase protection assay for GAPDH mRNA for the RNA samples used in B. Details for the assay conditions are as shown in Fig. 4D. (D) Western analysis of c-JUN in quiescent MCF10A cells infected with dl1500 and dl2–36. Twenty micrograms of protein was Western immunoblotted by using an α-c-JUN polyclonal antibody (sc-1694; Santa Cruz Biotechnology).
Discussion
Our studies show that p300 depletion profoundly disturbs the G0/G1 phase of the cell cycle. Introduction of p300 AS or Ad E1A into serum-starved human cells leads to DNA synthesis in the absence of serum stimulation. E1A is more efficient in this regard, most likely because this protein abrogates the function of both p300 and CBP. It is also possible that E1A is simply more effective at inhibiting the activity of p300 than are the AS p300 viruses. Our data suggest that early DNA synthesis in G0 cells by p300 depletion is the result of c-MYC activation. This phenotype in many respects is similar to that observed when c-MYC is inappropriately induced in serum-starved and density-arrested cells (28). In these cells, cyclin E-associated kinase activity was increased although cyclin E levels were not, and cyclin A levels and kinase activity were both increased. We show that in our studies, c-MYC RNA and protein increased significantly in p300-depleted cells hours before cells enter S phase. A similar effect was also seen when p300 function was abrogated through E1A (Fig. 7 A–D). Transcriptional activation of CAD, a direct target of c-MYC (24) and an essential gene in DNA synthesis, provides evidence that c-MYC induction contributes to the induction of DNA synthesis.
Several observations presented in this report argue that c-MYC up-regulation is a consequence of p300 depletion in serum-starved cells, and this c-MYC induction is primarily responsible for the induction of DNA synthesis. First, c-MYC up-regulation occurs several hours after p300 depletion (Fig. 3 A and C). Second, AS-c-Myc reverses the induction of c-MYC synthesis to basal levels and in turn prevents S phase entry when coinfected with AS-1 (Fig. 5 B and C). Third, infection of quiescent MCF10A cells with AS-c-Myc several hours before or after infection with the AS p300 vector abrogates early DNA synthesis phenotype. Fourth, overexpression of c-MYC alone in serum-starved cells results in a significant number of cells exiting G1. We believe that a 2-fold induction of c-JUN detected in p300 depleted cells contributes to DNA synthesis in these cells only to a moderate extent. This estimation is based on our data, which show that Ad vectors expressing AS c-JUN or dominant–negative c-JUN reduce DNA synthesis by only 30–40% (Fig. 5B and data not shown). Currently, we are unable to assess the contribution of c-FOS in the early DNA synthesis phenotype, as the highly transient induction of c-FOS may have escaped detection in our assays.
At present it is unclear to what extent the 4- to 5-fold down-regulation of p21 in p300-depleted cells (Fig. 4C) contributed to the initial events that led to their forced entry into S phase. It is not surprising that p21 is down-regulated in these cells, as others have shown that p300 can increase p21 levels as a coactivater of Sp1, Sp3, and p53 as well as tissue-specific transcription factors (1, 2, 11). It is likely that the down-regulation of p21 observed in our study may have contributed to up-regulation of cyclin kinase activity and the onset of DNA synthesis seen in p300-depleted cells; however, the relative contributions of c-MYC up-regulation and p21 down-regulation to kinase activity have not been determined.
What is the mechanism by which c-MYC is up-regulated in serum-starved p300-depleted cells? It is conceivable that p300 negatively regulates the activity of one or more transcription factors that are critical for transcriptional activation of c-MYC. The negative regulation of transcription factor activity by p300/CBP has been reported previously. For example, Drosophila dCBP represses the activity of dTCF by acetylating dTCF, which presumably inhibits its association with armadillo, a β-catenin homolog (4). p300 acetylates HMGI(Y), causing destabilization of the enhanceosome and thereby negatively regulating IFN β gene transcription (3). It has been shown that TCF-4 is an upstream effector of c-MYC (20) and c-JUN (27). Our preliminary data show that a wild-type c-MYC promoter–reporter construct is up-regulated in serum-starved p300-depleted cells; however, a c-MYC promoter–reporter in which the two TCF-4 sites have been mutated was not up-regulated after p300 depletion (Fig. 6C). These results suggest that TCF-4 may be a target for negative regulation by p300 in serum-starved cells. However, recent reports have suggested that, in mammalian cells, β-catenin dependent transcription is increased by p300 (29, 30). It is conceivable that p300 may regulate the activity of TCF-4 positively and negatively, depending on the growth conditions of the cell (see below).
Studies have shown that p300 is phosphorylated in a cell cycle-dependent manner with no change in their levels of synthesis (31), possibly by cdk2 and other kinases yet to be identified (reviewed in ref. 1). Recent work has suggested that CBP is phosphorylated at the G1/S border, and that this phosphorylation increases the histone acetyltransferase activity of CBP (32). A key regulator of S phase genes, E2F, has been shown to be acetylated by p300, increasing its transcriptional activation activity (12). Thus, it is possible that properties and functions of p300 may be different in serum-starved and proliferating cells. We have preliminary evidence that depletion of p300 from serum-stimulated cells causes cells to become arrested in S phase, suggesting that p300 function may also be necessary for S phase exit. Thus depletion of p300 in growth-arrested cells may mimic the loss of G1 function provided by the underphosphorylated form of p300. Our findings may also have implications for several forms of cancers wherein p300 is mutated (reviewed in refs. 1 and 8). In these cancers, the mutant p300 might have lost its G1 function described here, thereby disregulating c-Myc and contributing to tumorigenesis. Clearly, additional experiments are needed to resolve the mechanism by which p300 controls c-MYC and c-JUN transcription in G0/G1 and changes in p300 activities throughout the cell cycle.
Acknowledgments
We are very grateful to H. Rajabi for his generous help with c-FOS analysis, L. Anderson for help in AS-1 and AS-2 vector construction, to S. Reierstad for excellent technical assistance, to M. Paniagua for help with FACS analysis, and to B. Vogelstein (Johns Hopkins University), D. Livingston (Dana–Farber), P. Farnham (University of Wisconsin), P. Nisen (Abbott Laboratory), and W. El-Diery (University of Pennsylvania) for plasmids and viruses. This work was supported by Grant CA 74403 from the National Institutes of Health. A.B. was supported by training Grants T32CA09560 and DAMD 17-94-J-4466.
Abbreviations
- CBP
cAMP-response element-binding protein (CREB)-binding protein
- pfu
plaque-forming unit
- AS
antisense
- Ad
adenovirus
- TCF
T cell factor
- Ad-β-gal
Ad-β-galactosidase
- CDK
cyclin-dependent kinase
Footnotes
This paper was submitted directly (Track II) to the PNAS office.
References
- 1.Goodman R H, Smolik S. Genes Dev. 2000;14:1553–1577. [PubMed] [Google Scholar]
- 2.Gu W, Roeder R G. Cell. 1997;90:230–236. doi: 10.1016/s0092-8674(00)80521-8. [DOI] [PubMed] [Google Scholar]
- 3.Munshi N, Merika M, Yie J, Senger K, Chen G, Thanos D. Cell. 1998;2:457–467. doi: 10.1016/s1097-2765(00)80145-8. [DOI] [PubMed] [Google Scholar]
- 4.Waltzer L, Bienz M. Nature (London) 1998;395:521–525. doi: 10.1038/26785. [DOI] [PubMed] [Google Scholar]
- 5.Yao T P, Oh S P, Fuchs M, Zhou N D, Ch'ng L E, Newsome D, Bronson R T, Li E, Livingston D M, Eckner R. Cell. 1998;93:361–372. doi: 10.1016/s0092-8674(00)81165-4. [DOI] [PubMed] [Google Scholar]
- 6.Petrij F, Giles R H, Dauwerse H G, Saris J J, Hennekam R C, Masuno M, Tommerup N, van Ommen G J, Goodman R H, Peters D J M, Breuning M H. Nature (London) 1995;376:348–351. doi: 10.1038/376348a0. [DOI] [PubMed] [Google Scholar]
- 7.Kung K L, Bronson R T, Ch'ng L, Sieff C A, Livingston D M, Yao T. Genes Dev. 2000;14:272–277. [PMC free article] [PubMed] [Google Scholar]
- 8.Giles R H, Peters D J, Breuning M H. Trends Genet. 1998;14:178–183. doi: 10.1016/s0168-9525(98)01438-3. [DOI] [PubMed] [Google Scholar]
- 9.Stein R W, Corrigan M, Yaciuk P, Whelan J, Moran E. J Virol. 1990;64:4421–4427. doi: 10.1128/jvi.64.9.4421-4427.1990. [DOI] [PMC free article] [PubMed] [Google Scholar]
- 10.Liu Y, Kitsis R N. J Cell Biol. 1996;133:325–334. doi: 10.1083/jcb.133.2.325. [DOI] [PMC free article] [PubMed] [Google Scholar]
- 11.Billion N, van Grunsven L A, Rudkin B B. Oncogene. 1996;13:2047–2054. [PubMed] [Google Scholar]
- 12.Martinez-Balbas M A, Bauer U M, Nielsen S J, Brehm A, Kouzarides T. EMBO J. 2000;19:662–671. doi: 10.1093/emboj/19.4.662. [DOI] [PMC free article] [PubMed] [Google Scholar]
- 13.Soule H D, Maloney T N, Wolman S R, Peterson W D J, Brenz R, McGrath C M, Russo J, Pauley R J, Jones R F, Brooks S C. Cancer Res. 1990;50:6075–6086. [PubMed] [Google Scholar]
- 14.Buchmann A M, Swaminathan S, Thimmapaya B. Mol Cell Biol. 1998;18:4565–4576. doi: 10.1128/mcb.18.8.4565. [DOI] [PMC free article] [PubMed] [Google Scholar]
- 15.Yang D, Louden C, Reinhold D S, Kohler S K, Maher V M, McCormick J. Proc Natl Acad Sci USA. 1992;89:2237–2241. doi: 10.1073/pnas.89.6.2237. [DOI] [PMC free article] [PubMed] [Google Scholar]
- 16.Swaminathan S, Thimmapaya B. J Mol Biol. 1996;258:736–746. doi: 10.1006/jmbi.1996.0283. [DOI] [PubMed] [Google Scholar]
- 17.Mitchell K O, El-Deiry W S. Cell Growth Differ. 1999;10:223–230. [PubMed] [Google Scholar]
- 18.Chen J, Willingham W, Margraf L R, Schreiber-Agus N, DePinho R A, Nisen P D. Nat Med. 1995;1:638–643. doi: 10.1038/nm0795-638. [DOI] [PubMed] [Google Scholar]
- 19.Resnitzky D, Gossen M, Bujard H, Reed S I. Mol Cell Biol. 1994;14:1669–1679. doi: 10.1128/mcb.14.3.1669. [DOI] [PMC free article] [PubMed] [Google Scholar]
- 20.He T C, Sparks A B, Rago C, Hermeking H, Zavel L, daCosta L T, Morin P J, Vogelstein B, Kinzler K W. Science. 1998;281:1509–1512. doi: 10.1126/science.281.5382.1509. [DOI] [PubMed] [Google Scholar]
- 21.Gavrieli Y, Sherman Y, Ben-Sasson S A. J Cell Biol. 1992;119:493–501. doi: 10.1083/jcb.119.3.493. [DOI] [PMC free article] [PubMed] [Google Scholar]
- 22.Jansen-Durr P, Meichle A, Steiner P, Pagano M, Finke K, Botz J, Wessbecher J, Draetta G, Eilers M. Proc Natl Acad Sci USA. 1993;90:3685–3689. doi: 10.1073/pnas.90.8.3685. [DOI] [PMC free article] [PubMed] [Google Scholar]
- 23.Coleman P F, Suttle P, Stark G R. J Biol Chem. 1977;252:6379–6385. [PubMed] [Google Scholar]
- 24.Bush A, Mateyak M, Dugan K, Obaya A, Adachi S, Sedivy J, Cole M. Genes Dev. 1998;12:3797–3802. doi: 10.1101/gad.12.24.3797. [DOI] [PMC free article] [PubMed] [Google Scholar]
- 25.Ayer D E, Kretzner L, Eisenman R N. Cell. 1995;72:211–222. doi: 10.1016/0092-8674(93)90661-9. [DOI] [PubMed] [Google Scholar]
- 26.Brown P H, Chen T K, Birrer M J. Oncogene. 1994;9:791–799. [PubMed] [Google Scholar]
- 27.Mann B, Gelos M, Siedow A, Hanski M L, Gratchev A, Ilyas M, Bodmer W F, Moyer M P, Riecken E O, Buhr H J, Hanski C. Proc Natl Acad Sci USA. 1999;96:1603–1608. doi: 10.1073/pnas.96.4.1603. [DOI] [PMC free article] [PubMed] [Google Scholar]
- 28.Steiner P, Philipp A, Lucas J, Kent D G, Pagano M, Mittnacht S, Bartek J, Eilers M. EMBO J. 1995;14:4814–4826. doi: 10.1002/j.1460-2075.1995.tb00163.x. [DOI] [PMC free article] [PubMed] [Google Scholar]
- 29.Takemaru K, Moon R T. J Cell Biol. 2000;149:249–254. doi: 10.1083/jcb.149.2.249. [DOI] [PMC free article] [PubMed] [Google Scholar]
- 30.Hecht A, Vleminckx K, Stemmler M P, van Roy F, Kemler R. EMBO J. 2000;19:1839–1850. doi: 10.1093/emboj/19.8.1839. [DOI] [PMC free article] [PubMed] [Google Scholar]
- 31.Yaciuk P, Moran E. Mol Cell Biol. 1991;11:5389–5397. doi: 10.1128/mcb.11.11.5389. [DOI] [PMC free article] [PubMed] [Google Scholar]
- 32.Ait-Si-Ali S, Ramirez R, Barre F X, Skhissi F, Magnaghi-Jaulin L, Girault J A, Robin J A, Knibiehler M, Pritchard L L, Ducommun B, et al. Nature (London) 1998;396:184–186. doi: 10.1038/24190. [DOI] [PubMed] [Google Scholar]


