

Abstract
Toll‐like receptor 9 (TLR9) activates the innate immune response when exposed to non‐methylated CpG‐DNA. TLR9 was recently shown to be expressed by cancer cells which have been previously characterized by global hypomethylation. We set out to examine the expression and molecular activity of TLR9 in breast and ovarian cancer cells. Firstly, we confirmed higher levels of hypomethylated DNA in the serum of patients with metastatic breast cancer (n = 18) versus age‐matched tumor‐free women (n = 18). In breast cancer cell lines and tissues, TLR9 mRNA expression was associated with estrogen‐receptor (ER) status (n = 124, P = 0.005). Expression also correlated with increasing tumor grade in both breast (P = 0.03) and ovarian cancer specimens (n = 138, P = 0.04). Immunohistochemical analysis of formalin‐fixed paraffin‐embedded (FFPE) breast cancer tissues revealed higher TLR9 protein expression in hormone‐receptor (HR)‐negative specimens (n = 116, P < 0.001). Using an in vitro scratch assay, we observed that cell lines transfected to overexpress TLR9 demonstrated increased cellular migration when stimulated with CpG‐DNA. When assessing the molecular activity of TLR9 in breast cancer, we found a strong positive correlation of nuclear factor‐kappa B (NF‐κB) activity with TLR9 mRNA expression (correlation coefficient r = 0.7, P < 0.001). Finally, immunofluorescence analysis of BT‐20 and Hs578T breast cancer cell lines showed partial colocalizations of CpG‐DNA with TLR9, which diminished when the cells were exposed to methylated CpG‐DNA (mCpG‐DNA) or control GpC‐DNA. In summary we demonstrate that TLR9 expression is associated with poor differentiation in breast and ovarian cancer specimens, and that TLR9 overexpression and stimulation with hypomethylated DNA augments the migratory capacity of cancer cell lines.
(Cancer Sci 2010; 101: 1059–1066)
The innate immune system senses the invasion of pathogenic microorganisms through the Toll‐like receptors (TLRs), a family of evolutionarily conserved germ‐line‐encoded proteins which recognize conserved microbial compounds known as pathogen‐associated molecular patterns (PAMPs). TLR9 binds unmethylated CpG‐DNA motifs present in microbial nucleic acids,( 1 ) and initiates a signaling cascade involving nuclear factor‐kappa B (NF‐κB) that culminates in the up‐regulation of pro‐inflammatory pathways.( 2 )
Like pathogenic microorganisms, tumor cells are also rich in their unmethylated CpG‐DNA content. Recently, we showed that circulating tumor‐specific serum DNA in breast cancer is a marker for poor prognosis,( 3 , 4 ) and that hypomethylation is an early event in breast cancer associated with poor prognosis.( 5 , 6 ) Additionally, it has also been shown that stimulation of TLR9‐expressing breast cancer cells with agonistic unmethylated CpG‐oligonucleotides promotes cellular invasion by increasing matrix metalloproteinase activity.( 7 , 8 )
In this study we examined the significance of TLR9 expression in breast and ovarian cancer, and analyzed the molecular activity of TLR9.
Material and Methods
Patients and samples. The following samples were analyzed with approval of the local ethics committee. (Patients were treated at the Department of Obstetrics and Gynecology of the Innsbruck Medical University, Austria, between 1984 and 2004).
-
1
Serum samples of 18 patients with metastatic breast cancer (aged 30.3–83.9 years; median age at serum draw, 61.1 years) and 18 healthy control patients (aged 32.2–84.3 years; median age at serum draw, 60.5 years).
-
2
2 Frozen breast tissue samples from 124 patients with breast cancer (aged 35.5–89.6 years; median age at diagnosis, 61.7 years) and 10 patients with non‐neoplastic breast diseases (aged 29.2–66.9 years; median age at diagnosis, 40.1 years). Breast cancer specimens were obtained immediately after resection of the breast or lumpectomy, processed by pathology and a part of the tissue was pulverized under cooling with liquid nitrogen and stored at −70°C. All samples were collected during surgery in compliance with and approved by the Institutional Review Board. Clinical, pathological, and follow‐up data were stored in a database in accordance with hospital privacy rules. Estrogen‐receptor (ER) and progesterone‐receptor (PR) status were identified immunohistochemically. Other clinicopathologic features are shown in Table 1(a).
-
3
Frozen ovarian tissue samples from 138 patients with ovarian cancer (aged 24.0–88.3 years; median age at diagnosis, 63.3 years) and 30 patients with benign diseases (aged 38.2–85.8 years; median age at diagnosis, 55.7 years). Clinicopathologic features are shown in Table 1(b).
-
4
Formalin‐fixed paraffin‐embedded (FFPE) tissue samples from 116 postmenopausal women with breast cancer. Samples were obtained from the Departments of Pathology and Gynecology, General Hospital and Paracelsus University Salzburg, Austria. All samples were collected at diagnosis prior to chemotherapy in compliance with and approved by the Institutional Review Boards. Patients were aged 46.8–91.4 years (median age at diagnosis, 66.2 years).
Table 1.
Association/correlation of TLR9 mRNA expression with clinicopathological features. (a) 124 primary breast cancer patients and (b) 138 primary ovarian cancer patients
| TLR9 mRNA expression logarithmic values (norm. to TBP) | |||
|---|---|---|---|
| n | Mean (±SD) | P‐values | |
| (a) | |||
| Size | |||
| T1 | 36 | 2.10 (0.61) | n.s.† |
| T2/3/4 | 88 | 2.22 (0.94) | |
| LN | |||
| Negative | 47 | 2.08 (0.71) | n.s.† |
| Positive | 71 | 2.28 (0.96) | |
| n.a. | 6 | ||
| Tumor grade | |||
| I | 34 | 1.98 (0.70) | 0.03‡ |
| II | 64 | 2.18 (0.90) | |
| III | 24 | 2.44 (0.92) | |
| n.a. | 2 | ||
| MP | |||
| Premenopausal | 23 | 2.03 (0.69) | n.s.† |
| Postmenopausal | 101 | 2.22 (0.89) | |
| ER | |||
| Neg | 44 | 2.49 (0.88) | 0.005† |
| Pos | 79 | 2.02 (0.80) | |
| n.a. | 1 | ||
| PR | |||
| Neg | 50 | 2.42 (0.87) | 0.012† |
| Pos | 74 | 2.02 (0.81) | |
| HR | |||
| Neg | 41 | 2.51 (0.90) | 0.005† |
| Pos | 83 | 2.02 (0.79) | |
| HER2 | |||
| Score 0/+ | 62 | 2.18 (0.80) | n.s.† |
| Score ++/+++ | 42 | 2.18 (0.92) | |
| n.a. | 22 | ||
| (b) | |||
| Age | |||
| <63 years | 69 | 1.83 (0.82) | n.s.† |
| >63 years | 69 | 1.84 (0.96) | |
| Tumor stage | |||
| I/II | 41 | 1.85 (1.08) | n.s.† |
| III/IV | 97 | 1.84 (0.80) | |
| Tumor grade | |||
| I | 5 | 1.52 (0.52) | 0.04‡ |
| II | 75 | 1.75 (0.89) | |
| III | 56 | 1.99 (0.91) | |
| n.a | 2 | ||
| Histologic type | |||
| Serous | 63 | 2.09 (0.73) | 0.002† |
| Mucinous | 43 | 1.46 (0.90) | |
| Endometroid | 21 | 1.73 (1.07) | |
| Clear cell | 11 | 2.11 (0.90) | |
†Student’s t‐test or anova respectively. ‡Spearman rank correlation. ER, estrogen receptor status; HER2, human epidermal growth factor receptor 2 status; HR, hormone receptor status; LN, lymph note status; MP, menopausal status; n.a., not available; n.s., not significant; PR, progesterone receptor status; TLR9, toll‐like receptor 9. Bold values have a significance level of P < 0.05.
Cell culture. Human breast cancer cell lines BT‐20, ZR‐75‐1, MCF7, MDA‐MB‐231, T‐47D, and SK‐BR‐3 were obtained from the American Type Culture Collection (ATCC; Manassas, VA, USA). Cells were cultured according to the recommendations of the ATCC. Origin and culture conditions of human breast cancer cell lines HBL‐100 and Hs578T have been described elsewhere.( 9 )
DNA methylation analysis of repetitive elements in serum samples. DNA from serum samples was isolated and bisulfite modified as recently described.( 4 ) DNA hypomethylation analysis was performed by means of MethyLight PCR as described previously.( 10 ) A value called PUMR (percentage of unmethylated reference) was calculated analogously to PMR values. For methylation analysis, ACTB was used as the reference gene.( 4 ) Primers and probes for unmethylated LINE‐1: forward: 5′‐AACCTCATTACCACCTTACAATTTAATCT‐3′, reverse: 5′‐GATTGGTTTAAGAAATGGTGTATTATGAGA‐3′; TQM probe: 5′‐FAM‐CAAAATTCCATAAACATAAAACCCTCCAAACCAA‐3′ BHQ1. The reaction was based on a LINE‐1 sequence (GenBank accession number AF149422).
RNA isolation and mRNA expression analysis. Total cellular RNA extraction and reverse transcription of RNA were performed as previously described.( 9 , 11 ) Primers and probe for RT‐PCR analysis for TLR9 were purchased from Applied Biosystems (Hs00152973‐m1; Foster City, CA, USA). Primers for TATA‐box binding protein (TBP) which was used as endogenous control were recently described.( 12 ) Real‐time PCR was performed using an ABI Prism 7900HT Detection System (Applied Biosystems, Foster City, CA, USA). The standard curves were generated using serially diluted solutions of cDNA derived from breast or ovarian cancer cell lines.
TLR9 immunohistochemistry. Immunohistochemical staining was performed on FFPE tissues on a BondMax (Menarini, Florence, Italy) immunostainer. Two‐μm‐thick sections were deparaffinized with xylene, hydrated in graded alcohols, followed by pre‐treatment with the Bond Epitope Retrieval Solution 2. A primary TLR9 goat polyclonal antibody (sc13218; Santa Cruz Biotechnology, Santa Cruz, CA, USA) was used in combination with a rabbit anti‐goat biotinylated immunoglobulin (E0466; Dako, Glostrup, Denmark) and visualized via a standard peroxidase‐based detection system (Bond Intense R Detection; Menarini). Slides were counterstained with hematoxylin.
Expression constructs. Construction of pLIB‐MCS2‐iresNeo plasmid has been described previously.( 13 ) To generate pLIB‐TLR9‐iresNeo, the TLR9 coding sequence was excised from pcDNA3‐TLR9‐YFP (plasmid 13642, Addgene, Cambridge, MA, USA) and cloned into the BamH1‐Sal1 sites of the pLIB‐MCS2‐iresNeo plasmid. The pLIB‐TLR9‐ECFP‐iresNeo vector was constructed by amplifying the ECFP coding sequence from pLIB‐ECFP‐FKHRL1‐iresPuro( 14 ) using the following primers: ECFP forward: 5′‐TATAGCGGCCGCAATGGTGAGCAAGGGCGAG‐3′, ECFP reverse: 5′‐TATAGCGGCCGCTAGGATCCGTCCATGCCGAG‐3′. The PCR product was digested with Not1 and cloned into the Not1‐site of pLIB‐TLR9‐iresNeo. Production of retroviruses and retroviral infection was performed as previously described.( 13 )
In vitro scratch and proliferation assay. The in vitro scratch assay was performed as recently described.( 15 ) Briefly, 90% confluent BT‐20 breast cancer cells, TLR9‐overexpressing BT‐20 cells, and mock‐transfected BT‐20 cells were scratched by a pipette tip and further cultivated for 24 h in fresh medium containing CpG‐DNA, GpC‐DNA, or without addition of DNA. The same fields were photographed immediately (0 h), and 24, 48, and 55 h later using a Kappa PS30 camera (Kappa opto‐electronics, Gleichen, Germany). Images were generated using the Kappa ImageBase Control 2.7.2 software (Kappa opto‐electronics) and distances between each side of the scratch were measured at certain intervals using a freeware (http://rsb.info.nih.gov/ij/). Cell migration images were taken at ×100 magnifications. Results were plotted as percentage of wound closure relative to hour 0. Cells were counted 24, 48, 72, and 79 h after the stimulation with CpG‐DNA, GpC‐DNA, or without addition of DNA. The experiments were repeated six times.
Detection of active NF‐κB. The level of active NF‐κB was determined by electrophoretic mobility‐shift assay (EMSA) of protein extracts of breast cancer specimens frozen shortly after surgical removal, prepared from whole tissues as described.( 16 )
TLR9 western blot analysis. Cells were harvested, washed with PBS, and lysed using CelLytic‐M Mammalian cell Lysis/Extraction Reagent (Sigma‐Aldrich, St. Louis, MO, USA) complemented with Halt Phosphatase and Protease Inhibitor Cocktail (Pierce, Rockford, IL, USA). One‐hundred‐μg protein per lane was then resolved using a 4% to 20% Tris‐Hepes gel (NuSep, Sydney, Australia) and transferred onto a nitrocellulose membrane (Whatman, Maidstone, UK). The membrane was blocked for 1 h using Odyssey Block buffer (LI‐COR Biosciences, Lincoln, NE, USA) and incubated at 4°C overnight with the primary antibody followed by incubation for 45 min at room temperature with fluorescence‐labeled secondary antibodies. The membrane was scanned and quantified using the Odyssey IR Imaging System (LI‐COR Biosciences). The following antibodies were used: TLR9 (1:250, sc13218; Santa Cruz Biotechnology), anti‐glyceraldehyde‐3‐phosphate dehydrogenase (GAPDH) (1:10000, BM‐MA0026; Biomol, Hamburg, Germany), Alexa Fluor 680 donkey antigoat IgG (H+L) (1:10000, A‐21084; Invitrogen, Molecular Probes, San Diego, CA, USA), IRDye 800CW donkey antimouse IgG (H+L) (1:10000, 926‐32212; LI‐COR Biosciences).
TLR9 stimulation experiments. We treated BT‐20 and Hs578T breast cancer cells with different oligonucleotides: CpG‐DNA (ODN2006; InvivoGen, San Diego, CA, USA), GpC‐DNA (ODN2006 gc; InvivoGen), and mCpG‐DNA (ODN2006 meth).
ODN2006: 5′‐TCGTCGTTTTGTCGTTTTGTCGTT‐3′, ODN2006 control: 5′‐TGCTGCTTTTGTGCTTTTGTGCTT‐3′. The sequence of methylated‐ODN2006 is identical to ODN2006, but the cytosines at positions 2, 5, 13, and 21 are methylated. The oligonucleotide for the methylated‐ODN2006 was synthesized by Microsynth (Balgach, Switzerland) in a phosphothioate‐protected form. The human breast cancer cell lines were stimulated using a 200‐nm final concentration of the oligonucleotides and DOTAP liposomal transfection reagent (Roche Diagnostics, Mannheim, Germany). For the handling of the transfection agent and the ODNs, manufacturers’ working instructions were followed.
Immunofluorescence analysis. The following reagents were used: TLR9 polyclonal antibody (sc‐13218; Santa Cruz Biotechnology), EEA1 monoclonal antibody (612007, FITC conjugated; BD Transduction Laboratories, Franklin Lakes, NJ, USA), rabbit antigoat IgG antibody Alexa Fluor 568 (A11079), endoplasmatic reticulum tracker blue‐white DPX dye (E12353), and DAPI (D1306) (Molecular Probes, Eugene, OR, USA). Cells were fixed with 4% paraformaldehyde, permeabilized with 0.1% Triton X‐100, incubated with the primary antibody, washed and detected with a fluorescence‐labeled secondary antibody.
Analysis was done with an Axiovert200 M microscope (Zeiss, Oberkochen, Germany) using AxioVision Software (Zeiss). Live cell fluorescence microscopy was performed as recently described.( 14 )
Statistics. Descriptive analysis of obtained data was performed and the mean (+/SD) of log‐transformed TLR9 values is given. For comparisons of TLR9 mRNA expression values between groups two‐sided t‐tests – or in case of comparisons between more than two groups, anova – were applied on the log‐transformed expression values of TLR9 mRNA expression. To assess the association between TLR9 protein expression and clinicopathological features we scored the TLR9 values into four groups and used the Mantel–Haenszel statistic. Spearman correlation analysis was used to specify relationships between TLR9 mRNA expression and activity of NF‐κB or tumor grade respectively. For the analysis of LINE‐1 DNA hypomethylation in serum samples the Mann–Whitney U‐test was used. A P‐value <0.05 was considered as statistically significant. All calculations were performed using SPSS software version 10.0 (Chicago, IL, USA).
Results
Hypomethylation analysis of circulating DNA in sera of breast cancer patients and healthy control patients. Since it is known that TLR9 binds unmethylated CpG‐DNA, we analyzed levels of hypomethylated DNA in the serum of breast cancer patients. The analysis of DNA hypomethylation at LINE‐1 repetitive elements in sera from patients with metastatic breast cancer and age‐matched tumor‐free women showed significantly more hypomethylation in sera of breast cancer patients (P = 0.014) (Fig. 1).
Figure 1.
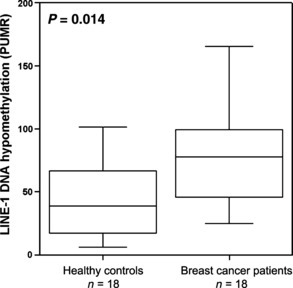
LINE‐1 DNA hypomethylation analysis of circulating DNA in sera of 18 breast cancer patients and 18 healthy control patients.
TLR9 expression in breast and ovarian cancer. TLR9 mRNA expression levels were analyzed in three ER‐positive and five ER‐negative cell lines. Expression levels were normalized using TBP mRNA expression. Expression was higher in ER‐negative cell lines (P = 0.021, Fig. 2a). This result was especially driven by the ER‐negative BT‐20 cell line. We then analyzed the mRNA expression levels of TLR9 in non‐neoplastic breast tissues (n = 10) and breast cancer specimens (n = 124) and found that TLR9 mRNA expression was significantly associated with ER status (P = 0.005, Table 1a) and with PR status (P = 0.012, Table 1a) in breast cancer tissues. The analysis of TLR9 mRNA expression in non‐neoplastic tissues revealed similar expression levels as identified in ER‐positive specimens (P = 0.01; Fig. 2b). We observed an increase in TLR9 mRNA expression with increasing tumor grade (correlation coefficient r = 0.2, P = 0.03; Fig. 2c , Table 1a). This was confirmed by a significantly higher TLR9 mRNA expression in grade III tumor samples in comparison to grade I tumors (P = 0.046). In order to determine whether TLR9 expression is unique to breast cancer or is a feature in common with other solid tumors, we analyzed ovarian cancer samples (n = 138) and observed an overall statistically significant TLR9 mRNA expression increase from mucinous to endometrioid to serous and finally to clear cell ovarian cancer (P = 0.002; Table 1b). When non‐neoplastic tissues were included, an overall statistically significant difference in TLR9 mRNA expression between histological types remained (P = 0.001). Post‐hoc analysis (least significant difference [LSD] approach) showed a difference in non‐neoplastic tissues in comparison to serous ovarian cancers (P = 0.02), serous to mucinous ovarian cancer (P < 0.001), and mucinous to clear cell ovarian cancer (P = 0.02). Again we found a positive association between tumor grade and TLR9 mRNA expression in ovarian cancer specimens (correlation coefficient r = 0.2, P = 0.04, Fig. 2d , Table 1b).
Figure 2.
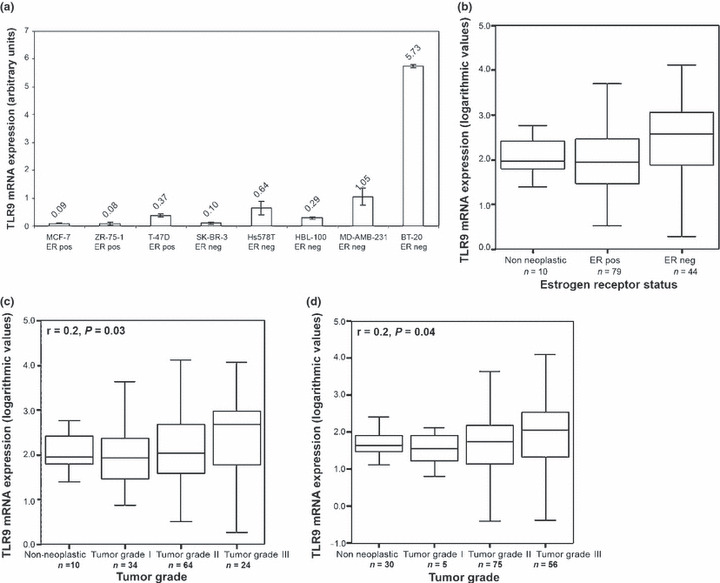
Toll‐like receptor 9 (TLR9) mRNA expression in breast and ovarian cancer. (a) analysis in eight breast cancer cell lines; (b) analysis in 10 non‐neoplastic breast tissues and 124 breast cancer samples in association with estrogen receptor (ER) status. (c) Correlation of TLR9 expression with tumor grade in 10 non‐neoplastic breast tissues and 124 breast cancer samples (d) and in 138 ovarian tumor samples and 30 non‐neoplastic ovarian tissues. Tumor grade information was not available for two patients.
Immunohistochemical analysis of FFPE breast cancer tissues (n = 116) revealed more intense TLR9 protein expression in HR‐negative (both ER‐ and PR‐negative) as compared with HR‐positive breast cancer specimens (both ER‐ and PR‐positive) (P < 0.001; Fig. 3a).
Figure 3.
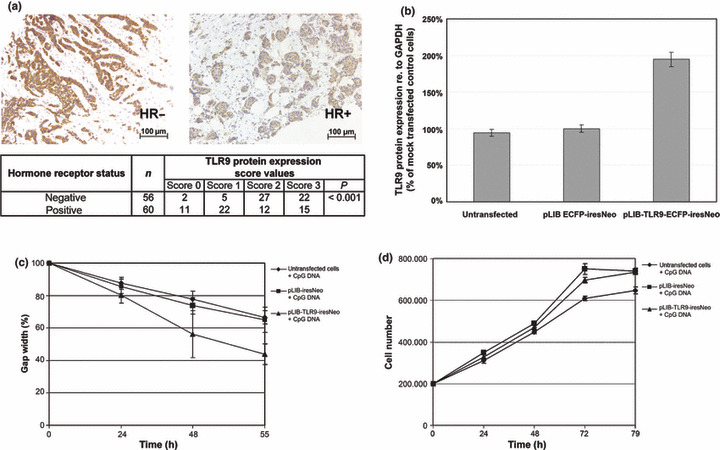
Toll‐like receptor 9 (TLR9) expression in breast cancer. (a) Results of immunohistochemical TLR9 staining performed in 116 formalin‐fixed paraffin‐embedded (FFPE) tissues. Association of TLR9 protein expression with hormone receptor (HR)‐status is shown. (b) TLR9 protein expression in untransfected cells, TLR9‐overexpressing cells (pLIB‐TLR9‐iresNeo), and mock‐transfected cells (pLIB‐iresNeo). (c) In vitro scratch assay. Untransfected cells, TLR9‐overexpressing cells, and mock‐transfected cells were treated with CpG‐DNA, GpC‐DNA, or were left untreated. The cell monolayer was then wounded. The same fields were photographed immediately (0 h), and 24, 48, and 55 h later. Results were plotted as percentage of wound closure relative to hour 0. (d) Proliferation measurement of untransfected cells, TLR9‐overexpressing cells, and mock‐transfected cells. Results of six experiments are shown.
Cell migration analysis in TLR9‐overexpressing human breast cancer cells. It has been previously shown that the TLR9 agonistic CpG‐DNA oligos induce invasion in TLR9‐expressing cancer cells.( 7 ) We performed an in vitro scratch assay to measure the cell migration of BT‐20 untransfected cells, TLR9‐overexpressing BT‐20 cells (transfection with pLIB‐TLR9‐ECFP‐iresNeo vector), and BT‐20 control cells (transfection with pLIB‐ ECFP‐iresNeo vector). In comparison to control cells, a doubled TLR9 overexpression was revealed at the protein level (Fig. 3b). We identified an increased invasion in TLR9‐overexpressing BT‐20 cells in comparison to mock‐transfected cells or untransfected cells respectively after stimulation with CpG‐DNA (Fig. 3c). The increased invasion was not due to an effect on proliferation, because the CpG‐DNA used had no effect on cell proliferation during an incubation of 55 h after treatment with CpG DNA or GpC DNA respectively (Fig. 3d).
Investigation of the molecular activity of TLR9 in breast cancer. Since it is known that TLR9 triggers a signaling cascade involving activation of NF‐κB, which subsequently binds to and controls the expression of specific genes, we analyzed NF‐κB activity in primary breast cancer tissues from 23 patients (seven ER‐negative and 16 ER‐positive tumor specimens) by EMSA of p50. We observed a strong positive correlation between TLR9 mRNA expression and DNA binding of p50 (correlation coefficient r = 0.7, P < 0.001; Fig. 4a). In Figure 4(b) an exemplary picture of the EMSA analysis is shown.
Figure 4.
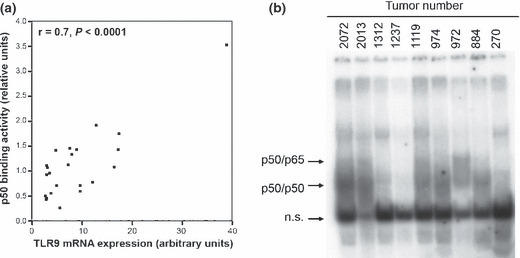
Toll‐like receptor 9 (TLR9) and nuclear factor‐kappa B (NF‐κB). (a) DNA binding activity of NF‐κB, assessed by p50 electrophoretic mobility‐shift assay (EMSA) and TLR9 mRNA expression in 23 tumor specimens. (b) Exemplary EMSA picture of nine tumor specimens. Arrows indicate the position of p50/ p65, or p50/ p50 complexes respectively.
To determine the subcellular localization of TLR9 in human breast cancer cells, BT‐20 cells expressing eCFP‐tagged TLR9 were stained with an endoplasmatic reticulum tracker and analyzed via immunofluorescence microscopy. Colocalization of fluorescent signals showed that TLR9 is expressed in the endoplasmatic reticulum in human breast cancer cells (Fig. 5a).
Figure 5.
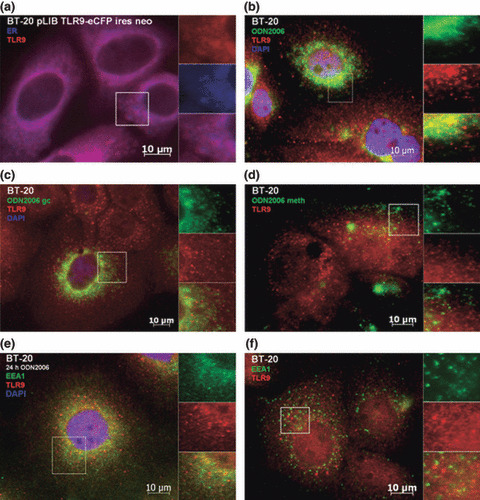
Colocalization analysis in BT‐20 human breast cancer cells. (a) Unstimulated cells expressing eCFP‐tagged TLR9 were stained with endoplasmatic reticulum tracker dye (blue, blue‐white tracker). Untransfected cells were stimulated with (b) CpG‐DNA, (c) GpC‐DNA, or (d) mCpG‐DNA. Cells were stained with (b–d) anti‐TLR9 (red, Alexa 568) and (b,c) DAPI nucleic‐acid stain. (e) Stimulated, untransfected cells were stained with anti‐TLR9 (red, Alexa 568), DAPI nucleic‐acid stain, and anti‐EEA1 an early endosome marker (green, FITC). (f) Unstimulated, untransfected cells were stained with anti‐TLR9 (red, Alexa 568) and anti‐EEA1 an early endosome marker (green, FITC).
To visualize the entrance of CpG‐DNA in breast cancer cells and the binding to TLR9, we performed immunofluorescence analysis. In untransfected BT‐20 cells, TLR9 was recruited to CpG‐DNA within 90 min after incubation, and followed CpG‐DNA to the intracellular compartments as expected (Fig. 5b). When these cells were incubated with fluorescence‐labeled GpC‐DNA (Fig. 5c) or mCpG‐DNA (Fig. 5d), translocation of TLR9 was greatly diminished. We then stained BT‐20 cells for the early endosome marker early endosome antigen 1 (EEA1). In cells which were stimulated with CpG‐DNA for 24 h, colocalization of TLR9 and EEA1 was observed (Fig. 5e) This was in contrast to unstimulated cells which failed to show colocalization (Fig. 5f). This observation is concordant with those previously seen in immune cells, whereby TLR9 colocalizes from the endoplasmatic reticulum towards non‐methylated CpG‐DNA that has been engulfed into an endosomal compartment.( 15 ) The immunofluorescence experiments were repeated with similar results using Hs578T cells, a second human breast cancer cell line (Fig. 6).
Figure 6.
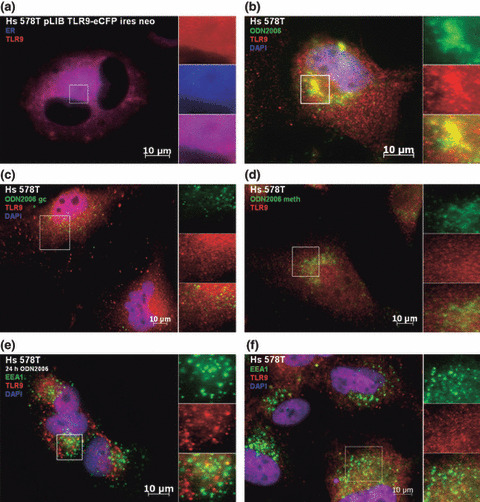
Colocalization analysis in Hs578T human breast cancer cells. (a) Unstimulated cells expressing eCFP tagged TLR9 were stained with endoplasmatic reticulum tracker dye (blue, blue‐white tracker). Untransfected cells were stimulated with (b) CpG‐DNA, (c) GpC‐DNA, or (d) mCpG‐DNA. Cells were stained with (b–d) anti‐TLR9 (red, Alexa 568) and (b,c) DAPI nucleic‐acid stain. (e) Stimulated, untransfected cells were stained with anti‐TLR9 (red, Alexa 568), DAPI nucleic‐acid stain, and anti‐EEA1 an early endosome marker (green, FITC). (f) Unstimulated, untransfected cells were stained with anti‐TLR9 (red, Alexa 568) and anti‐EEA1 an early endosome marker (green, FITC).
Discussion
Recently it was suggested that the release of CpG‐rich DNA from mammalian DNA may contribute to the pathogenesis of autoimmune diseases such as systemic lupus erythematosus and psoriasis in which activation of TLR9 in dendritic cells by self DNA has been implicated in disease pathogenesis.( 17 )
We wanted to examine the potential effects of TLR9 activation in cancer cells which harbor a lower 5‐methylcytosine content than normal cells mainly due to an increased hypomethylation at repetitive elements.( 10 , 18 , 19 , 20 ) It has been shown that TLR9–CpG–DNA interaction occurs at an acidic pH.( 21 ) Fast‐growing tumor cells undergo necrosis caused by insufficient neoangiogenesis and release free tumor DNA. We hypothesized that, supported by the surrounding low pH conditions, hypomethylated tumor DNA is released from necrotic cells, enters surrounding viable tumor cells where it binds to TLR9 and initiates a signaling cascade that promotes tumorigenicity. Serum is a highly representative source of this kind of DNA: extracellular DNA is transported to lymph‐vessels, which drain into blood vessels. We found significantly more hypomethylated DNA in the sera of metastatic breast cancer patients in comparison to healthy controls measured by means of LINE‐1 DNA hypomethylation analysis.
To investigate the receptor for hypomethylated DNA in cancer cells we examined TLR9 expression and showed in this report that (i) TLR9 is expressed in breast and ovarian cancer; (ii) TLR9 mRNA and protein expression is higher in HR‐negative compared with HR‐positive breast cancers in two independent sets; and (iii) TLR9 expression increases with rising grade in both breast and ovarian cancer. These data support the view that TLR9 expression is a feature of poorly differentiated cancer cells.
We noted that TLR9 expression was associated with NF‐κB activity, as demonstrated by increased binding of p50. As part of the innate immune system, unmethylated CpG‐DNA motifs are detected by TLR9( 1 , 22 ) and induce the recruitment of NF‐κB. Initiation of this signaling cascade promotes expression of pro‐inflammatory genes and activation of immune cells.( 2 ) We identified a significant correlation between TLR9 mRNA expression and the activation of NF‐κB in human breast cancer cell lines. Recently, it was shown that stimulation of TLR9‐expressing breast cancer cells with CpG‐oligonucleotides dramatically increases their in vitro invasion independently of cell proliferation by down‐regulating expression of tissue inhibitor of metalloproteinase‐3 and therefore increasing the levels of active matrix metalloproteinase.( 7 ) In the current study we could also observe a significantly augmented migration after in vitro stimulation experiments with CpG‐DNA in TLR9‐overexpressing BT‐20 breast cancer cells in comparison to untransfected or mock‐transfected cells, and that this too was independent of cell proliferation. In lung cancer it was shown that CpG‐DNA could effectively induce the proliferation and interleukin‐10 (IL‐10) secretion in vitro and could elevate the tumor progression of human lung cancer cells in vivo.( 23 ) Similar findings were described in prostate cancer.( 24 ) In further study it was shown that CpG‐DNA can also alter lymphocyte and dendritic cell trafficking in humans.( 25 )
To investigate whether TLR9 translocates to sub‐cellular compartments to interact and bind with CpG‐DNA in a pattern similar to that observed in stimulated dendritic cells,( 22 ) we incubated BT‐20 and Hs578T cells with fluorescence‐labeled CpG DNA, and monitored the movement of TLR9 by direct immunofluorescence. We found partial colocalizations between TLR9 and unmethylated CpG‐DNA, but no or only weak colocalizations with GpC‐DNA and mCpG‐DNA. Recently, it was shown that CpG‐DNA up‐regulates the expression of cyclooxygenase‐2 via activation of NF‐κB in prostate cancer cells, which may be implicated in tumor invasion and metastasis.( 26 )
Taken together these findings suggest a potential role of TLR9 expression as a marker of poorly differentiated tumors, but importantly also suggest that autologous binding of hypomethylated tumor DNA at TLR9 in cancer cells has the potential to increase tumorgenicity through the promotion of migratory capacity. Whilst our hypothesis warrants further investigation, it potentially implies a need to exercise caution when employing immunomodulatory therapeutics targeting TLR9 in cancer patients. Increasing our current knowledge of TLR9‐mediated tumor cell activation is vital if we are to fully optimize the efficiency of cancer treatment regimes.
Disclosure Statement
The authors have no conflict of interest.
Acknowledgments
We thank I. Gaugg, M. Fleischer, A. Wiedemair, M. Rupp, and J. Hagenbuchner for their excellent technical assistance and C. Marth for providing clinical samples and patients’ data. We thank Professor Doug Golenbock for making Plasmid 13642: pcDNA3‐TLR9‐YFP available through Addgene. H.F. was supported by a FWF‐project grant (V33‐B13) and by the MFI Medical‐University‐Innsbruck‐Fund (4317). M.W. was the recipient of a FWF‐project grant (L69‐B05). Part of this work has been undertaken at UCLH/UCL which received a proportion of funding from the Department of Health NIHR Biomedical Research Centres funding scheme.
References
- 1. Takeshita F, Gursel I, Ishii KJ, Suzuki K, Gursel M, Klinman DM. Signal transduction pathways mediated by the interaction of CpG DNA with Toll‐like receptor 9. Semin Immunol 2004; 16: 17–22. [DOI] [PubMed] [Google Scholar]
- 2. Klinman DM. Immunotherapeutic uses of CpG oligodeoxynucleotides. Nat Rev Immunol 2004; 4: 248–57. [DOI] [PubMed] [Google Scholar]
- 3. Fiegl H, Millinger S, Goebel G et al. Circulating tumor‐specific DNA: a marker for monitoring efficacy of adjuvant therapy in cancer patients. Cancer Res 2005; 65: 1141–5. [DOI] [PubMed] [Google Scholar]
- 4. Müller HM, Widschwendter A, Fiegl H et al. DNA methylation in serum of breast cancer patients: An independent prognostic marker. Cancer Res 2003; 63: 7641–5. [PubMed] [Google Scholar]
- 5. Jackson K, Yu MC, Arakawa K et al. DNA hypomethylation is prevalent even in low‐grade breast cancers. Cancer Biol Ther 2004; 3: 1225–31. [DOI] [PubMed] [Google Scholar]
- 6. Widschwendter M, Jiang G, Woods C et al. DNA hypomethylation and ovarian cancer biology. Cancer Res 2004; 64: 4472–80. [DOI] [PubMed] [Google Scholar]
- 7. Merrell MA, Ilvesaro JM, Lehtonen N et al. Toll‐like receptor 9 agonists promote cellular invasion by increasing matrix metalloproteinase activity. Mol Cancer Res 2006; 7: 437–47. [DOI] [PubMed] [Google Scholar]
- 8. Ilvesaro JM, Merrell MA, Li L et al. Toll‐like receptor 9 mediates CpG oligonucleotide‐induced cellular invasion. Mol Cancer Res 2008; 10: 1534–43. [DOI] [PubMed] [Google Scholar]
- 9. Widschwendter M, Berger J, Hermann M et al. Methylation and silencing of the retinoic acid receptor‐beta2 gene in breast cancer. J Natl Cancer Inst 2000; 92: 826–32. [DOI] [PubMed] [Google Scholar]
- 10. Weisenberger DJ, Campan M, Long TI et al. Analysis of repetitive element DNA methylation by MethyLight. Nucleic Acids Res 2005; 33: 6823–36. [DOI] [PMC free article] [PubMed] [Google Scholar]
- 11. Müller HM, Fiegl H, Goebel G et al. MeCP2 and MBD2 expression in human neoplastic and non‐neoplastic breast tissue and its association with oestrogen receptor status. Br J Cancer 2003; 89: 1934–9. [DOI] [PMC free article] [PubMed] [Google Scholar]
- 12. Bieche I, Franc B, Vidaud D, Vidaud M, Lidereau R. Analyzes of MYC, ERBB2, and CCND1 genes in benign and malignant thyroid follicular cell tumors by real‐time polymerase chain reaction. Thyroid 2001; 11: 147–52. [DOI] [PubMed] [Google Scholar]
- 13. Obexer P, Geiger K, Ambros PF, Meister B, Ausserlechner MJ. FKHRL1‐mediated expression of Noxa and Bim induces apoptosis via the mitochondria in neuroblastoma cells. Cell Death Differ 2007; 14: 534–47. [DOI] [PubMed] [Google Scholar]
- 14. Obexer P, Hagenbuchner J, Unterkircher T et al. Repression of BIRC5/survivin by FOXO3/FKHRL1 sensitizes human neuroblastoma cells to DNA damage‐induced apoptosis. Mol Biol Cell 2009; 20: 2041–8. [DOI] [PMC free article] [PubMed] [Google Scholar]
- 15. Liang CC, Park AY, Guan JL. In vitro scratch assay: a convenient and inexpensive method for analysis of cell migration in vitro. Nat Protoc 2007; 2: 329–33. [DOI] [PubMed] [Google Scholar]
- 16. Geymayer S, Doppler W. Activation of NF‐kappaB p50/p65 is regulated in the developing mammary gland and inhibits STAT5‐mediated beta‐casein gene expression. FASEB J 2000; 14: 1159–70. [DOI] [PubMed] [Google Scholar]
- 17. Yasuda K, Richez C, Uccellini MB et al. Requirement for DNA CpG content in TLR9‐dependent dendritic cell activation induced by DNA‐containing immune complexes. J Immunol 2009; 183: 3109–17. [DOI] [PMC free article] [PubMed] [Google Scholar]
- 18. Ehrlich M. DNA methylation in cancer: too much, but also too little. Oncogene 2002; 21: 5400–13. [DOI] [PubMed] [Google Scholar]
- 19. Feinberg AP, Vogelstein B. Hypomethylation distinguishes genes of some human cancers from their normal counterparts. Nature 1983; 301: 89–92. [DOI] [PubMed] [Google Scholar]
- 20. Gama‐Sosa MA, Slagel VA, Trewyn RW et al. The 5‐methylcytosine content of DNA from human tumors. Nucleic Acids Res 1983; 11: 6883–94. [DOI] [PMC free article] [PubMed] [Google Scholar]
- 21. Rutz M, Metzger J, Gellert T et al. Toll‐like receptor 9 binds single‐stranded CpG‐DNA in a sequence‐ and pH‐dependent manner. Eur J Immunol 2004; 34: 2541–50. [DOI] [PubMed] [Google Scholar]
- 22. Latz E, Schoenemeyer A, Visintin A et al. TLR9 signals after translocating from the ER to CpG DNA in the lysosome. Nat Immunol 2004; 5: 190–8. [DOI] [PubMed] [Google Scholar]
- 23. Ren T, Xu L, Jiao S et al. TLR9 signaling promotes tumor progression of human lung cancer cell in vivo. Pathol Oncol 2009; 15: 623–30. [DOI] [PubMed] [Google Scholar]
- 24. Ilvesaro JM, Merrell MA, Swain TM et al. Toll like receptor‐9 agonists stimulate prostate cancer invasion in vitro. Prostate 2007; 67: 774–81. [DOI] [PubMed] [Google Scholar]
- 25. Haining WN, Davies J, Kanzler H et al. CpG oligodeoxynucleotides alter lymphocyte and dendritic cell trafficking in humans. Clin Cancer Res 2008; 14: 5626–34. [DOI] [PubMed] [Google Scholar]
- 26. Di JM, Pang J, Sun QP et al. Toll‐like receptor 9 agonists up‐regulates the expression of cyclooxygenase‐2 via activation of NF‐kappaB in prostate cancer cells. Mol Biol Rep 2009; doi 10.1007/s11033‐009‐9620‐5 (in print). [DOI] [PubMed] [Google Scholar]