

Abstract
Objective
To determine if children born preterm and exposed to chorioamnionitis have differences in brain structure measured at 6 to10 years of age using magnetic resonance imaging (MRI).
Methods
Structural MRI was performed with11 preterm children (8.5 ± 1.7 yrs) with chorioamnionitis and 16 preterm children (8.7±1.4 yrs) without chorioamnionitis. Cortical surface reconstruction and volumetric segmentation were performed with FreeSurfer image analysis software. Subcortical structures were analyzed using multivariate analysis.
Results
Widespread regional differences in cortical thickness were observed. With chorioamnionitis, the frontal and temporal lobes were primarily affected by decreased cortical thickness, and, the limbic, parietal and occipital lobes were primarily affected by increased cortical thickness when compared to the comparison group. Subcortical differences were observed in the hippocampus and lateral ventricle.
Conclusion
Using MRI, chorioamnionitis is associated with long term widespread regional effects on brain development in children born prematurely. Our study is limited by its small sample size.
Keywords: Chorioamnionitis, Magnetic Resonance Imaging, Neurodevelopment, Preterm, Infection
INTRODUCTION
Chorioamnionitis, a common etiology of preterm birth, has often been cited as a risk factor for the development of cerebral palsy and brain injury.1–5 Additionally, cystic periventricular leukomalacia (cPVL), damage to deep white matter, is thought to be a precursor to cerebral palsy in that 60 to 100% of infants with cPVL go on to develop cerebral palsy suggesting that white matter injury may be associated with intrauterine infection.6 A meta-analysis documented that chorioamnionitis is a risk factor for cerebral palsy in both term and preterm delivered infants.7 Although cerebral palsy is a severe manifestation of brain injury, there are likely other subclinical effects associated with exposure to chorioamnionitis. Subclinical or less severe manifestations of abnormal brain development (including both grey and white matter damage) may ultimately play a role in cognitive development or other pathologic processes.
The association between intrauterine infection and brain injury is strongly supported in experimental studies utilizing animal models. In addition to white matter damage observed following experimentally induced intrauterine infection8, Gavilanes et al, demonstrated global and diffuse effects on the central nervous system, including decreased number of neurons in the cortex, hippocampus and substantia nigra.9 Together these findings, as well as others, suggest the potential for global and diffuse neurologic injury as a direct result of intrauterine infection and that this damage extends beyond white matter injury alone.
There is a paucity of data describing the consequences of intrauterine infection for brain development in humans. Preterm birth is associated with compromised brain development.10–12 Given the evidence from animal models that intrauterine infection leads to widespread neurological deficits9 and the prevalence of infection among women delivering preterm13, it is plausible that exposure to chorioamnionitis may contribute to additional neurologic impairments observed in children born preterm beyond that of prematurity alone. To date, there are only two studies attempting to evaluate the effects of chorioamnionitis on brain structure and neither used a whole brain approach; one assessed the effectiveness of a specific technique in the evaluation of isolated white matter injury14in the neonate and the other performed a randomly chosen region specific analysis at term gestational age.15 Thus far, there have been no long term follow up studies attempting to identify persisting differences in brain development in children exposed to chorioamnionitis prenatally using whole brain magnetic resonance imaging (MRI) techniques. Our hypothesis, largely driven by the experimental literature, is that chorioamnionitis would lead to widespread and diffuse alterations in child brain morphology and as such consider the whole brain approach preferable. Therefore, the objective of the current investigation was to determine if chorioamnionitis is associated with neurologic differences in children born preterm as measured by cortical thickness and volume of subcortical structures.
MATERIALS AND METHODS
The Institutional Review Board for protection of human subjects at the University of California, Irvine approved the study protocol. Written and informed consent was obtained from mothers prior to study enrollment. Children ages 6 to 10 were recruited into a study of prenatal influences on child brain development, and a subset of these were assessed with structural MRI. Children were born at either the University of California Irvine Medical Center or Long Beach Memorial Medical Center/Miller Children’s Hospital, a community hospital affiliate of the university.
Subject Selection
Participants included 11 children who were born preterm with documented exposure to chorioamnionitis and 16 children born preterm who were not exposed to chorioamnionitis, but with similar neonatal characteristics. Subjects participated in a larger study of prenatal influences on child development at the University of California, Irvine and were eligible for participation in this sub-study based on the following criteria: Subjects were included if they were singletons and greater than 28 and less than 37 gestational weeks at birth (based on ACOG dating criteria).16 Exclusion criteria for participation included congenital or genetic anomaly, maternal preeclampsia or HELLP syndrome, maternal drug use, or postnatal steroid administration. See Figure 1. Subjects that met inclusion criteria were recruited in two groups: those with and without antenatal exposure to chorioamnionitis. Exposure to chorioamnionitis was based on clinical and/or histopathological assessment. Clinical criteria for chorioamnionitis was defined as fever (≥100.4°F) in the presence of preterm labor, preterm premature ruptured membranes, maternal or fetal tachycardia, or foul smelling discharge or amniotic fluid. Subjects in the comparison group were born concurrently with the target group and had placental histopathology reports documenting the absence of chorioamnionitis.
Figure 1.

Flow diagram of subject selection.
Maternal and Neonatal Characteristics
Background characteristics including demographic variables were determined at the time of study entry by standardized maternal interview. Maternal intellectual performance was determined by the Perceptual Reasoning Scale of the Wechsler Adult Intelligence Scale17. Neonatal and maternal medical characteristics including birth outcome data were determined by chart abstraction. Hypotension was defined by either the use of pharmacologic pressor support or documentation of hypotension in the medical records. The presence of intraventricular hemorrhage was evaluated by cranial ultrasounds which were obtained as part of standard convention. Sepsis was defined by positive blood cultures and diagnosis documented in the medical record.
MR Imaging protocol
T1 weighted scans were acquired in a 3T Philips Achieva system using a 3D MPRAGE pulse sequence that covered the whole brain. The images were acquired in the sagittal orientation with FOV=240×240mm2, 1mm3 isotropic voxel dimensions, 150 slices, TR=11ms, TE=3.3ms, inversion pulse delay =1100ms, flip angle=18°. No signal averaging and no SENSE acceleration were used.
Image processing
Cortical surface reconstruction and volumetric segmentation was performed with the FreeSurfer image analysis software suite which is available for download online (http://surfer.nmr.mgh.harvard.edu/). It should be emphasized that the calculations of cortical thickness are generated directly by the software and independent of the operator. Further, the operator was not aware of the study hypothesis. Streamlined image processing procedures are provided in this software package, which first begins by applying intensity normalization prior to segmentation to minimize errors in identifying the boundaries.18 This is followed by removal of non-brain tissues.19 Then, the images are transformed into the Talairach space and subcortical white matter and subcortical gray matter structures are segmented.20,21 Pial and white matter surfaces were located by finding the highest intensity gradient, which defines the transition from one tissue class to the other.22–24 Once the preprocessing steps are completed, surface inflation is applied to each individual brain and the inflated brains are registered to a spherical atlas.25 This procedure utilizes individual cortical folding patterns to achieve accurate registration of cortical geometry across subjects.26 Cortical thickness is calculated as the closest distance from the gray matter / white matter surface to the pial surface at each vertex on the tessellated surface.24 Procedures for the measurement of cortical thickness have been validated against histological analysis27 and manual measurements.28,29 The cortical surface images generated by the FreeSurfer software were visually inspected for errors in segmentation and corrections were made as needed.
Analysis of group differences in cortical thickness
Differences between groups in cortical thickness were analyzed at each and every node on the cortical surface using a standard statistical approach for whole brain analyses. In this method, the software represents the brain surface with a dense array of vertices. At each vertex, the brain thickness is calculated for each subject. Then the software applies a general linear model (GLM) to test the significance of independent variables (i.e. chorioamnionitis) on the variations of cortical thickness across subjects at each and every vertex location. If an effect has strong correlation with the variations in cortical thickness across subjects at that vertex, one gets a strong effect size. This effect size is tested against the null hypothesis using a t-test and the resultant T-scores are reported. Spatially normalized cortical thickness maps of each subject were entered into an ANOVA model using the False Discovery Rate (FDR) correction for multiple comparisons (p<.05) as recommended by Genovese and colleagues and is the standard approach to avoid a type 1 error with this whole brain analysis.30.
Analysis of volumetric differences in subcortical gray matter
The volume of each structure was calculated by the FreeSurfer program. Group differences in volume of subcortical structures were analyzed using analysis of covariance (ANCOVA) with intracranial volume as a covariate.
RESULTS
Clinical characteristics
Of the eleven subjects in the chorioamnionitis group, seven were diagnosed by histological criteria, 2 by clinical and histological criteria, and 2 by clinical criteria. Indications for delivery in this group included preterm premature rupture of membranes (PPROM) (n=7), preterm labor (PTL) (n=3), preterm labor with abruption (n=1). All 16 subjects in the comparison group had histopathology reports available documenting the absence of chorioamnionitis or funisitis. Indications for delivery in the comparison group were PPROM (n=5), PTL (n=4) and non-reassuring fetal status secondary to abruption (n=2), diabetes (n=2), and not stated (n=3).
Background and demographic data
Descriptive data for the study groups can be found in Table 1. Groups did not significantly differ in child factors (age at MRI, total brain volume, race or sex), maternal intellectual performance or sociodemographic characteristics (maternal education, marital status, or household income). Neonatal health outcomes were not significantly different between groups and are shown in Table 2. Importantly, with the two groups had similar ranges and distributions of gestational age at delivery and birth weight. A greater percentage of children in the chorioamnionitis group were exposed to antenatal steroids compared to the comparison group (11 chorioamnionitis group and 8 comparison group, p= .008). All MR images were reviewd by a clinical radiologist and no frank injury was observed A sub-analysis of MRI’s including only those 18 subjects exposed to antenatal steroids did not significantly change the study findings (data not shown). Further, two subjects in the chorioamnionitis group were left handed. Again, a sub-analysis of MRI’s including only subjects who were right handed did not significantly change the study findings (data not shown).
Table 1.
Descriptive Data
| Chorioamnionitis (N=11) |
Comparison (N=16) |
Significance level (p-value) |
|
|---|---|---|---|
| Subject Characteristics | |||
| Child Age at MRI | 8.5 years ±1.7 | 8.7 years ±1.4 | 0.61 |
| Total Brain Volume | 1529cc (±133) | 1486cc(±212) | 0.56 |
| Race | 0.71 | ||
| Hispanic | 5 (46%) | 10 (62%) | |
| White | 4 (36%) | 4 (25%) | |
| African-American | 0 | 2 (13%) | |
| Multi-Ethnic | 1 (9%) | 0 | |
| Other | 1 (9%) | 0 | |
| Sex | 6 male, 5 female | 12 male, 4 female | 0.41 |
| Maternal and Household Characteristics | |||
| Household Income | 0.21 | ||
| under $30,000 | 6 (55%) | 4 (25%) | |
| $30,001 to 60,000 | 2 (18%) | 4 (25%) | |
| $60,001 to 100,000 | 1 (9 %) | 2 (13%) | |
| over $100,000 | 2 (18%) | 6 (37%) | |
| Maternal Education | 0.11 | ||
| High school or equivalent | 6 (55%) | 9 (56%) | |
| College graduate | 2 (18%) | 6 (38%) | |
| Maternal WAIS POI score M(SD) | 92.8 (16.8) | 92.6 (16.2) | 0.97 |
| Maternal Marital Status (% married or cohabitating) | 6 (55%) | 12 (75%) | 0.41 |
t-tests, Chi-Square and Fisher Exact tests
Data presented as n(%) or mean±SD.
Table 2.
Neonatal Outcomes
| Chorioamnionitis (N=11) |
Comparison (N=16) |
P-Value | |
|---|---|---|---|
| Gestational Age at Birth (wk) | 31.2 (29.4–35.4) | 31.5 (28.4–36.0) | .66 |
| Birth weight (g) | 1660 (1404–2906) | 1850 (1042–3179) | .35 |
| 1-min Apgar score | 8(6–9) | 7(2–9) | .09 |
| 5-min Apgar score | 9(7–9) | 8.5(8–9) | .51 |
| Mechanical Ventilation | 3(27%) | 6(37%) | .55 |
| Intraventricular Hemorrhage (All) | 1(9%) | 1(6%) | .66 |
| Culture-confirmed Sepsis | 0(0%) | 3(19%) | .19 |
| Antibiotic Treatment for presumed sepsis | 9(82%) | 13(81%) | .67 |
| Hypotension/Pressor Administration | 1(9%) | 2(12.5%) | .78 |
Mann-Whitney U, Fisher’s exact and t-tests for all group comparisons
Data presented as n(%) or median(range).
Analysis of cortical thickness
Widespread and predominantly bilateral differences in cortical thickness were observed between groups. Regions with associations that achieved statistical significance (p<.05) after standard FDR correction for multiple comparisons are shown in Figure 2 and Table 3. Chorioamnionitis was primarily associated with a thinner cortex in multiple regions within the frontal and temporal lobe as shown in Figure 2 (blue overlays). In the frontal lobe, the majority of the effects were bilateral with the exception of the pars opercularis in which there was a unilateral effect in the left hemisphere. The most prominent findings were seen in the precentral (motor cortex), paracentral (supplementary motor), pars opercularis (Broca’s area) and lateral orbital frontal regions. In the temporal lobe, the largest group differences were observed in the superior temporal (auditory cortex) region. Areas of greater cortical thickness in the chorioamnionitis group were also observed in a few distinct anatomic loci in the frontal and temporal lobes (red overlays), primarily the caudal middle frontal cortex.
Figure 2.
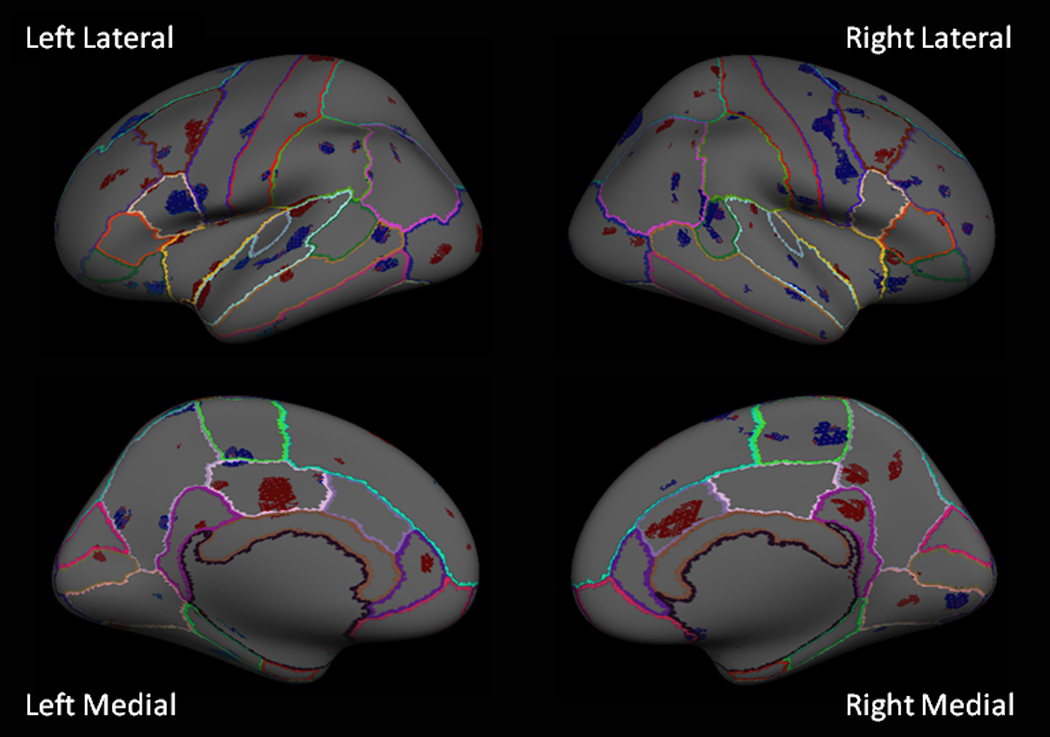
Inflated brain surfaces of lateral (top panel) and medial (lower panel) views of the left and right hemispheres are shown. Blue overlays indicate regions in the cortex significantly thinner (p<.05 after FDR correction) in the chorioamnionitis group. Red overlays indicate regions that were significantly thicker (p<.05 after FDR correction) in the chorioamnionitis group. Multi-colored lines define the boundaries of known anatomical brain regions.
Table 3.
| a: Chorioamnionitis Thinner than Comparison Group | |||
|---|---|---|---|
| Brain Region | Chorioamnionitis Cortical Thickness |
Comparison Cortical Thickness |
T-score |
| Frontal Lobe | |||
| Superior Frontal | |||
| Left Hemisphere | 2.82 | 3.06 | 3.78 |
| Right Hemisphere | 3.12 | 3.30 | 2.06 |
| Precentral | |||
| Left Hemisphere | 2.20 | 2.40 | 2.56 |
| Right Hemisphere | 2.85 | 3.09 | 3.14 |
| Paracentral | |||
| Left Hemisphere | 3.00 | 3.28 | 2.28 |
| Right Hemisphere | 2.58 | 2.86 | 2.52 |
| Pars Opercularis | |||
| Left Hemisphere | 2.77 | 3.13 | 3.60 |
| Lateral Orbital-Inferior | |||
| Left Hemisphere | 3.11 | 3.48 | 2.64 |
| Right Hemisphere | 3.30 | 3.58 | 3.16 |
| Paracentral | |||
| Left Hemisphere | 2.50 | 2.82 | 2.28 |
| Right Hemisphere | 2.58 | 2.86 | 2.52 |
| Rostral Middle-Inferior | |||
| Left Hemisphere | 2.96 | 3.13 | 1.91 |
| Right Hemisphere | 2.84 | 3.08 | 2.18 |
| Caudal Middle | |||
| Left Hemisphere | 2.80 | 3.01 | 2.02 |
| Right Hemisphere | 3.49 | 3.69 | 2.26 |
| Temporal Lobe | |||
| Superior Temporal | |||
| Left Hemisphere | 3.00 | 3.28 | 2.36 |
| Right Hemisphere | 3.44 | 3.70 | 2.16 |
| Middle Temporal | |||
| Left Hemisphere | 3.03 | 3.41 | 2.71 |
| Right Hemisphere | 2.86 | 3.09 | 2.64 |
| Inferior Temporal | |||
| Left Hemisphere | 3.23 | 3.57 | 2.11 |
| Superior Temporal Sulcus | |||
| Right Hemisphere | 2.78 | 3.00 | 3.16 |
| Anterior Fusiform | |||
| Left Hemisphere | 3.12 | 3.45 | 3.06 |
| Parietal Lobe | |||
| Inferior Parietal | |||
| Left Hemisphere | 2.94 | 3.22 | 2.14 |
| Right Hemisphere | 2.86 | 3.05 | 2.10 |
| Supramarginal | |||
| Left Hemisphere | 3.23 | 3.60 | 2.39 |
| Occipital Lobe | |||
| Posterior Lingual | |||
| Right Hemisphere | 1.88 | 2.20 | 2.77 |
| b: Chorioamnionitis Group Thicker than Comparison Group | |||
|---|---|---|---|
| Brain Region | Chorioamnionitis Cortical Thickness |
Comparison Cortical Thickness |
T-score |
| Frontal Lobe | |||
| Superior Frontal | |||
| Left Hemisphere | 4.00 | 3.78 | 1.99 |
| Lateral Orbital-Superior | |||
| Right Hemisphere | 3.35 | 2.93 | 2.23 |
| Rostral Middle Superior | |||
| Left Hemisphere | 2.93 | 2.68 | 2.84 |
| Caudal Middle | |||
| Left Hemisphere | 3.09 | 2.77 | 3.28 |
| Right Hemisphere | 3.00 | 2.81 | 2.65 |
| Temporal Lobe | |||
| Insular Ridge | |||
| Left Hemisphere | 3.55 | 3.20 | 3.25 |
| Right Hemisphere | 3.30 | 3.01 | 2.80 |
| Superior Sulcus | |||
| Left Hemisphere | 2.91 | 2.46 | 3.22 |
| Posterior Fusiform | |||
| Right Hemisphere | 3.43 | 3.18 | 2.5 |
| Inferior Temporal | |||
| Right Hemisphere | 3.55 | 3.26 | 2.17 |
| Limbic Lobe | |||
| Isthmus Cingulate | |||
| Right Hemisphere | 3.45 | 3.08 | 2.82 |
| Anterior Cingulate | |||
| Left Hemisphere | 4.00 | 3.74 | 1.87 |
| Right Hemisphere | 3.35 | 3.06 | 2.66 |
| Posterior Cingulate | |||
| Left Hemisphere | 2.89 | 2.55 | 2.12 |
| Parietal Lobe | |||
| Postcentral | |||
| Left Hemisphere | 2.25 | 1.86 | 2.59 |
| Precuneus | |||
| Right Hemisphere | 3.22 | 2.95 | 2.28 |
| Inferior Parietal | |||
| Left Hemisphere | 3.06 | 2.77 | 2.44 |
| Right Hemisphere | |||
| Superior Parietal | |||
| Left Hemisphere | 2.78 | 2.54 | 1.86 |
| Right Hemisphere | 3.07 | 2.82 | 1.91 |
| Occipital Lobe | |||
| Lateral Occipital | |||
| Left Hemisphere | 2.29 | 2.03 | 2.26 |
| Right Hemisphere | 2.74 | 2.58 | 1.97 |
| Anterior Lingual | |||
| Right Hemisphere | 2.94 | 2.96 | 2.18 |
All data shown (mean cortical thickness in mm and T-scores) p<.05 after FDR correction
All data shown (mean cortical thickness in mm) p<.05 after FDR correction
As illustrated in Figure 2 (red overlays), in areas of the limbic, parietal and occipital cortex, prenatal exposure to chorioamnionitis was associated with areas of higher cortical thickness as compared to the comparison group. In the limbic lobe, there was a predominance of cortical thickening in all regions of the cingulate cortex (bilateral anterior, right isthmus, and left posterior cingulate). The parietal lobe was significant for areas of increased thickness in the right precuneus and left postcentral gyrus (primary somatosensory cortex). In the occipital lobe, areas of increased cortical thickness were observed bilaterally in the lateral occipital (visual association) region. A few distinct loci within the parietal and occipital lobes demonstrated areas of cortex that were thinner in the chorioamnionitis group than the comparison group (blue overlays). Thinner cortices were observed in the group of children with chorioamnionitis in the left inferior parietal and right posterior lingual regions.
For illustrative purposes, figure 3 shows cortical thickness data with box plots in four representative brain regions where group differences were observed. Data are shown for the Pars Opercularis and Superior Temporal regions where the chorioamnionitis group had significantly thinner cortices and the Anterior and Isthmus Cingulate where the chorioamnionitis group had significantly thicker cortices.
Figure 3.
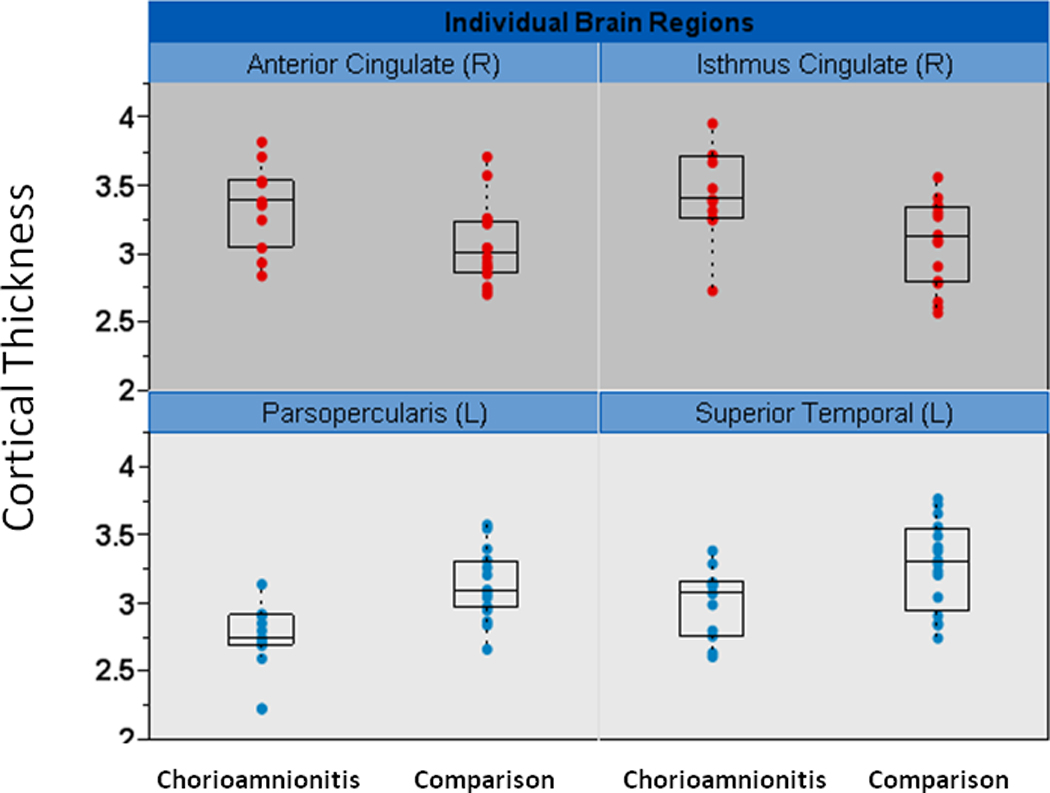
Representative brain regions showing individual data for cortical thickness (y-axis in mm). Box plots showing the median cortical thickness and upper and lower quartiles are overlaid with the individual subject point data for cortical thickness. The upper panel (red filled circles point data) demonstrates 2 regions with thicker cortex in the chorioamnionitis group. The lower panel (blue filled circles point data) demonstrates 2 regions with thinner cortex in the chorioamnionitis group. L=left hemisphere R=right hemisphere
Volumetric differences in subcortical gray matter
Subcortical analysis revealed that the right hippocampus was significantly smaller in children exposed to chorioamnionitis as compared to the comparison group (3957 ±283 vs 4201± 533 cc) (p=.05) and the left lateral ventricle was significantly larger in the chorioamnionitis exposed (5830cc) as compared to the comparison group (5830± 2610 vs 4031± 2150 cc) (p=.009) after controlling for intracranial volume. No other subcortical structures showed significant differences between groups.
COMMENT
To our knowledge, this is the first report demonstrating long term alterations in brain morphology associated with prenatal exposure to chorioamnionitis. We found profound and persisting differences between groups which suggests that chorioamnionitis is associated with global consequences for brain development. Although there were diffuse changes in cortical thickness in all lobes, the pattern was consistent with more areas of thinness in the frontal and temporal lobes and more areas of thickness in the limbic, parietal and occipital lobes in children exposed to chorioamnionitis. Although it is not known why both thinness and thickness in cortical tissue were observed, we speculate that this observation may represent a disorganized pattern of brain development resulting from disruptions in normal developmental trajectories as there are clear deviations from expected patterns seen in the age matched comparison group. Brain development appears to be compromised among children exposed to chorioamnionitis suggesting that these children may be at risk for neurodevelopmental impairments.
The findings from our study suggest the potential for diverse and widespread cognitive deficits associated with exposure to chorioamnionitis documenting the need for studies of cognitive functioning in children exposed to chorioamnionitis. Indeed, damage to many of the regions altered in the chorioamnionitis group are associated with known functional deficits. For example, large effects were found in many regions that are important for learning and memory (cingulate and lateral orbital frontal cortex; hippocampus), and executive functions (caudal middle frontal cortex). Broca’s area, which is important in language processing, was one region with the most significant reductions in cortical thickness in the chorioamnionitis group. Additional areas that were found to have significant differences and are of functional significance included auditory (superior temporal), visual (lateral occipital), motor (precentral) and somatosensory (postcentral) processing again illustrating the range of potential dysfunction.
Activation of the fetal inflammatory response to maternal infection is presumed to be the pathogenesis of neurologic injury, and is characterized by systemic activation of the innate fetal immune system. Many markers of the fetal inflammatory response have been linked to adverse neonatal outcomes including increased risk for PVL and cerebral palsy.31,32 These markers including elevated levels of interleukin 6 (IL-6),33–35 tumor necrosis factor-α (TNF-α),33 and matrix metalloproteinase-8 (MMP-8)36 and their potential role in neurologic injury have been studied in both the clinical and experimental literature. Hagberg and Mallard extensively reviewed the experimental literature and endorse the role of inflammation in mediating central nervous system damage which renders it more vulnerable to insult through the release of cytokines, prostaglandins, trophic factors and microglial activation.37 Inflammatory byproducts from infection therefore may plausibly act in ways to manifest a wide array of deficits, some may be extreme such cerebral palsy and others more subtle. Nonetheless, these deficits may have pervasive consequences for neurologic development.
A strength of this study is the long term follow-up of a well-characterized cohort of children assessed 6 to 10 years after exposure to chorioamnionitis. Strict inclusion and exclusion criteria were applied in an attempt to isolate specific effects of chorioamnionitis. For example, we excluded all cases with preeclampsia as the pathophysiology of this disease could have confounded the findings of this study. Our study, however, is limited by sample size. Further, our cohorts were well matched on other variables known to affect brain structure (i.e. gestational age, birth weight and age at MRI). Despite our small sample size, our results were robust and stood up to stringent statistical analyses with false discovery rate correction for multiple comparisons. Further, our results cannot be explained by outliers as the individual cortical thickness plots demonstrate compelling evidence of findings affecting the majority of subjects within a group. One report in the literature evaluated short term neurologic consequences of antenatal and neonatal characteristics with MRI in preterm infants at term equivalent age.15They concluded that abnormal findings on MRI were associated with postnatal hypotension and sepsis but not with chorioamnionitis. However, their analysis was limited to eight small predefined randomly selected brain regions with the opportunity to miss important findings in regions not represented in the pre-defined areas. Additionally, the data from Chau et al. do not address the long term differences evaluated in our study.15 We believe a major strength of our study is the methodology using a whole brain approach to observe long term neurologic changes, 6 to 10 years after exposure, in this carefully selected cohort of children.
Clearly, studies with larger sample sizes are needed to attempt to replicate these findings as well as to clarify the influence of other aspects of clinical management on outcomes. We question whether or not larger morphologic differences are observed when there is evidence of activation of the fetal inflammatory response as demonstrated by the presence of funisitis. Only with future studies will there be hope of directing care that will lead to improved clinical outcomes.
The results of our study suggest that in utero exposure to chorioamnionitis has the potential to change the trajectory of brain development with pervasive consequences that last at least into childhood. This disruption in neurodevelopment may further increase susceptibility for impaired cognitive and motor function as well as psychiatric and neurodevelopmental disorders.38,39
ACKNOWLEDGEMENTS
This research was supported by NIH R01 HD050662 to EPD. The assistance of Megan Blair, Natalie Hernandez, Kourney Osorio, Angela Pike, and Christine Preslicka is gratefully acknowledged.
Financial disclosure: This report was funded in part by NICHD R01 HD050662. (PI: Davis)
Footnotes
Publisher's Disclaimer: This is a PDF file of an unedited manuscript that has been accepted for publication. As a service to our customers we are providing this early version of the manuscript. The manuscript will undergo copyediting, typesetting, and review of the resulting proof before it is published in its final citable form. Please note that during the production process errors may be discovered which could affect the content, and all legal disclaimers that apply to the journal pertain.
These findings were presented at the 31st Annual Society for Maternal Fetal Medicine meeting in San Francisco, CA February 12, 2011
The authors report no conflict of interest
REFERENCES
- 1.Alexander JM, Gilstrap LC, Cox SM, McIntire DM, Leveno KJ. Clinical chorioamnionitis and the prognosis for very low birth weight infants. Obstet Gynecol. 1998;91:725–729. doi: 10.1016/s0029-7844(98)00056-8. [DOI] [PubMed] [Google Scholar]
- 2.Bashiri A, Burstein E, Mazor M. Cerebral palsy and fetal inflammatory response syndrome: a review. J Perinat Med. 2006;34:5–12. doi: 10.1515/JPM.2006.001. [DOI] [PubMed] [Google Scholar]
- 3.Dammann O, Leviton A. Maternal intrauterine infection, cytokines, and berain damage in the preterm newborn. Pediatr Res. 1997;42:1–8. doi: 10.1203/00006450-199707000-00001. [DOI] [PubMed] [Google Scholar]
- 4.Grether JK, Nelson KB. Maternal infection and cerebral palsy in infants of normal birthweight. JAMA. 1997;278:207–211. [PubMed] [Google Scholar]
- 5.Thomas W, Speer CP. Chorioamnionitis: Important risk factor of innocent bystander for neonatal outcome. Neonatology. 2010;99:177–187. doi: 10.1159/000320170. [DOI] [PubMed] [Google Scholar]
- 6.Leviton A, Paneth N. White matter damage in preterm newborns-an epidemiologic perspective. Early Hum Dev. 1990;24:1–22. doi: 10.1016/0378-3782(90)90002-z. [DOI] [PubMed] [Google Scholar]
- 7.Wu YW, Colford JM., Jr Chorioamnionitis as a risk factor for cerebral palsy: A meta-analysis. JAMA. 2000;284:1417–1424. doi: 10.1001/jama.284.11.1417. [DOI] [PubMed] [Google Scholar]
- 8.Yoon BH, Kim CJ, Romero R, et al. Experimentally induced intrauterine infection causes fetal brain white matter lesions in rabbits. Am J Obstet Gynecol. 1997;177:797–802. doi: 10.1016/s0002-9378(97)70271-0. [DOI] [PubMed] [Google Scholar]
- 9.Gavilanes AW, Strackx E, Kramer BW, et al. Chorioamnionitis induced by intraamniotic lipopolysaccharide resulted in an interval-dependent. Am J Obstet Gynecol. 2009;200:437. doi: 10.1016/j.ajog.2008.12.003. [DOI] [PubMed] [Google Scholar]
- 10.Inder TE, Warfield SK, Wang H, Hüppi PS, Volpe JJ. Abnormal cerebral structure is present at term in premature infants. Pediatrics. 2005;115:286–294. doi: 10.1542/peds.2004-0326. [DOI] [PubMed] [Google Scholar]
- 11.Peterson BS, Vohr B, Staib LH, et al. Regional brain volume abnormalities and long-term cognitive outcome in preterm infants. JAMA. 2000;284:1973–1974. doi: 10.1001/jama.284.15.1939. [DOI] [PubMed] [Google Scholar]
- 12.Davis EP, Buss C, Muftuler T, et al. Children’s brain development benefits from longer gestation. Frontiers in Psychology. 2011;2:1–7. doi: 10.3389/fpsyg.2011.00001. [DOI] [PMC free article] [PubMed] [Google Scholar]
- 13.Romero R, Espinoza J, Goncalves LF, et al. The role of inflammation and infection in preterm birth. Semin Reprod med. 2007;25:21–39. doi: 10.1055/s-2006-956773. [DOI] [PMC free article] [PubMed] [Google Scholar]
- 14.Gaudet LM, Flavin MB, Islam O, et al. Diffusion MRI brain findings in neonates exposed to CA: a case series. J Obstet Gyn Can. 2009;31(6):497–503. doi: 10.1016/s1701-2163(16)34211-6. [DOI] [PubMed] [Google Scholar]
- 15.Chau V, Poskitt KJ, McFadden DE, et al. Effect of Chorioamnionitis on Brain Development and Injury in Premature Newborns. Ann Neurol. 2009;66:155–164. doi: 10.1002/ana.21713. [DOI] [PubMed] [Google Scholar]
- 16.ACOG Practice Bulletin No. 101: Ultrasonography in pregnancy. Obstet Gynecol. 2009;113:451–461. doi: 10.1097/AOG.0b013e31819930b0. [DOI] [PubMed] [Google Scholar]
- 17.Wechsler D. Wechsler Adult Intelligence Scale-Third Edition. San Antonio: The Psychological Corporation; 1997. [Google Scholar]
- 18.Sled JG, Zijdenbos AP, Evans AC. A nonparametric method for automatic correction of intensity nonuniformity in MRI data. IEEE Trans Med Imaging. 1998;17:87–97. doi: 10.1109/42.668698. [DOI] [PubMed] [Google Scholar]
- 19.Segonne F, Dale AM, Busa E, et al. A hybrid approach to the skull stripping problem in MRI. Neuroimage. 2004;22:1060–1075. doi: 10.1016/j.neuroimage.2004.03.032. [DOI] [PubMed] [Google Scholar]
- 20.Fischl B, Salat DH, Busa E, et al. Whole brain segmentation: automated labeling of neuroanatomical structures in the human brain. Neuron. 2002;33:341–355. doi: 10.1016/s0896-6273(02)00569-x. [DOI] [PubMed] [Google Scholar]
- 21.Fischl B, Salat DH, van der Kouwe, et al. Sequence-independent segmentation of magnetic resonance images. Neuroimage. 2004a;23:S69–S84. doi: 10.1016/j.neuroimage.2004.07.016. [DOI] [PubMed] [Google Scholar]
- 22.Dale AM, Fischl B, Sereno MI. Cortical surface-based analysis. I. Segmentation and surface reconstruction. Neuroimage. 1999;9:179–194. doi: 10.1006/nimg.1998.0395. [DOI] [PubMed] [Google Scholar]
- 23.Dale AM, Sereno MI. Improved localization of cortical activity by combining EEG and MEG with MRI cortical surface reconstruction: a linear approach. J Cogn Neurosci. 1993;5:162–176. doi: 10.1162/jocn.1993.5.2.162. [DOI] [PubMed] [Google Scholar]
- 24.Fischl B, Dale AM. Measuring the thickness of the human cerebral cortex from magnetic resonance images. Proc Natl Acad Sci USA. 2000;97:11050–11055. doi: 10.1073/pnas.200033797. [DOI] [PMC free article] [PubMed] [Google Scholar]
- 25.Fischl B, Sereno MI, Dale AM. Cortical surface-based analysis. II: Inflation, flattening, and a surface-based coordinate system. Neuroimage. 1999a;9:195–207. doi: 10.1006/nimg.1998.0396. [DOI] [PubMed] [Google Scholar]
- 26.Fischl B, Sereno MI, Tootell RB, Dale AM. High-resolution intersubject averaging and a coordinate system for the cortical surface. Hum Brain Mapp. 1999b;8:272–284. doi: 10.1002/(SICI)1097-0193(1999)8:4<272::AID-HBM10>3.0.CO;2-4. [DOI] [PMC free article] [PubMed] [Google Scholar]
- 27.Rosas HD, Liu AK, Hersch S, et al. Regional and progressive thinning of the cortical ribbon in Huntington's disease. Neurology. 2002;58:695–701. doi: 10.1212/wnl.58.5.695. [DOI] [PubMed] [Google Scholar]
- 28.Kuperberg GR, Broome MR, McGuire PK, et al. Regionally localized thinning of the cerebral cortex in schizophrenia. Arch. Gen. Psychiatry. 2003;60:878–888. doi: 10.1001/archpsyc.60.9.878. [DOI] [PubMed] [Google Scholar]
- 29.Salat DH, Buckner RL, Snyder AZ, et al. Thinning of the cerebral cortex in aging. Cereb Cortex. 2004;14:721–730. doi: 10.1093/cercor/bhh032. [DOI] [PubMed] [Google Scholar]
- 30.Genovese CR, Lazar NA, Nichols T. Thresholding of statistical maps in functional neuroimaging use the false discovery rate. Neuroimage. 2002;15:870–878. doi: 10.1006/nimg.2001.1037. [DOI] [PubMed] [Google Scholar]
- 31.Gomez R, Romero R, Ghezzi F, Yoon BH, Mazor M, Berry SM. The fetal inflammatory response syndrome. Am J Obstet Gynecol. 1998;179:194–202. doi: 10.1016/s0002-9378(98)70272-8. [DOI] [PubMed] [Google Scholar]
- 32.Gotsch F, Romero R, Kusanovic JP, et al. The fetal inflammatory response symdrome. Clin Obstet Gynecol. 2007;50:652–683. doi: 10.1097/GRF.0b013e31811ebef6. [DOI] [PubMed] [Google Scholar]
- 33.Duggan PJ, Maalouf EF, Watts TL, et al. Intrauterine T-cell activation and increased proinflammatory cytokine concentrations in preterm infants with cerebral lesions. Lancet. 2001;358:1699–1700. doi: 10.1016/s0140-6736(01)06723-x. [DOI] [PubMed] [Google Scholar]
- 34.Viscardi RM, Muhumuza CK, Rodriguez A, et al. Inflammatory markers in intrauterine and fetal blood and cerebrospinal fluid compartments are associated with adverse pulmonary and neurologic outcomes in preterm infants. Pediatr Res. 2004;55:1009–1017. doi: 10.1203/01.pdr.0000127015.60185.8a. [DOI] [PubMed] [Google Scholar]
- 35.Yoon BH, Romero R, Yang SH, et al. Interleukin-6 concentrations in umbilical cord plasma are elevated in neonates with white matter lesions associated with periventricular leukomalacia. Am J Obstet Gynecol. 1996;174:1433–1440. doi: 10.1016/s0002-9378(96)70585-9. [DOI] [PubMed] [Google Scholar]
- 36.Moon JB, Kim JC, Yoon BH, et al. Amniotic fluid matrix metalloproteinase-8 and the development of cerebral palsy. J Perinat Med. 2002;30:301–306. doi: 10.1515/JPM.2002.044. [DOI] [PubMed] [Google Scholar]
- 37.Hagberg H, Mallard C. Effect of inflammation on central nervous system development and vulnerability. Curr Opin Neurol. 2005;18:117–123. doi: 10.1097/01.wco.0000162851.44897.8f. [DOI] [PubMed] [Google Scholar]
- 38.Kates WR, Burnett CP, Eliez S, et al. Neuroanatomic variation in monozygotic twin pairs discordant for the narrow phenotype for autism. Am J Psychiatry. 2004;161:539–546. doi: 10.1176/appi.ajp.161.3.539. [DOI] [PubMed] [Google Scholar]
- 39.Koenigs M, Grafman J. The functional neuroanatomy of depression: distinct roles for ventromedial and dorsolateral prefrontal cortex. Behav Brain Res. 2009;201:239–243. doi: 10.1016/j.bbr.2009.03.004. [DOI] [PMC free article] [PubMed] [Google Scholar]