Abstract
In an important paper on the physics of small amplitude oscillations, Titze showed that the essence of the vertical phase difference, which allows energy to be transferred from the flowing air to the motion of the vocal folds, could be captured in a surface wave model, and he derived a formula for the phonation threshold pressure with an explicit dependence on the geometrical and biomechanical properties of the vocal folds. The formula inspired a series of experiments [e.g., R. Chan and I. Titze, J. Acoust. Soc. Am 119, 2351–2362 (2006)]. Although the experiments support many aspects of Titze’s formula, including a linear dependence on the glottal half-width, the behavior of the experiments at the smallest values of this parameter is not consistent with the formula. It is shown that a key element for removing this discrepancy lies in a careful examination of the properties of the entrance loss coefficient. In particular, measurements of the entrance loss coefficient at small widths done with a physical model of the glottis (M5) show that this coefficient varies inversely with the glottal width. A numerical solution of the time-dependent equations of the surface wave model shows that adding a supraglottal vocal tract lowers the phonation threshold pressure by an amount approximately consistent with Chan and Titze’s experiments.
INTRODUCTION
In their classic papers, Ishizaka, Matsudaira, and Flanagan1, 2 developed a two-mass model of vocal fold motion that presented a natural framework for describing how a phase difference between the bottom and top edges of the medial surface of the vocal fold played a key role in the transfer of energy from the glottal airflow to the motion of the vocal folds. If this airflow is sufficient, then the energy transferred from the airflow to the vocal folds is adequate to overcome the energy loss due to dissipative forces acting within the vocal folds, and the oscillation can be sustained. The lowest lung pressure at which this self-oscillation can be achieved is the phonation threshold pressure, a focus of many theoretical and experimental investigations. Titze3 realized that the essence of the energy transfer mechanism could be captured in a mucosal surface wave provided that the wave originated near the bottom of the medial surface of the vocal folds and propagated to the top edge. He presented qualitative arguments to show that such wave motion would lead to larger intraglottal pressures when the glottis was opening than when it was closing. Thus positive work would be done during the glottal cycle, and the kinetic energy of the vocal folds would be increased until the vocal folds reached a state of balance where the energy input and the energy dissipated were equal, a limit cycle. With the appropriate set of assumptions about the aerodynamics of the larynx and by focusing on the behavior of the surface wave near threshold, where one would expect the oscillations of the vocal fold to have a small amplitude, Titze derived a formula3 for the phonation threshold pressure Pth, that is,
| (1) |
where kt is the transglottal pressure coefficient4, 5, 6, B is the damping factor for motion of the vocal fold, c is the speed of the mucosal wave, Lg is the glottal length (anterior-posterior direction), T is the glottal thickness (inferior-superior direction), ξ01 is the prephonatory inferior glottal half-width, and ξ02 is the prephonatory superior glottal half-width. The surface wave model produces two simplifications over the two-mass model of Ishizaka, Matsudaira, and Flanagan: (1) its results for threshold pressure can be summarized in an analytic formula, where the dependence on the geometrical and biomechanical parameters of the larynx is made explicit. (2) Its description of the mechanical properties of the vocal folds requires only four parameters, the mass of the oscillating cover of the vocal fold, the effective stiffness of the cover of the vocal fold, and the quantities B and c in Eq. 1, instead of the seven or more parameters required for the two-mass model.
In the 1990s, Titze and his colleagues designed a physical model of the vocal fold cover with the express purpose of testing the relationships embodied in the phonation threshold formula of Eq. 1. Their apparatus included a micrometer screw for adjusting the glottal half-width and a thin silicone membrane under which fluids of different viscosities could be circulated.7 It was also possible to tilt the vocal fold assembly to examine the threshold pressure for diverging and converging angles.8 For the rectangular glottis, ξ01 = ξ02 = ξ0, and hence Eq. 1 predicts a linear increase with the glottal half-width. The linear increase of Pth with ξ0 was consistent with a number of measurements, and increasing the viscosity of the fluid did lead to an increase in the threshold pressure.7 Further, increasing the glottal thickness from 0.7 to 1.1 cm also led to an inverse dependence on T consistent with Eq. 1 in several cases.8
However, the prediction of Eq. 1 that the threshold pressure for diverging prephonatory angles should be lower than for converging angles was not supported by the experiments.8
Chan and Titze9 modified the vocal fold assembly so that biomaterials, such as hyaluronic acid (HA), fibronectin (FN), and human adipose tissue, could be implanted under the silicone membrane, and they added a supraglottal vocal tract 16.51 cm long to some of their experiments. The purpose of the latter addition was to see if vocal tract inertance lowered the phonation threshold pressure in accord with their derivation of its effects, which produced an additional term in Eq. 1 with a minus sign.
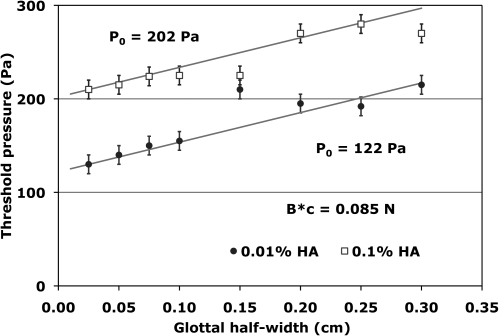
However, the phonation onset data9 of Fig. 1 point to an obvious problem with the formula of Eq. 1; the linear trend of the data does not approach zero as the glottal half-width becomes very small. Moreover, none of the other threshold pressure measurements reported in Chan and Titze’s paper are consistent with the behavior required by Eq. 1 in this limit, nor are any of the data reported in the earlier experiments7 consistent with the zero limit at small glottal half-widths. Instead the measured threshold pressures for these experiments increased as the glottal half-width decreased. Faced with this difference between the predictions of the surface wave model and their experiments, Titze, Schmidt, and Titze7 suggested that the oscillating silicone membrane may have collided with the opposing wall at very small glottal half-widths, and hence an additional dissipative mechanism would come into play. This would mean that the assumptions underlying Eq. 1 would no longer pertain.
Figure 1.
(Color online) Phonation threshold pressure (onset) as a function of glottal half-width. The hyaluronic acid data are from Chan and Titze.9 The error bars (± 10 Pa) were added to the data to consider the accuracy of the pressure resolution of the water manometer used by Chan and Titze. The solid lines are based on the formula of Eq. 17.
Lucero10, 11 pursued a different approach to the small glottal-width discrepancy; he conjectured that its origin lay in the neglect of viscous effects within the glottis. Assuming that the velocity profile within the glottis was fully developed, he used the Poiseuille formula to consider viscous effects within the glottis.1, 2, 12 His calculations indicated that viscosity would give an upward trend for small glottal half-widths, consistent with the experiments of Titze, Schmidt, and Titze. However, we show in the following text that Lucero’s formalism does not give results consistent with the 2006 experiments of Chan and Titze. Because these experiments are more sensitive to the behavior of phonation threshold pressure at smaller glottal widths, it is likely that the Poiseuille formula, with its characteristic inverse cube dependence on the diameter, exaggerates the effects of viscosity at small glottal widths.
In deriving Eq. 1, Titze assumed that the transglottal pressure coefficient kt is equal to the difference between the entrance loss coefficient and the exit coefficient and that all of these quantities are constant. In Sec. 2 in the following text, it will be shown that Titze’s assumption is reasonable for intermediate and larger glottal widths but that measurements13, 14 of the entrance loss coefficient at small glottal widths show a strong inverse dependence on these widths. To include this physical effect in the surface wave model, one must include an inverse ξ0 term in the expression for the entrance loss coefficient as well as a constant term. This form for the entrance loss coefficient will give a phonation threshold pressure that includes a constant term as well as a term that increases linearly with ξ0. The freedom inherent in these two terms will allow us to remove the discrepancy discussed in connection with Fig. 1 in the preceding text and should allow one to obtain reasonable fits for all of the data recorded in Chan and Titze. The result of including this complication in the expressions for phonation threshold pressure in the following text is to increase the number of parameters to be determined from experiment by one in keeping with the principle of parsimony of parameters described in the preceding text as one of the accomplishments of the surface wave model. It will also become clear in the following text that introducing the constant term that will remove a discrepancy noted by Chan and Titze9 in the discussion section of their 2006 paper, “… the slope of the dependence of Pth on ξ0… did not agree exactly with the empirical data, leaving Pth underpredicted at small values of ξ0 and overpredicted at large ξ0.”
THE SURFACE WAVE MODEL REVISITED
Pressures within and near the glottis
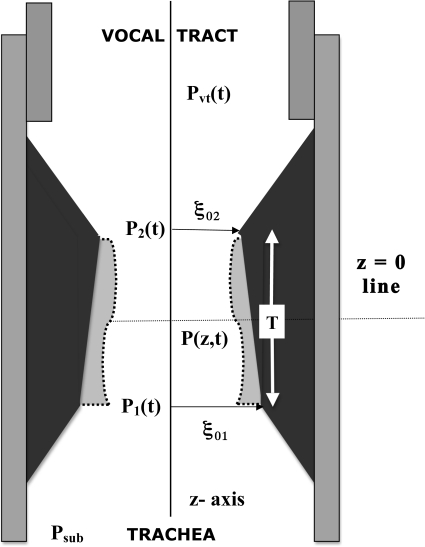
A schematic diagram of the trachea, the larynx, and the supraglottal vocal tract is shown in Fig. 2. The pressure at the glottal entrance P1 is related to the subglottal pressure Psub by
| (2) |
In Eq. 2, ρ is the density9 of air (0.00114 g∕cm3), Ug is the glottal flow rate or volume velocity, A1 is the area at the glottal entrance, and kent is the entrance loss coefficient.2, 12, 13, 14, 15 The pressure within the glottis at point z is connected with the pressure at the glottal entrance and the pressure at the glottal exit P2 by the Bernoulli equation,
| (3) |
where A2 is the area of the glottal exit. The pressure at the glottal exit is related to atmospheric pressure Patm (taken to be zero) by the effect of pressure recovery and also related to the pressure necessary to accelerate the air in the vocal tract. This inertia effect is given by the product of the inertance I of the vocal tract and the time derivative of the glottal flow rate,2, 3 and hence
| (4) |
where kex is the glottal exit coefficient. Chan and Titze9 showed that the inertance associated with the vocal tract was substantially larger than any other inertance in their experiment. Hence it is the only inertia effect included in the present work. Adding Eqs. 2 to 4 leads to a differential equation that determines the glottal flow rate from the subglottal pressure, the inertance of the vocal tract, and the areas at the glottal entrance and the glottal exit:
| (5) |
Figure 2.
Schematic diagram of the trachea, the larynx, and the vocal tract in the surface wave model. The displacement of the vocal fold cover is outlined with the dotted line.
Vocal fold dynamics
The dynamics of the vocal fold cover, as derived by Titze,3 includes a driving term that considers the average Pg of the intraglottal pressure over the medial surface of the vocal fold cover, and the equation of motion for the displacement ξ(t) of the center of mass of the cover takes the form,
| (6) |
where M is the mass of the oscillating vocal fold, B is the damping parameter identified in Eq. 1, and K is a measure of the stiffness of the oscillator. To make further progress with the surface wave model, one needs to connect the time dependence of the entrance and the exit areas with the coordinates of the moving vocal fold cover and its time derivatives. To accomplish this, Titze3 separated the vocal fold cover displacement into two parts, one describing the prephonatory shape of the glottis ξp(z), and the other describing the time dependence of the oscillating vocal fold surface ξ1(z, t). Thus
| (7) |
and his choice for the prephonatory shape was a trapezoid, which required that
| (8) |
Because ξ1(z, t) satisfies a wave equation, its dependence on the independent variables z and t is through the combination t-z∕c, and Titze3 assumed that the phase differences along the medial surface of the vocal fold were small enough so that one could carry out a power series expansion, that is,
| (9) |
where ξ(t) = ξ1(0, t) is the coordinate of the center of the vocal fold cover, and (t) is its time derivative. Then the area A(z) in Eq. 3 is a linear function of z, and the integral on the right side of Eq. 6 is readily evaluated. Thus the expression for the driving pressure can be put in the convenient form,
| (10) |
Because of the power series expansion of Eq. 9, the areas appearing in Eq. 10 may be expressed in terms of geometrical factors, the displacement of the center of the vocal fold cover, and its time derivative, that is,
| (11) |
where the time τ = T∕(2c) is the time for the surface wave to propagate from the center of the medial surface of the vocal fold to the glottal exit. Equations 5, 6, 10, and 11 are a closed set of coupled (nonlinear) differential equations that determine the functions ξ(t) and Ug(t).
No vocal tract
Setting the vocal tract inertance equal to zero in Eq. 5 allows one to find a direct connection between the driving pressure Pg and the subglottal pressure, which takes the form,
| (12) |
Equation 12 has an interesting property; its dependence on the glottal areas is only through the ratio of A2 to A1. Thus, if one follows Titze’s assumption that kent and kex are constants,3 it expresses the same relationship between the driving pressure and the subglottal pressure regardless of whether a hemilarynx or a full larynx is involved, and it would pertain to the experiments of Refs. 7, 8, 9 regardless of which larynx was used.16, 17 Substituting Eq. 12 into the right side of Eq. 6 and using Eqs. 11 yields a self-contained nonlinear differential equation for oscillator coordinate, that is,
| (13) |
for the rectangular glottis. Following the spirit of Titze’s approach to the surface wave model,3 one assumes that the oscillations represented by ξ and its time derivative are small in comparison with the initial glottal half-width ξ0. Then the nonlinear terms of Eq. 13 may be expanded in inverse powers of ξ0, and the equation of motion takes the form,
| (14) |
if one keeps only the lowest order. Physical interpretation of the terms on the right side of Eq. 14 is straightforward. The constant term results in a displacement of the center of the vocal fold cover from its equilibrium position, and the velocity-dependent term is the negative damping effect of the fluid structure interaction, which transfers kinetic energy to the motion of the center of mass of the vocal fold. Equating the coefficient of this term to the damping constant yields an expression for the threshold pressure, that is,
| (15) |
This equation is the equivalent of Eq. 1 for the rectangular glottis; it approaches zero in the limit as ξ0 → 0 (assuming that kent and kex are constants) in contrast to the data of Fig. 1. It contains an explicit expression for the transglottal coefficient kt in terms of the entrance and exit coefficients. However, the assumption that kent and kex are constants is not required to derive Eq. 15. The implications of relaxing this assumption are explored in the next subsection. It is worth noting that no term linear in the coordinate ξ appears on the right side of Eq. 14. Consequently the angular frequency of the oscillation at threshold is not changed from (K∕M)1∕2 as the glottal half width ξ0 varies.
Behavior of the entrance loss coefficient for different glottal widths and its implications
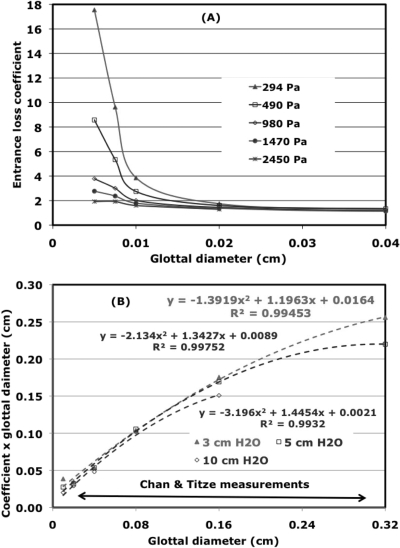
In Fig. 3A, values of the entrance loss coefficients determined from pressure distributions taken with a physical model of the symmetric rectangular glottis (M5) are shown as a function of glottal diameter (width) for a number of transglottal pressures of interest for phonation.14 The curves are based on data taken at diameters of 0.005 cm, 0.0075 cm, 0.01 cm, 0.02 cm, and 0.04 cm for each of the five transglottal pressures shown. For the lower transglottal pressures, which are of the most relevance for the study of effects near threshold, there is a strong increase in kent as the glottal width gets small, clearly demonstrating that kent is not constant in this region. The observed behavior suggests it would be reasonable to parameterize kent in this region as follows:
| (16) |
where E, F, and G are constants to be determined from experiment.18 Such a parameterization would lead one to expect a parabola to be a reasonable fit to the product of kent and the glottal diameter. Parabolic fits to this product for the three smallest transglottal pressures of Fig. 3A are shown in Fig. 3B as dashed curves for the range of diameters of most relevance for the experiments of Chan and Titze. Because the dashed curves pass through most of the values of the product of the diameter and kent calculated from the M5 measurements, it appears that the parabolic fits are reasonable. To keep the number of parameters to a minimum, G is assumed to be zero for the experiments of Chan and Titze, and thus one should try to fit their measured threshold pressures with two free parameters because the geometrical factors Lg and T in Eq. 15 are determined from the experimental setup. This assumption leads to an additional free parameter in Eq. 15. Values for the exit coefficients14 as a function of glottal diameter and transglottal pressure were also calculated from the M5 pressure distributions. These were found to be much smaller than the entrance loss coefficients. For example kex = 0.140 for ξ0 = 0.04 cm and a transglottal pressure of 274 Pa (equivalent to 3 cm of H2O). Thus the exit coefficients are set equal to zero for the calculations in the following text.
Figure 3.
(Color online) Dependence of the entrance loss coefficient on glottal diameter for a rectangular glottis (A). In (B), the entrance loss coefficients are multiplied by the glottal diameter. Transglottal pressures at which the pressure distributions were measured are also listed.
Incorporating these assumptions into Eq. 15 leads to the following expression for the threshold pressure,
| (17) |
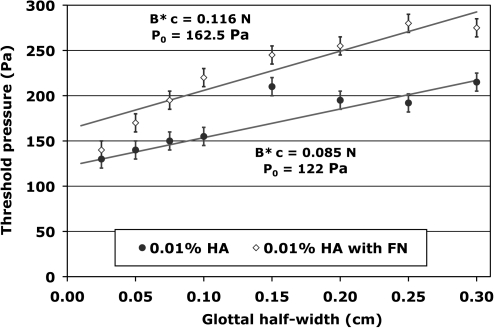
where P0 = c B E∕(LgT2) and B* = B F. Thus the two parameters to be determined from an experiment with a given biomechanical material implanted under the membrane of the apparatus constructed by Chan and Titze9 are P0 and B*c. The latter parameter measures the effective force associated with the modified damping parameter B*. The fits to the two sets of data in Fig. 1 were achieved with the B*c = 0.085 N, and the constants P0 = 122 Pa and P0 = 202 Pa (Lg = 2.22 cm and T = 1.1 cm). Linear fits to the two sets of data points in Fig. 1 did not give a larger slope for the 0.1% HA curve than for the 0.01% HA curve and consequently the product B*c was taken to be the same for both concentrations of hyaluronic acid. Thus the increased viscous forces associated with the larger concentration of hyaluronic acid manifest themselves mostly as an increase in the parameter P0.
Vocal tract
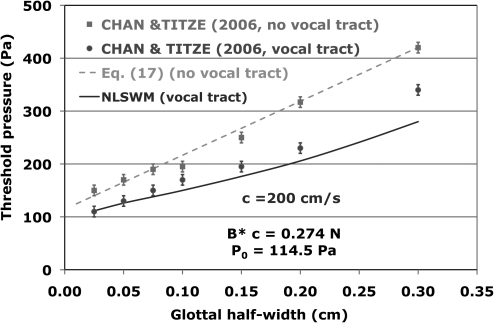
When Chan and Titze added a supraglottal vocal tract to their apparatus, they were careful to keep all of the other conditions the same as in their experiments without the vocal tract.9 Thus their data presented in Fig. 4 should give a measure of the effects of the vocal tract. Because the vocal tract inertance is determined by the density of the air, the vocal tract length Lvt = 16.51 cm, and the vocal tract area Avt = 2.82 cm2 (I = ρ Lvt∕Avt), adding a vocal tract should not introduce additional free parameters into the solution of the equations of subsections A and B in the preceding text. Thus the parameters B*c and P0 of Fig. 4 are determined from the Chan and Titze threshold pressures without the vocal tract, and these same values are used for the calculation with the vocal tract.
Figure 4.
(Color online) Phonation threshold pressure as a function of glottal half-width for experiments and calculations with and without a vocal tract.
Before addressing this question of the size of the vocal tract effects, let us consider the solution of Eq. 5 when the geometry is frozen, so that A1 and A2 are not functions of time. For the special case of a rectangular hemilarynx, where A1 = A2 = Lgξ0, the time dependence of the solution to Eq. 5 takes the form of a hyperbolic tangent function, that is,
| (18) |
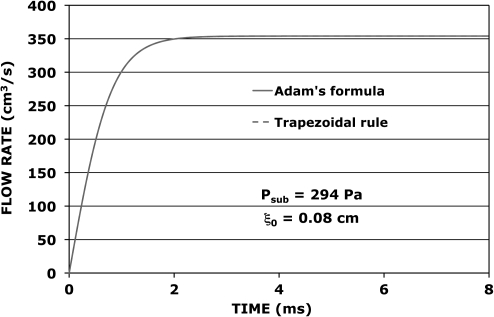
This equation affords a means of checking the method used for the numerical integration of Eq. 5. Choose Psub = 294 Pa and ξ0 = 0.08 cm, then14kent = 1.298 (and kex is assumed to be zero). Numerical solutions based on Adam’s formula and the trapezoidal rule19 are shown in Fig. 5, where the two curves are indistinguishable because they agree with each other to four or five decimal places for a time step Δ = 0.01 ms. The numerical integrations agree with the formula of Eq. 18 to a precision of three or four decimal places.
Figure 5.
(Color online). Glottal flow rate as a function of time for a rectangular hemilarynx with a fixed half-width of 0.08 cm. The two calculated curves coincide.
To solve Eqs. 5, 6, 10, and 11 numerically, values for the mass and stiffness parameters must be chosen, although these did not play a role in the threshold formula of Eq. 17. We follow the lead of Ishizaka and Flanagan2 and choose M = 0.15 g and K = 88 000 dynes∕cm, values that often have been used for numerical simulations.20, 21 The choice of B is dictated by the fit to the no-vocal-tract data of Fig. 4 and the desire to have a value for the surface wave speed comparable to that observed for mucosal waves22 (100 or 200 cm∕s). Choosing c = 200 cm∕s yields23, 24B = 100 g∕s. Because all of the parameters are now determined, the stage is set for the numerical solution of Eqs. 5, 6, 10, and the hemilarynx version of Eqs. 11. This solution produced the solid curve shown in Fig. 4, which should be compared with the vocal-tract data of Chan and Titze (2006). It is labeled NLSWM for non-linear surface wave model because the expansions in inverse powers of ξ0 [used to obtain Eq. 17] have not been carried out. The fit is good for smaller values of the glottal width and a little disappointing for the larger values. Nevertheless, to the best of our knowledge, this is the first attempt to give a quantitative account of the size of the vocal tract inertance effects in the experiments of Chan and Titze.
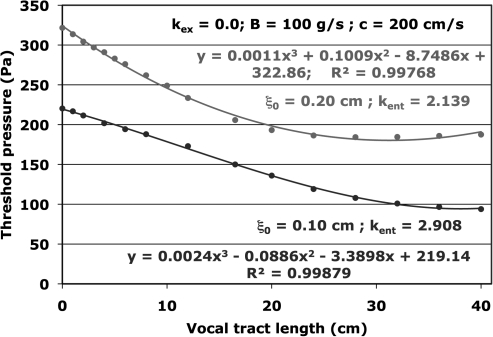
An important aspect of the consistency of our method of introducing the new free parameter in the surface wave model is addressed in Fig. 6. There the dependence of the threshold pressure as a function of vocal tract length is shown for ξ0 = 0.20 cm and ξ0 = 0.10 cm. In both cases, the curves calculated with the NLSWM smoothly approach the limit of zero vocal tract length, that is, the numerical solution25 of the zero-inertance result of Eq. 13. The smoothness of this limit is measured by the quality of the cubic polynomial fits to the set of threshold pressures calculated at the points shown in Fig. 6 (including those at zero vocal tract length). The values of kent listed in Fig. 6 are based on E = 0.1538 cm and F = 1.37, which are determined from B*c and P0 of Fig. 4. Both of the curves show that the inertance of the vocal tract lowers the phonation threshold pressure for an important physical range of vocal tract lengths in accord with Titze’s earlier predictions.3, 9 It is interesting that the approximately linear decrease of phonation threshold with increasing vocal tract inertance does not continue unabated for the larger values of vocal tract length shown in Fig. 6. It levels off, and in the case of ξ0 = 0.20 cm, there is a shallow minimum near a vocal tract length of 30 cm.
Figure 6.
(Color online) Phonation threshold pressure as a function of vocal tract length for ξ0 = 0.1 cm and ξ0 = 0.2 cm.
ADDITIONAL RESULTS
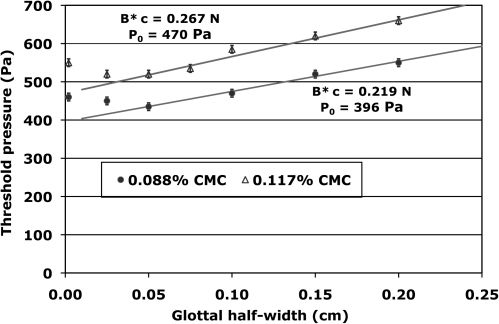
In Fig. 7 measurements of the phonation threshold pressure carried out by Titze, Schmidt, and Titze7 with two different concentrations of CMC powder are compared with calculations based on Eq. 17. The higher concentration requires larger values of the product B*c and the constant P0, consistent with an interpretation of increased viscous damping. Equation 17 readily reproduces the linear trends of the data that begin near ξ0 = 0.05 cm. The deviations of the data from linearity below 0.05 cm are those referred to in the Introduction, and the merits of two possible explanations, collisions of the vibrating membrane with the opposite wall,7 or viscosity effects based on Poiseuille flow,10 will be addressed in the next section. The behavior of the trends in Fig. 8 is similar to that of Fig. 7, except for very small ξ0, where one does not see any effects that differ from the linear trend. Adding fibronection to the hyaluronic acid implant leads to larger values for the product B*c and for the constant P0.
Figure 7.
(Color online) Phonation threshold pressure (onset) as a function of glottal half-width for viscous solutions containing sodium carboxymethyl cellulose (CMC) powder. The glottal length Lg is taken to be 2.3 cm for this calculation.7 The solid lines were determined from Eq. 17.
Figure 8.
(Color online) Phonation threshold pressure (onset) as a function of glottal half-width for 0.01% hyaluronic acid with and without fibronectin. The solid lines were determined from Eq. 17.
VISCOSITY AND POISEUILLE’S FORMULA
The calculations of Secs. 2, 3 have been based on the Bernoulli relations of Eq. 3 for the pressures within the glottis. Lucero10 explored the consequences of adding viscosity effects by supplementing Bernoulli’s equation with Poiseuille’s formula to consider viscosity within the glottis. Under his assumption that the inverse area dependence of Poiseuille’s formula is adequately considered by taking the area at the glottal midline, Lucero’s formula for the connection between the flow rate and the subglottal pressure is
| (19) |
where μ = 1.81 × 10⁻⁵ Pa s is the viscosity of air,26 and A(0) is the glottal area when z = 0. His formula for the average of the driving pressure is
| (20) |
The three areas in these equations, the volume velocity Ug, and the average pressure Pg are time dependent although this is not shown explicitly.
Lucero’s work requires two important emendations to be relevant for Chan and Titze’s 2006 experiments. First, one must use the appropriate vocal fold thickness T (1.1 cm instead of 0.3 cm) and vocal fold length Lg (2.22 cm instead of 1.4 cm) used in Chan and Titze’s model. Second, one must remember that the 2006 experiments were based on a hemilarynx rather than a full larynx. Thus the first factor in Eqs. 11 above should be Lg instead of 2 Lg [Eqs. 11, 12, 13 of Lucero’s paper must be modified]. This factor of 2 does not alter any of the results when the viscosity is neglected as explained in the text following Eq. 12 in Sec. 2C, because their derivation depends on the dimensionless area ratio A1∕A2. However, for the viscosity terms of Eqs 19, 20, the dependence on the areas does not take the form of a dimensionless factor but arises through factors such as the quotient A2∕A3(0), and thus the net effect is to modify the viscosity parts of the relevant equations by a factor of 4. After modifying Lucero’s equations to describe a hemilarynx instead of a full larynx, one can reproduce the steps that lead to Eq. 21 of his paper and thus show that the appropriate form for the square root of the threshold pressure is
| (21) |
where is the displacement of the vocal fold from equilibrium and , the damping constant per unit area, has been introduced to more closely conform to Lucero’s notation.27 This result approaches the limit of Eq. 1 for the rectangular glottis when μ = 0 and when is small in comparison with ξ0. By redoing the steps in Lucero’s paper that lead to his Eq. 17, one can also show that the displacement is related to the subglottal pressure by
| (22) |
where is the spring constant per unit area. As discussed in the preceding text, in each place where the viscosity μ appears in these equations, our results differ from Lucero’s by a factor of 4.
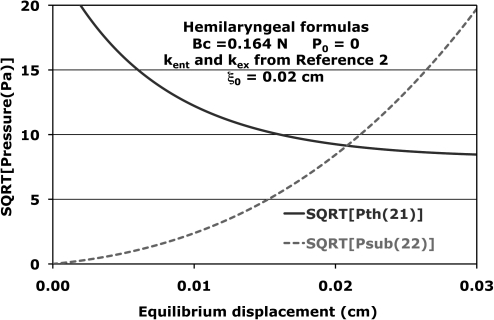
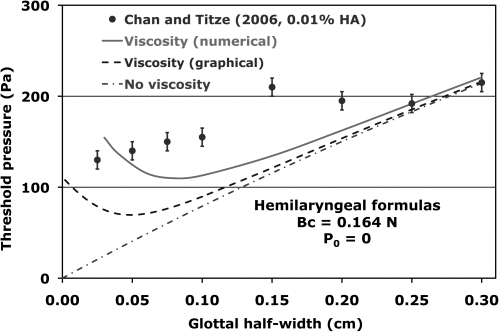
To determine the threshold pressure (Psub = Pth), one must simultaneously solve these two equations for Pth and . This is most easily done graphically after obtaining an explicit expression for Psub1∕2 from Eq. 22. The two expressions for the square roots of the pressures as functions of are shown in Fig. 9 for ξ0 = 0.02 cm. Their intersection determines values for Pth1∕2 (near 9.1 Pa1∕2) and (near 0.0208 cm) that give the simultaneous solution of Eqs. 21, 22. Carrying out this graphical procedure for a set of values of ξ0 in the interval [0.0, 0.30 cm] leads to the dashed curve shown in Fig. 10. The value of the product B c is chosen to fit the threshold pressure observed by Chan and Titze at ξ0 = 0.3 cm, and the constant P0 is taken to be zero. This curve is obtained by the same procedure Lucero10 used to obtain curve 2 in his Fig. 3. For comparison, the result obtained from Eq. 21 in the limit of no viscosity is also shown. The transglottal coefficient kt is this calculation is taken to be the difference of kent and kex, and those are taken from Ishizaka and Flanagan2 [kent = 1.37, and kex = , where = 6.0 cm2, the area of a small region above the glottal exit in the experiment of Chan and Titze when the vocal tract is not included] for Fig. 10.
Figure 9.
(Color online) Dependence of the square roots of the pressures in Eqs. 21, 22 on the equilibrium displacement .
Figure 10.
(Color online) Comparison of calculated phonation pressure thresholds that include the Poiseuille formula for viscosity with the 0.01% hyaluronic acid data (onset) of Chan and Titze when P0 is taken to be zero [constant E = 0 in Eq. 16].
Although the procedure used in the preceding text to obtain the dashed curve of Fig. 10 is a useful guide to examine viscosity effects for small glottal widths, it is not an accurate representation of these effects at small glottal widths. The reason for this is that Lucero’s approximate treatment of glottal flow has been followed; that is, to obtain the analytic result of Eq. 21, one must neglect the viscosity term in the relationship between the volume velocity and the subglottal pressure in Eq. 19. If this approximation is not made, then Eq. 19 may be used to find an exact expression for the volume velocity, which is given by,
| (23) |
where the time dependence has been made explicit. Equations 6, 20, 23 and the hemilarynx versions of Eq. 11 thus become a closed set of equations that can be solved numerically for ξ(t) and Ug(t), and they can be used to find accurate values for the threshold pressure at various values of the glottal width ξ0. Results based on this numerical solution are shown by the solid line of Fig. 10. The procedure used to find this curve is equivalent to that used by Lucero to find curve 1 in Fig. 3 of his paper. All curves in Fig. 10 are based on B c = 0.164 N.
Two weaknesses of the calculations based on the Poiseuille formula are apparent in Fig. 10. First the slopes of the calculated curves when ξ0 = 0.10 cm or greater are steeper than the linear trend of the 0.01% hyaluronic acid data. This slope mismatch is the same that occurred in Fig. 10 of Chan and Titze’s paper, and it is what prompted their observation quoted near the end of the Introduction. The second weakness is that the curves based on the Poiseuille formula exhibit an upward trend at small glottal widths that clearly is not expressed in the data. Moreover, none of the data in Chan and Titze’s 2006 paper exhibit this upward trend. It is this lack of agreement at small glottal widths that leads us to conclude that surface wave model calculations that include Poiseuille’s formula are not compatible with the data of Chan and Titze (2006). It is worth noting that the trend of the Poiseuille-based calculations of Fig. 10 does seem to be consistent with the upward trend of the data in Fig. 7, which was taken from the earlier work of Titze, Schmidt, and Titze. Figures 2345 of that work have this upward trend, which motivated Lucero’s papers. However, in view of how the Poiseuille-based calculations compare with Chan and Titze’s measurements, it seems that collisions with the opposing wall are a more likely explanation of the upward trends in the 1995 paper of Titze, Schmidt, and Titze than Poiseuille-based effects.
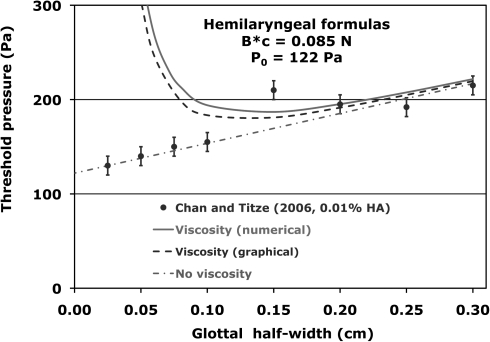
The constant P0 was taken to be zero in the calculations of Figs. 910 because such a constant was not part of Lucero’s original work. In Sec. 2D in the preceding text, arguments were presented to show that the constant P0 should be a part of a more realistic treatment of the fluid surface interaction, and hence in some sense, it is a missing piece of the surface wave model. Calculations based on nonzero P0 are presented in Fig. 11 and compared with the 0.01% hyaluronic acid data of Chan and Titze. There the transglottal coefficient kt is taken to be the entrance loss coefficient kent of Eq. 16 because kex is set equal to zero. As was the case in Sec. 2, introducing a nonzero value for P0 allows one to choose a smaller value for the product Bc, which serves to make the slope of the calculated curves in the large ξ0 region consistent with the linear trend of the hyaluronic acid data. However, the problem of the upward trend at small ξ0 persists for both the graphical and the numerical solutions, and the calculations summarized in Fig. 11 also support our claim that Poiseuille-based calculations are not consistent with Chan and Titze’s data. Thus the discrepancy between the Poiseuille-based calculation and the 2006 data of Chan and Titze claim implies that the flow in the narrow channels represented by the small glottal widths is not fully developed into a parabolic distribution, which is required for the derivation of the Poiseuille formula.
Figure 11.
(Color online) Comparison of calculated phonation pressure thresholds that include the Poiseuille formula for viscosity with the 0.01% hyaluronic acid data (onset) of Chan and Titze when the constants E (0.5283 cm) and F (1.37) are taken from the hyaluronic acid data.
CONCLUSIONS
The assumptions underlying the surface wave model have been re-examined to see what modifications are necessary to remove a discrepancy between the threshold pressure formula [Eq. 1] derived by Titze3 in 1988 and experiments with physical models of the vocal fold mucosa7, 8, 9 that he and his colleagues carried out in the 1990s and 2006, namely, that the observed threshold pressure did not approach zero as the glottal width became very small. This discrepancy was removed by a careful re-examination of the properties of the entrance loss coefficient and its implications for the phonation threshold pressure. It was shown that the derivations of the surface wave model did not require the entrance loss coefficient to be constant as assumed in Titze’s original work. Moreover, it was shown in Fig. 3 that the entrance loss coefficients calculated directly from M5 pressure distribution data became large at small glottal widths and that the variation of these coefficients at small widths was consistent with an inverse dependence of the glottal width. The implication of this interpretation of the data of Fig. 3 is that one should expect the product ξ0kent of Eq. 15 to be a constant as ξ0 approaches zero, and thus the threshold pressure should not approach zero in this limit. A new parameterization of the surface wave model, which was consistent with these observations, was introduced in Eqs. 16, 17. The new parameterization was shown to require the determination of two constants, Bc and P0, for each of the experiments reported by Chan and Titze. The freedom of the additional parameter removes the discrepancy between the linear trend of the data and the measured threshold pressures. It was also shown (Fig. 4) that including the inertance effects of the vocal tract used in some of the experiments of Chan and Titze gave a reasonable account of the observed differences in threshold pressure when a vocal tract was added.
Lucero’s use of the Poiseuille formula to consider viscous effects at small glottal widths was examined. His formulas were adapted to the hemilaryngeal configurations used in the 1995 experiments of Titze, Schmidt, and Titze and the 2006 experiments of Chan and Titze. The Poiseuille-based approach was shown possibly to be consistent with the 1995 experiments but not with the 2006 experiments. Because the latter experiments are more recent, and they represent a larger threshold pressure data set near ξ0 = 0.1 cm and smaller, one would assume that they give a more accurate picture of the behavior of the threshold pressure of physical models of the vocal fold mucosa at small glottal widths and thus that the Poiseuille-based calculations exaggerate the effect of viscosity at small glottal widths. A consequence of this assertion is that collisions of the silicone membrane with the opposing wall are a more likely explanation of the upturns in the 1995 data at small glottal half-widths than the Poiseuille effect.
ACKNOWLEDGMENTS
The authors gratefully acknowledge support of this project by NIH R01DC03577. A conversation with Roger Chan is also gratefully acknowledged.
References
- Ishizaka K. and Matsudaira M., “Fluid mechanical consideration of vocal cord vibration,” Speech Communication Research Laboratory Monograph, No. 8., Santa Barbara, CA, 1–75 (1972). [Google Scholar]
- Ishizaka K. and Flanagan J., “Synthesis of voiced sounds from a two mass model of the vocal cords,” Bell Sys. Tech. J. 52, 1233–1268 (1972). [Google Scholar]
- Titze I., “The physics of small amplitude oscillation of the vocal folds,” J. Acoust. Soc. Am. 83, 1536–1552 (1988). 10.1121/1.395910 [DOI] [PubMed] [Google Scholar]
- Scherer R. and Guo C., “Laryngeal modeling: translaryngeal pressure for a model with many laryngeal shapes,” in ICSLP Proceedings, 1990 International Conference on Spoken Language Processing (The Acoustical Society of Japan; ), vol. 1, pp. 3.1.1–3.1.4.
- Scherer R. and Guo C., “Generalized translaryngeal pressure coefficient for a wide range of laryngeal configurations,” in Vocal Fold Physiology: Acoustical, Perceptual, and Physiological Aspects of Voice Mechanisms, edited by J, Gauffin and Hammarberg B. (Singular, San Diego, 1991), pp. 83–90. [Google Scholar]
- Fulcher L., Scherer R., Zhai G., and Zhu Z., “Analytic representation of volume flow as a function of geometry and pressure in a static physical model of the glottis,” J. Voice 24, 489–512 (2006). 10.1016/j.jvoice.2005.07.006 [DOI] [PubMed] [Google Scholar]
- Titze I., Schmidt S., and Titze M., “Phonation threshold pressure in a physical model of the vocal fold mucosa,” J. Acoust. Soc. Am. 97, 3080–3084 (1995). 10.1121/1.411870 [DOI] [PubMed] [Google Scholar]
- Chan R., Titze I., and Titze M., “Further studies of phonation threshold pressure in a physical model of the vocal fold mucosa,” J. Acoust. Soc. Am. 101, 3722–3727 (1997). 10.1121/1.418331 [DOI] [PubMed] [Google Scholar]
- Chan R. and Titze I., “Dependence of phonation threshold pressure on vocal tract acoustics and vocal fold tissue mechanics,” J. Acoust. Soc. Am. 119, 2351–2362 (2006). 10.1121/1.2173516 [DOI] [PubMed] [Google Scholar]
- Lucero J., “Relation between the phonation threshold pressure and the prephonatory glottal width in a rectangular glottis,” J. Acoust. Soc. Am. 100, 2551–2554 (1996). 10.1121/1.417365 [DOI] [PubMed] [Google Scholar]
- Lucero J., “Optimal glottal configuration for ease of phonation,” J. Voice 12, 151–158 (1998). 10.1016/S0892-1997(98)80034-9 [DOI] [PubMed] [Google Scholar]
- van den Berg J., Zantema J. T., and Doornenbal P., “On the air resistance and the Bernoulli effect of the human larynx,” J. Acoust. Soc. Am. 29, 626–631 (1957). 10.1121/1.1908987 [DOI] [Google Scholar]
- Fulcher L. and Scherer R., “Intraglottal pressures in a static physical model of the uniform glottis: Entrance loss coefficients and viscous effects,” J. Acoust. Soc. Am. 122, 3019 (2007). 10.1121/1.2942789 [DOI] [Google Scholar]
- Fulcher L., Scherer R., and Powell T., “Pressure distributions in a static physical model of the uniform glottis: Entrance and exit coefficients,” J. Acoust. Soc. Am. 129, 1548–1553 (2011). 10.1121/1.3514424 [DOI] [PMC free article] [PubMed] [Google Scholar]
- Street R., Watters G., and Vennard J., Elementary Fluid Mechanics, seventh edition (Wiley, New York, 1996), pp. 291–322. [Google Scholar]
- Jiang J. and Titze I., “A methodological study of hemilaryngeal phonation,” Laryngoscope 103, 872–882 (1993). 10.1288/00005537-199308000-00008 [DOI] [PubMed] [Google Scholar]
- Fulcher L., Scherer R., De Witt K., Thapa P., Bo Y., and Kucinschi B., “Pressure distributions in a static physical model of the hemilarynx: measurements and computations,” J. Voice 24, 2–20 (2010). 10.1016/j.jvoice.2008.02.005 [DOI] [PMC free article] [PubMed] [Google Scholar]
- The coefficients listed in Tables I and II of Ref. 14 were calculated from pressure distributions taken with a symmetric physical model of the larynx. Thus they are displayed in Fig. 3 as functions of the glottal diameter or glottal width. The factor-two difference between the glottal width and the glottal half-width is readily absorbed in the constants E and G. The half-width is the appropriate variable for the expansion of Eq. (16) because the constants there will be fit to the hemilarynx experiments of Chan and Titze.
- Abramowitz M. and Stegun I., Handbook of Mathematical Functions, (National Bureau of Standards, Applied Mathematics Series, 1970), pp. 896. [Google Scholar]
- Steinecke I., and Herzel H., “Bifurcations in an asymmetric vocal fold model,” J. Acoust. Soc. Am. 97, 1874–1884 (1995). 10.1121/1.412061 [DOI] [PubMed] [Google Scholar]
- Tokuda I., Horacek J., Svec J., and Herzel H., “Comparison of biomechanical modeling of register transitions and voice instabilities with excised larynx experiments,” J. Acoust. Soc. Am. 122, 519–531 (2007). 10.1121/1.2741210 [DOI] [PubMed] [Google Scholar]
- Titze I., Jiang J., and Hsiao T., “Measurement of mucosal wave propagation and vertical phase difference in vocal fold vibration,” Ann. Otol. Rhinol. Laryngol. 102, 58–63 (1993). [DOI] [PubMed] [Google Scholar]
- Story B. and Titze I., “Voice simulation with a body-cover model of the vocal folds,” J. Acoust. Soc. Am. 97, 1249–1260 (1995). 10.1121/1.412234 [DOI] [PubMed] [Google Scholar]
- This value is several times larger than that used in Ref. 21, and about twice as large as that used in Ref. 23. Nevertheless, it is not outside of the range of values that Ishizaka and Flanagan2 found to give reasonable simulations of the behavior of the vocal folds with their two-mass model.
- The numerical solution of Eq. (13), which includes nonlinear corrections to Eq. (17), is the correct result for comparison of the zero-inertance limit of the NLSWM becuse the expansion in inverse powers of ξ0 has not been used to obtain the equations underlying the NLSWM.
- Street R., Watters G., and Vennard J., Elementary Fluid Mechanics, 7th ed. (Wiley, New York, 1996), pp. 690. [Google Scholar]
- In Eq. (21), two typographical errors (location of kt) have been corrected.


