Abstract
The contact pressure on the vocal fold surface during high pitch or amplitude voice production is believed to be one major source of phonotrauma. Models for the quantitative estimate of the contact pressure may be valuable for prevention and treatment. Various indirect and minimally invasive approaches have been purported to estimate contact pressure. But the accuracy of these methods has not yet been objectively verified in controlled laboratory settings. In the present study, two indirect approaches for the estimation of the contact pressure were investigated. One is based on a Hertzian impact model, and the other on a finite element model. A probe microphone was used for direct measurements of the contact pressure and verifications of the indirect approaches. A silicone replica of human vocal folds was used as a test bed. Consistent contact pressure estimations were obtained using all three methods. The advantages and disadvantages of each approach for eventual clinical applications are described.
INTRODUCTION
Excessive mechanical stresses during phonation are generally believed to be one dominant source of phonotrauma (Titze, 1994). In particular, the contact pressure exerted on the medial surface of the vocal folds during collision is often considered the most likely source of trauma. The basement membrane zone connecting the epithelium and the underlying lamina propria appears to be very sensitive to repeated impacts (Gray et al., 1987; Gray and Titze, 1988; Gray et al., 1995). The contact pressure was measured in conjunction with the aerodynamic pressure as a function of prephonatory configurations within one excised canine hemilarynx by Jiang and Titze (1994). The peak contact pressure was reported to be approximately 0.5–5.0 kPa near the center of the vocal fold. A linear relation between contact pressure and vibration amplitude was reported in the same study. Several researchers have explored the possible correlation between contact pressure and the electroglottography (EGG) closed quotient (CQ) using both excised canine larynges and human subjects (Verdolini et al., 1998; Verdolini et al., 1999). The EGG CQ, defined as the ratio of the time period for which the glottis is closed and the oscillation period, was assumed to be consistent for the same voice type and speaker. Despite the fact that no absolute magnitudes were obtained and no verifications were made, the results supported the usefulness of EGG CQ as a noninvasive indicator of relative contact pressure within individual subjects (Verdolini et al., 1998; Verdolini et al., 1999). To obtain quantitative data, a piezoresistive transducer was guided with an endoscope to measure vocal fold contact pressures in human subjects (Hess et al., 1998; Verdolini et al., 1999). The contact pressures measured were found to vary between 0.4 and 3.2 kPa. Photoglottography (PGG) was found to be correlated with contact pressure during vocal fold vibrations for complete excised canine larynges (Jiang et al., 2001). The PGG signal could predict relative contact pressures within subjects. However, the relation between PGG and contact pressure was subject-specific and could not be used to predict the absolute pressure amplitude. So far, sensor and tether size, sensitivity, and other limitations have hampered the accurate measurement of the detailed stress and strain distribution over the entire vocal fold surface with a high spatial resolution.
Computational models based on continuum mechanics have been used to obtain quantified data of vocal fold deformation. The trajectories of nodes along the medial and the superior surfaces of a computational model based on the finite element method (FEM) were found to be elliptical, with a peak displacement excursion of 4 mm (Alipour et al., 2000). Gunter (2003) used a three-dimensional FEM model based on simplified loading conditions to estimate the contact pressure during vocal fold collision. Mechanical stress predictions using the same FEM model supported the hypothesis that benign vocal fold pathologies, such as polyps and nodules, are reactions to mechanical stresses (Gunter 2004). Fluid–structure interactions were not considered in the model to reduce computing costs. Tao et al. (2006) used a three-dimensional FEM model to compute the intraglottal pressure, assuming symmetry about the midline of the vocal folds. Variations in both air flow pressure and contact pressure may contribute to the intraglottal pressure. It was found that the maximum contact pressure is very sensitive to the vocal fold geometry. The contact pressure around the center of the medial surface was found to be as high as 6 kPa for a subglottal pressure of 2.5 kPa. The same FEM model was also used to investigate the anterior–posterior biphonation phenomenon, i.e., vocal fold vibrations caused by asymmetry in the stiffness and shape of the vocal folds structures along the anterior–posterior direction (Tao and Jiang, 2006). So far, FEM-based models have provided abundant vocal fold deformation data with a high temporal and spatial resolution. But the accuracy of contact pressures estimated using FEM models has not yet been verified through comparisons with direct measurements due to difficulties in obtaining direct measurements in human subjects.
High-speed videoendoscopy is widely used to examine vocal fold oscillations (Wittenberg et al., 1995). The oscillation amplitude of the vocal folds may be estimated through the postprocessing of digital image data. Jiang and Titze (1993) followed this approach to compare the flow-induced response of hemilarynges and full larynges. Comparable vibration amplitudes and fundamental frequencies were found over a range of subglottal pressures. Strain data at discrete locations on the vocal fold medial surface were obtained for a hemilarynx with suture markers using a high-speed camera (Berry et al., 2001; Doellinger and Berry, 2006). A cubic relation between vocal fold contact pressure and glottal width was found using excised canine larynges. The peak contact pressure amplitude varied between 1 and 2 kPa, as a function of the subglottal pressure (Berry et al., 2001).
The digital image correlation (DIC) method allows the determination of the continuous displacement field on the visible surface of a deformable solid. This approach requires the application of a speckle pattern on the surface of interest (Sutton et al., 1986). Mantha et al. (2005a,b) applied DIC to obtain full displacement and strain fields on the superior surface of the physical model proposed in Thomson et al. (2005). Berry et al. (2006) applied DIC to obtain medial surface deformation data using a hemilarynx setup to study mechanisms of irregular vocal fold vibrations. Spencer (2007) obtained the stress and strain fields on the superior surface of a physical model of the vocal folds using DIC. Based on superior surface deformation data, the contact pressure on the medial surface of vocal folds was estimated using a Hertzian impact model. But no verification through direct measurements was attempted.
For minimal interference with vocal fold oscillations, indirect contact pressure estimations using a FEM model and a Hertzian impact model based on superior surface deformation data were found to be potential alternatives to direct measurements using a necessarily intrusive contact pressure sensor. Estimations based on a FEM model provide detailed contact pressure data with high spatial and temporal resolutions, at the expense of high computing costs. The accuracy of the estimation largely depends on the fidelity of the vocal fold model. Estimations from superior surface deformation data based on a Hertzian impact model are possible. But the computation of the contact pressure at every node location to obtain a spatial distribution would require large computational efforts. The temporal resolution is limited to the camera frame rate. Method selection is a trade-off between the level of detail and the cost of the contact pressure predictions. The lack of a common base for comparison makes the selection problematic.
The first goal of the present study was to develop a probe microphone for direct contact pressure measurements in human subjects or silicone models. Signals from the probe microphone were processed using a transfer function obtained from a two-step calibration process. The pressure data were calibrated through comparisons with data from a reference microphone with a known uniform response under identical loading conditions. A second goal was to investigate the accuracy of indirect contact pressure estimations, in particular a Hertzian impact model based on superior surface deformation data, and a FEM model. A silicone replica of one human vocal fold was used as a test bed. A hemilaryngeal setup consisting of one vocal fold vibrating against a rigid contact wall was used to establish a common base for comparisons. The probe microphone developed in this study was used to directly measure contact pressures on the physical replica medial surface during phonation. Contact pressure data obtained from the probe microphone served as reference data. The approach proposed by Spencer et al. (2008) was modified to estimate contact pressures based on superior surface deformation data obtained using DIC. The analysis procedure proposed by Gunter (2003) was used to estimate the contact pressure using a tuned FEM model of the same physical replica (Chen, 2009). Estimations based on these three approaches were compared. The advantages and disadvantages of each method are discussed.
METHODS
Direct measurements using a probe microphone
Design and verification
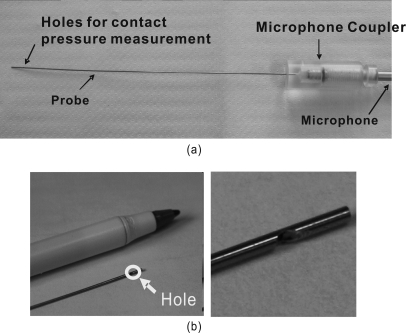
A custom-made probe microphone was designed and built. The probe microphone consisted of one Brüel & Kjær 4939 condenser microphone with a diameter of 6.35 mm, a 15-cm-long stainless steel capillary probe with an outer diameter of 0.64 mm and an inner diameter of 0.51 mm, and a microphone coupler, as shown in Fig. 1. The microphone sensitivity was 4 mV∕Pa, with a peak sound pressure of 10 kPa. The size of the probe was selected to minimize interference with the oscillations while ensuring adequate sensitivity. The open end of the probe was attached to the microphone coupler, and the closed end was positioned subglottally, upstream of the vocal fold replica. An orifice was bored through the probe sidewall, 5 mm away from the closed end. The orifice was positioned in the center of the contact region, facing the medial surface of the vocal fold replica. The orifice area was sufficiently small to ensure complete coverage and sealing within the contact patch. It was hypothesized that the air pressure within the contact area was at all time in equilibrium with the normal component of the local normal surface tractions within the vocal fold replica.
Figure 1.
(Color online) Photographs of the probe microphone. (a) The entire system and (b) magnified view of the orifice in the side wall.
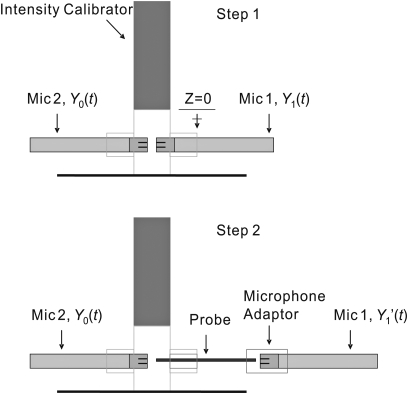
The pressure data recorded with the microphone was different from the actual pressure at the probe sidewall hole due to sound wave attenuation and acoustic standing waves in the probe. To compensate for the probe response, the transfer function, TF(f), between the signal from a known linear condenser microphone with uniform response, Y1(t), and the probe microphone output, , was determined. Figure 2 shows a schematic of the transfer function determination procedure. A Brüel & Kjær type 3541 intensity calibrator was used to generate white noise with a frequency bandwidth of 10 000 Hz. Microphone 1 was used for the probe microphone and microphone 2 was used as a common reference. The transfer function, TF1(f), between the output of microphone 1, Y1(t), and, microphone 2, Y0(t), is defined as TF1(f)=H1(f)∕H0(f), where H1(f) and H0(f) are the Fourier transforms of Y1(t) and Y0(t), respectively. Similarly, the transfer function, TF2(f), between the probe microphone output, , and microphone 2 output, Y0(t), is , where is the Fourier transforms of . Therefore, TF(f)=TF2(f)∕TF1(f). Once TF(f) was determined, the corrected pressure data, , was obtained from the measured response, , through the following relation:
| (1) |
where F[] and F−1[] are the Fourier and the inverse Fourier transform operator, respectively.
Figure 2.
(Color online) Schematic of the probe response transfer function determination.
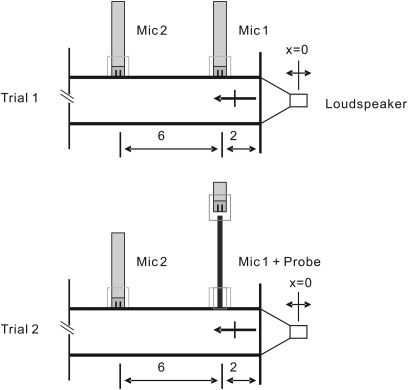
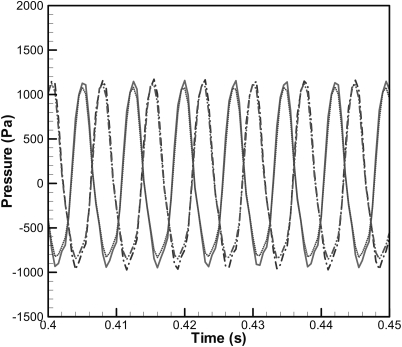
Verifications were made to establish the accuracy of the probe microphone, as illustrated in Fig. 3. In a first step, microphones 1 and 2 were mounted 2 and 8 cm away from a constant sound pressure generator, respectively. In a second step, microphone 1 was replaced by the probe microphone. Figure 4 shows the corrected response of the pressure data obtained using the probe microphone, , along with pressure data obtained using microphone 1, Y1(t). The signals from microphone 2 in the first step, Y0(t), and microphone 2 in the second step, , are also shown. The signals and Y1(t) are consistent, with a 3% difference in root mean square (rms) pressure amplitude. The discrepancy is mainly due to changes in the setup between trials, as Y0(t) and also exhibited a 3% difference in terms of rms pressure amplitude. The phase distortion introduced by the probe was compensated. The compensation was verified by comparing the phase between and Y1(t) to that between Y0(t) and Y1(t), respectively.
Figure 3.
(Color online) Schematic of the verification test using an acoustic standing wave tube. Dimension in centimeters.
Figure 4.
(Color online) Time history of the pressure recorded. Y1(t) (—); Y0(t) (···); (–·–); (–··–).
Indirect estimation using a Hertzian impact model
Description
The Hertzian impact model of Stronge (2000) was used. In Hertz’s theory, deformation outside the contact region between two bodies is negligible when the contact region remains small as compared to the size of each body. The contact pressure generates local elastic deformation and is related to the total penetration depth due to the compression. The total penetration depth through the contact plane, δp, when two deformable bodies collide is
| (2) |
where a is the equivalent radius of the contact area, Pc is the contact pressure, and E* is the effective modulus (Spencer et al., 2008). The effective modulus, E*, is defined as
| (3) |
where E1 and E2 are the Young’s modulus of the two deformable bodies, and ν1 and ν2 are Poisson ratios of the physical replica and the acrylic contact wall, respectively. In the current study, incompressibility (ν1=0.5) was assumed for the rubber material. Therefore,
| (4) |
where G1 is the shear modulus of the silicone rubber. As the Young’s modulus of acrylic is much larger than that of silicone rubbers (E2>106E1), the second term in the denominator of Eq. 3 was negligibly small. Therefore,
| (5) |
and
| (6) |
The contact length, L, is defined as the length of the superior surface edge in contact with the side wall. The contact area, A, was estimated by assuming a uniform contact length, L, across the replica’s medial surface thickness, τ, Therefore, A = Lτ. Although the actual contact area was found to be mildly elliptical, this estimate was found to be reasonably accurate with 7% error in a separate study. As the contact area was mildly elliptical, the errors introduced through the use of a circular contact area model were deemed insignificant (Greenwood, 2006). Hence, the radius of an equivalent circular contact region was obtained from
| (7) |
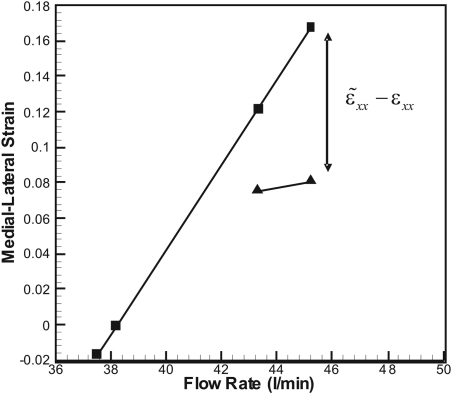
The total penetration depth was obtained through the extrapolation of the peak strain values measured for increasing flow rates, assuming that the medial-lateral strain can develop freely without the presence of the rigid wall (Spencer et al., 2008). The penetration depth was obtained using
| (8) |
where d is the depth of the vocal fold replica influenced by the contact, is the extrapolated medial-lateral strain, and ɛxx is the measured medial-lateral strain. The contact pressure may be expressed in terms of material properties, extrapolated and measured strains, and contact characteristics as
| (9) |
Experimental setup and procedures
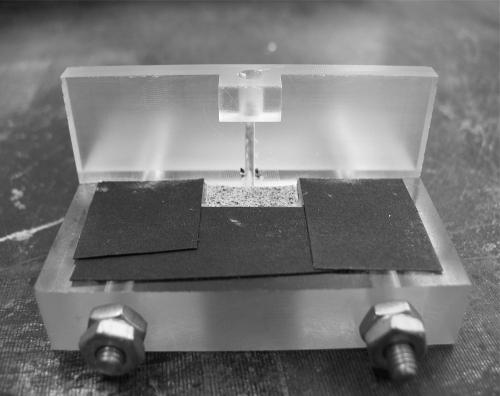
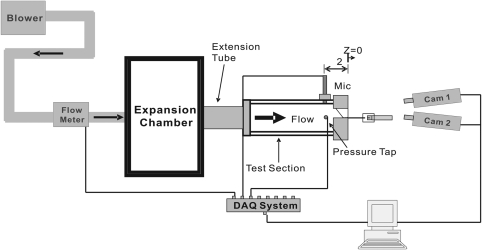
A physical replica of human vocal folds with an anterior–posterior length of 17 mm was used. The physical replica was fabricated using a three-component liquid silicone rubber solution. The three-component liquid silicone rubber solution was a mixture of Ecoflex 0030, a two-part platinum-catalyzed silicone solution, and silicone thinner, a nonreactive silicone fluid that lowers the viscosity of tin cure (condensation) and the stiffness of the resulting silicone rubber. The two parts (parts A B) of the silicone solution, Ecoflex 0030, were mixed in equal quantity. The weight of silicone thinner was three times that of each part of silicone solution. The physical replica was homogeneous and its material properties were considered to be isotropic. Details of the fabrication can be found in Chen (2009). The physical replica was used to create a hemilaryngeal model of human vocal folds. To minimize probe interference, the probe tube was recessed and mounted flush with the contact wall, as shown in Fig. 5. The location and extent of the contact region on the side wall were identified through visual observation. The hole was aligned with the center of the contact region at x = 2.9 and y = 0.59 mm, as shown in the upcoming Fig. 9. The acrylic clamp and the contact wall were assembled using bolts, and mounted on one end of a square (2.25 × 2.25 cm) duct made of acrylic plates. Figure 6 shows a schematic of the test section. A rigid expansion chamber with inner dimensions 32.38 × 22.38 × 12.38 (cm) was attached upstream of the test section. The inner walls of the expansion chamber were covered with a 3.81-cm-thick layer of melamine foam to reduce the sound wave reflection. The expansion chamber was intended to reproduce, in part, the acoustic loading due to the lung and the bronchi (Zhang et al., 2006). The equivalent subglottal tract length was 41 cm.
Figure 5.
(Color online) Photographs of hemilarynx setup consisting of the vocal fold replica and the rigid wall.
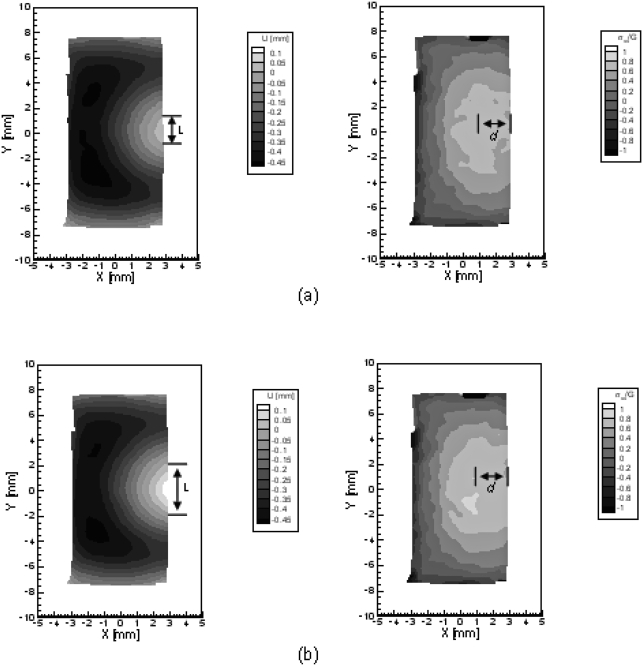
Figure 9.
Contour plots of medial-lateral displacement (left) and stress (right): (a) Q = 43.3 l∕min and (b) Q = 45.2 l∕min.
Figure 6.
(Color online) Schematic of the experimental apparatus.
The DIC method was used to measure the displacement field over the vocal fold model superior surface (Spencer et al., 2008). Digital images are represented mathematically by matrices. Each element is an integer number ranging from 0 to 255 representing the light intensity of the corresponding pixel in the digital images. Digital images are sensitive to lighting conditions, surface texture, and object deformations. Therefore, the digital images of an object are unique under specific circumstances. To obtain displacement results, the surface of the object needs to be nonreflective and have a unique pattern. To this end, the surface of the object is usually covered with dye to create an artificial speckle pattern. The digital camera is characterized by identifying its intrinsic (i.e., focal length, lens distortion, aspect ratio, and image center) and extrinsic parameters (i.e., parameters describing the overall orientation and position of the camera). Images are taken before and after the deformation using the camera. The displacement field is obtained by tracking the deformation of the speckle pattern. More details about the underlying principles can be found in previous studies (Sutton et al., 1986; Spencer et al., 2008).
Images of the superior surface motion of the vocal fold replica were obtained using two cameras with a frame rate of 15 frames∕s. The oscillation frequency of the synthetic replica was around 140 Hz. The oscillation reached a steady state following a transient period of ∼ 0.4 s. It was not possible to record more than one image in any cycle of the replica oscillation. As the motion was periodic after reaching a steady state, one complete oscillation cycle was constructed by recording images with a fixed phase lag offset from several cycles. A two-channel fiber optic goose-neck light with a quartz source (Edmund model 21 AC) was used to illuminate the superior surface of the synthetic replica. The orientation of the lights was adjusted to minimize glare. Image pairs of the vocal fold replica in undeformed and deformed configurations were obtained. A grid target (a square grid of uniformly spaced black dots with white background) positioned at various angles relative to the optical axis of the camera lens was used to determine intrinsic parameters. The extrinsic parameters were determined with two cross marks separated by a known distance on the grid target.
A Brüel & Kjær Nexus type 2690 conditioning amplifier was used to power and amplify the microphone signals. The static pressure was measured using an MKS type 220 Baratron differential capacitance manometer, and displayed using an MKS PR 4000F digital readout. The phonation frequency was computed from measured acoustic data. Air flow rate was measured using a MKS type 558A general purpose mass-flow meter. Air flow was supplied using compressed shop air with adjustable pressure. The time histories of the flow rate, Q, the subglottal static pressure, Psb, the subglottal acoustic pressure, , and the contact pressure, Pc, were collected using a NI USB-9233 DAQ system with a sampling rate of 10 000 Hz. The flow rate, Q, was increased gradually. Flow rate values were recorded after the reading stabilized (around 10 s in the current study).
Computational methods
A three-dimensional numerical model based on the physical replica was created using the commercially available FEM package, ABAQUS. The geometry of the computational model was identical to that of the physical replica. The model was assumed to be linear elastic and isotropic with a Poisson ratio of 0.499 to take into account the incompressibility of silicone rubbers. The shear modulus, G, was imposed based on data from indentation tests on small specimens (Spencer et al., 2008). The shear modulus was 2.9 kPa. The damping parameters were determined through tuning of the FEM model to reproduce measured frequency response data, as described in Chen (2009). Fixed boundary conditions were imposed on the model’s anterior, posterior, and lateral surfaces. An advancing front meshing strategy was chosen to generate elements of a uniform size and a consistent aspect ratio. A total of 91 574 10-node modified quadratic tetrahedron elements and 220 338 nodes were generated. The resulting mesh density was deemed to be nearly optimal in terms of accuracy and computing cost. A rigid contact plane was placed in parallel with the medial surface of the vocal fold replica to represent the contact wall. Fluid–structure interactions were not considered in the model to reduce computational cost. Time-varying surface pressure loads were applied on the model inferior surface to simulate fluid loading. A two-step analytical approach was followed. The first step was a static analysis, and the second step was an implicit dynamic analysis. In the first step, the inferior surface of the model was subjected to the maximum instantaneous subglottal pressure recorded during one oscillation cycle. In the second step, a dynamic pressure load, P(t), was imposed on the inferior surface. P(t) was defined as
| (10) |
where Psb and are measured subglottal static and rms acoustic pressures, respectively, and f is the oscillation frequency. This is to simulate the closing phase of one oscillation cycle from the instant of maximum orifice area until the time of maximum contact pressure. The duration of the second step was 0.01 s.
The computational cost and storage requirement to produce statistics for all points over the entire medial surface subjected to contact was found to be prohibitive. As the midpoint of the medial surface was of primary interest, the computational cost was reduced by considering only the center region of the medial surface (with a span of 9 mm, and a depth equal to the medial surface thickness). The contact plane was assumed to be frictionless; the vocal fold surface was allowed to slip along the wall. Therefore, the medial surface of the vocal fold model experienced only a normal contact force from the rigid wall.
RESULTS AND DISCUSSION
Contact pressure obtained using a probe microphone
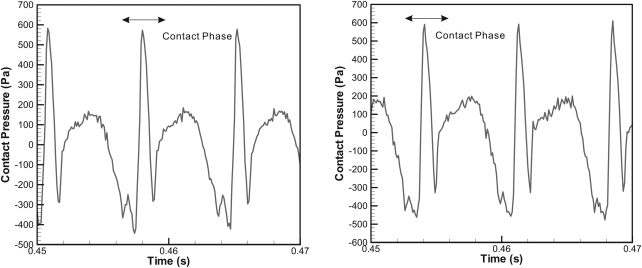
Table TABLE I. shows the results for contact pressure data comparison. Figure 7 shows a typical time history of the measured contact pressure, and Table TABLE II. shows the corresponding peak value. The pressure amplitude reached a minimum value prior to contact. For self-oscillation to occur, the pressure-driven force needs to be in phase with the vocal fold oscillation velocity, which the positive direction along the lateral direction. The acoustic pressure in the glottis is 90° out-of-phase with vocal fold displacement. The acoustic pressure is negative before the vocal fold replica displacement reaches a threshold value for collision. The negative acoustic pressure was most likely caused by a negative pressure in the airway during the noncontacting portion of the cycle. The pressure amplitude reached a maximum immediately after contact, followed by a rapid drop due to the loss of contact. The pressure recorded following the contact period was the aerodynamic pressure in the glottis, as the hole in the probe was fully exposed to the flow. The pressure amplitude reached again a minimum value before the initiation of the next contact period.
Table 1.
Data sets for contact pressure comparison.
| Data set | Flow rate Q (l∕min) | Static pressure Psb (kPa) | Acoustic pressure (kPa) |
|---|---|---|---|
| 1 | 43.3 | 2.84 | 0.50 |
| 2 | 45.2 | 2.91 | 0.54 |
Figure 7.
(Color online) Time history of the measured contact pressure for Q = 43.3 (left) and Q = 45.2 l∕min (right).
Table 2.
Contact pressure estimates.
| Methods | Flow rate Q (l∕min) | Peak contact pressure Pc (kPa) | Error (%) |
|---|---|---|---|
| Direct measurement | 43.3 | 0.59 | N∕A |
| 45.2 | 0.63 | N∕A | |
| Hertzian model | 43.3 | 0.63 | 6.6 |
| 45.2 | 0.74 | 17.5 | |
| FEM prediction | 43.3 | 0.51 | N∕A |
| 45.2 | 0.99 | N∕A |
Contact pressure estimation using a Hertzian impact model
To estimate the contact pressure, a relation between deformation data, the peak medial strain and flow rate at relatively low flow rates with no vocal fold contact involved was required. Extrapolation of the freely developing medial strain to higher flow rates yields the penetration depth (Spencer et al., 2008). Two data points prior to vocal fold contact were deemed to be sufficient as a linear strain–flow rate relation was found prior to contact (Spencer et al., 2008). Figure 8 shows the extrapolated medial-lateral and measured strains. Figure 9 shows the medial-lateral displacement and stress fields of the superior surface. Table TABLE III. shows parameter values for estimating the peak contact pressures shown in Table TABLE II..
Figure 8.
Plot of the extrapolated medial-lateral (▪) and measured strain (▴). Medial-lateral strains for Q = 43.3 and 45.2 l∕min were extrapolated using strain data for Q = 37.5 and 38.2 l∕min.
Table 3.
Parameter values for Hertzian model.
| Data set | Shear modulus G1 (kPa) | Depth d (mm) | Length L (mm) | Area A (mm2) | Radius a (mm) |
|---|---|---|---|---|---|
| 1 | 2.9 | 0.76 | 1.42 | 4.26 | 1.17 |
| 2 | 2.9 | 0.7 | 3.87 | 11.6 | 1.92 |
Contact pressure estimation using a FEM model
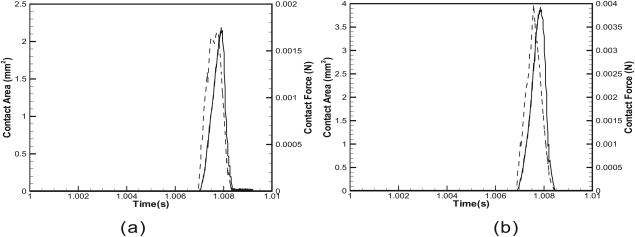
Figure 10 shows the time history of the total contact area and the contact force experienced by the medial surface. For the pressure load imposed, only the inferior one-third of the medial surface of the replica was observed to experience contact with the rigid wall. The contact experienced by the FEM model was milder than that experienced by the physical replica due to the lack of pressure loads over the model medial surface.
Figure 10.
(Color online) Time history of the total contact area (solid line) and the total contact force (dashed line): (a) Q = 43.3 l∕min and (b) Q = 45.2 l∕min.
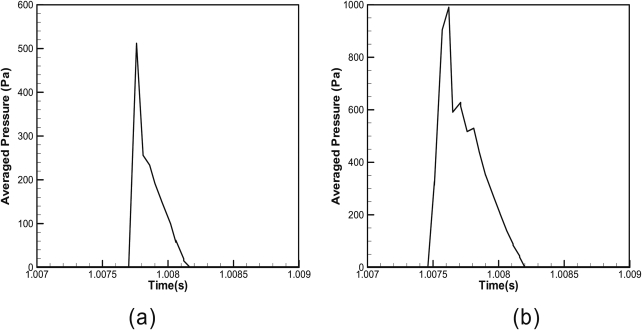
The center of the contact region in the numerical simulation was located away inferiorly from that observed in the experiments. A direct comparison between the peak contact pressure values at the contact point may be misleading. Figure 11 shows the time history of the spatially averaged contact pressure over nodes within a small contact region, where x = 2.9 mm, 0.54 mm < y < 0.59 mm, − 2.5 mm < z <− 3 mm. This region was inferior to the contact region observed in the experiments. The peak values were found to have amplitudes comparable to those obtained from previous estimations, as shown in Table TABLE II..
Figure 11.
Time history of the averaged contact pressure within a small contact region (x = 2.9 mm, 0.54 mm < y < 0.59 mm, − 2.5 < z <− 3 mm): (a) Q = 43.3 l∕min and (b) Q = 45.2 l∕min.
SUMMARY AND DISCUSSION
Comparable contact pressures were obtained using various approaches. The probe microphone may readily be adapted for use in human subjects. Recent in vivo contact pressure measurements performed by our research group using a similar probe microphone, however, revealed that the probe interfered with the subject voice. The results seemed to be extremely sensitive to probe placement. Finally the tolerance of the subjects to the presence of a probe between the vocal folds was low, which hampers its regular use in clinical settings. However, the contact pressure signals obtained using the probe microphone were found to be low noise with high temporal resolution when the probe was well positioned. More efforts are needed to reduce probe interference and to improve probe positioning method for eventual clinical applications.
The results showed that the peak contact pressure estimated based on superior surface deformation data using a Hertzian impact model may be slightly overestimated. The penetration depth, obtained through the extrapolation of the maximum freely developing medial strain values, is a key parameter to estimate contact pressure. The linear extrapolation of the medial strains based on small vocal fold oscillations did not consider the saturation of strain values at higher flow rates. This may have led to the overestimation of the freely developing strain values, and consequently an overestimation of the contact pressures (Spencer et al., 2008). The other disadvantage of this approach is that the temporal resolution of the contact pressure time history is related to the frame rate of the camera. The reconstruction of one oscillation cycle using images taken at a fixed frame rate from several cycles may have been inaccurate as the oscillation frequency was found to fluctuate by up to 0.5 Hz over time due to various factors. Only the peak contact pressure was estimated. The approach yields nevertheless a good first cut contact pressure estimate.
The FEM model did yield detailed information about the contact pressure with a high temporal and spatial resolution. The main disadvantage of this approach was the high computation cost. It took around 9 days to complete the analysis for one case using a PC equipped with two Intel Core 2 CPUs at 2.13 GHz with 4 Gbytes of RAM. Computational convergence problems were encountered when the model medial surface was subjected to both pressure loads and contact. No pressure loads were applied over the medial surface to avoid numerical convergence problems. This may have the most important factor in the discrepancy between simulation results and experimental data.
The estimation of the contact pressure using a Hertzian impact model based on superior surface deformation data has great clinical advantages over probe measurements. Interference with vocal fold oscillations due to the presence of measurement devices, such as reduction of orifice area and blockage of vocal fold movements, is avoided. There are challenges to carry this method over into the clinic. An appropriate dye to apply a speckle pattern for clinical usage is still unavailable. From clinical observations, the glare on the superior surface of the vocal folds due to the high intensity light source may limit the area allowable for performing DIC. A high intensity omnidirectional light with an appropriate size may be needed.
ACKNOWLEDGMENTS
This work was supported by Research Grant Nos. R01 DC005788 (L.M.) and R01 DC008290 (K. Verdolini, PI) from the National Institute for Deafness and Other Communication Disorders (NIH-NIDCD).
References
- Alipour, F., Berry, D. A., and Titze, I. R. (2000). “A finite-element model of vocal-fold vibration,” J. Acoust. Soc. Am. 108, 3003–3012. 10.1121/1.1324678 [DOI] [PubMed] [Google Scholar]
- Berry, D. A., Montequin, D. W., and Tayama, N. (2001). “High-speed digital imaging of the medial surface of the vocal folds,” J. Acoust. Soc. Am. 110, 2539–2547. 10.1121/1.1408947 [DOI] [PubMed] [Google Scholar]
- Berry, D. A., Zhang, Z., and Neubauer, J. (2006). “Mechanisms of irregular vibration in a physical model of the vocal folds,” J. Acoust. Soc. Am. 120, EL36–EL42. 10.1121/1.2234519 [DOI] [PubMed] [Google Scholar]
- Chen, L.-J. (2009). “Investigations of mechanical stresses within human vocal folds during phonation. Ph.D. dissertation,” School of Mechanical Engineering, Purdue University, West Lafayette, IN, pp. 71–89. [Google Scholar]
- Doellinger, M., and Berry, D. A. (2006). “Visualization and quantification of the medial surface dynamics of an excised human vocal fold during phonation,” J. Voice 20, 401–413. 10.1016/j.jvoice.2005.08.003 [DOI] [PubMed] [Google Scholar]
- Gray, S. D., Hammond, E. H., and Hanson, D. (1995). “Benign pathologic response of the larynx,” Ann. Otol., Rhinol., Laryngol. 104, 8–13. [DOI] [PubMed] [Google Scholar]
- Gray, S. D., and Titze, I. R. (1988). “Histologic investigation of hyperphonated canine vocal cords,” Ann. Otol., Rhinol., Laryngol. 97, 381–388. [DOI] [PubMed] [Google Scholar]
- Gray, S. D., Titze, I. R., and Lusk, R. P. (1987). “Electron microscopy of hyperphonated canine vocal cords,” J. Voice 1, 109–115. 10.1016/S0892-1997(87)80033-4 [DOI] [Google Scholar]
- Greenwood, J. A. (2006). “A simplified elliptic model of rough surface contact,” Wear 261, 191–200. 10.1016/j.wear.2005.09.031 [DOI] [Google Scholar]
- Gunter, H. E. (2003). “A mechanical model of vocal-fold collision with high spatial and temporal resolution,” J. Acoust. Soc. Am. 113, 994–1000. 10.1121/1.1534100 [DOI] [PubMed] [Google Scholar]
- Hess, M. M., Verdolini, K., Bierhals, W., Mansmann, U., and Gross, M. (1998). “Endolaryngeal contact pressures,” J. Voice 12, 50–67. 10.1016/S0892-1997(98)80075-1 [DOI] [PubMed] [Google Scholar]
- Jiang, J. J., Shah, A. G., Hess, M. M., Verdolini, K., Banzali, F. M., and Hanson, D. G. (2001). “Vocal fold impact stress analysis,” J. Voice 15, 4–14. 10.1016/S0892-1997(01)00002-9 [DOI] [PubMed] [Google Scholar]
- Jiang, J. J., and Titze, I. R. (1993). “A methodological study of hemilaryngeal phonation,” Laryngoscope 103, 872–882. 10.1288/00005537-199308000-00008 [DOI] [PubMed] [Google Scholar]
- Jiang, J. J., and Titze, I. R. (1994). “Measurement of vocal fold intraglottal pressure and impact stress,” J. Voice 8, 132–144. 10.1016/S0892-1997(05)80305-4 [DOI] [PubMed] [Google Scholar]
- Mantha, S., Mongeau, L., and Siegmund, T. (2005a). “Dynamic image correlation of a dynamic physical model of the vocal folds,” Adv. Bioeng. 57, 77–78. 10.1115/IMECE2005-81457 [DOI] [Google Scholar]
- Mantha, S., Siegmund, T., and Mongeau, L. (2005b). “Estimation of strain fields in self oscillating physical glottis models using 3D digital image correlation,” in Proceedings of the Fourth International Workshop on Models and Analysis of Vocal Emissions for Biomedical Applications, Florence, Italy.
- Spencer, M. (2007). “Indirect determination of the strain and stress in physical models of the vocal folds using digital image correlation,” The School of Mechanical Engineering, Purdue University, West Lafayette, IN, pp. 49–60. [Google Scholar]
- Spencer, M., Siegmund, T., and Mongeau, L. (2008). “Determination of superior surface strains and stresses, and vocal fold contact pressure in a synthetic larynx model using digital image correlation,” J. Acoust. Soc. Am. 123, 1089–1103. 10.1121/1.2821412 [DOI] [PubMed] [Google Scholar]
- Stronge, W. L. (2000). Impact Mechanics (Cambridge University Press, Cambridge, UK: ), Chap. 6, pp. 116–127. [Google Scholar]
- Sutton, M. A., Mingqi, C., Peters, W. H., Chao, Y. J., and McNeill, S. R. (1986). “Application of an optimized digital correlation method to planar deformation analysis,” Image Vision Comput. 4, 143–150. 10.1016/0262-8856(86)90057-0 [DOI] [Google Scholar]
- Tao, C., and Jiang, J. J. (2006). “Anterior-posterior biphonation in a finite element model of vocal fold vibration,” J. Acoust. Soc. Am. 120, 1570–1577. 10.1121/1.2221546 [DOI] [PubMed] [Google Scholar]
- Tao, C., Jiang, J. J., and Zhang, Y. (2006). “Simulation of vocal fold impact pressures with a self-oscillating finite-element model,” J. Acoust. Soc. Am. 119, 3987–3994. 10.1121/1.2197798 [DOI] [PubMed] [Google Scholar]
- Thomson, S. L., Mongeau, L., and Frankel, S. H. (2005). “Aerodynamic transfer of energy to the vocal folds,” J. Acoust. Soc. Am. 118, 1689–1700. 10.1121/1.2000787 [DOI] [PubMed] [Google Scholar]
- Titze, I. R. (1994). “Mechanical stress in phonation,” J. Voice 8, 99–105. 10.1016/S0892-1997(05)80302-9 [DOI] [PubMed] [Google Scholar]
- Verdolini, K., Chan, R., Titze, I. R., Hess, M., and Bierhals, W. (1998). “Correspondence of electroglottographic closed quotient to vocal fold impact stress in excised canine larynges,” J. Voice 12, 415–423. 10.1016/S0892-1997(98)80050-7 [DOI] [PubMed] [Google Scholar]
- Verdolini, K., Hess, M. M., Titze, I. R., Bierhals, W., and Gross, M. (1999). “Investigation of vocal fold impact stress in human subjects,” J. Voice 13, 184–202. 10.1016/S0892-1997(99)80022-8 [DOI] [PubMed] [Google Scholar]
- Wittenberg, T., Moser, M., Tigges, M., and Eysholdt, U. (1995). “Recording, processing, and analysis of digital high-speed sequences in glottography,” Machine Vision and Applications 8, 399–404. [Google Scholar]
- Zhang, Z., Neubauer, J., and Berry, D. A. (2006). “The influence of subglottal acoustics on laboratory models of phonation,” J. Acoust. Soc. Am. 120, 1558–1569. 10.1121/1.2225682 [DOI] [PubMed] [Google Scholar]


