

Abstract
We report the observation of liquid-liquid phase separation in a solution of human monoclonal antibody, IgG2, and the effects of human serum albumin, a major blood protein, on this phase separation. We find a significant reduction of phase separation temperature in the presence of albumin, and a preferential partitioning of the albumin into the antibody-rich phase. We provide a general thermodynamic analysis of the antibody-albumin mixture phase diagram and relate its features to the magnitude of the effective interprotein interactions. Our analysis suggests that additives (HSA in this report), which have moderate attraction with antibody molecules, may be used to forestall undesirable proetin condensation in antibody solutions. Our findings are relevant to understanding the stability of pharmaceutical solutions of antibodies and the mechanisms of cryoglobulinemia.
Keywords: biopharmaceuticals, coexistence curve, critical point, cryoprecipitation, immunoglobulin
Antibodies are widely used in research and biotechnology, as well as in medical and pharmaceutical applications. In some cases, concentrated solutions of specific antibodies are required. In particular, monoclonal antibodies (MAb) have become a major category of drugs in the treatment of a variety of diseases (1). In some drug delivery routes e.g., subcutaneous administration, formulations with concentrated antibody solutions are required to achieve therapeutic dosing (2).
The physiological functions of antibodies are mostly determined by antibody-antigen and antibody-receptor specific interactions. However, the nonspecific interactions between antibodies (i.e., self-association) in the concentrated antibody solutions can also affect their functions. Nonspecific attractive interactions can cause various forms of condensation, including liquid-liquid phase separation, aggregation, and crystallization. Upon such condensation, antibodies lose their solubility, and may lose their biological activity. Particularly, in pharmaceutical industry, these processes impact storage stability and safety of protein therapeutics thus impeding drug development (3). For example, immunogenicity of some biologics has been attributed to formation of protein aggregates (4). The mechanisms of protein condensation are complex and depend on protein concentration, buffer composition, temperature, etc. Clearly, the factors which affect protein condensation throughout the shelf-life must be understood and controlled to ensure biotherapeutic effectiveness.
One important condensation process is liquid-liquid phase separation (LLPS). In LLPS, a homogeneous protein solution spontaneously separates into two coexisting phases with different protein concentrations. This phenomenon takes place upon changing the temperature or other solution conditions, and is reversible. In contrast to aggregation or crystallization, LLPS, while highly sensitive to the average “net” attractive interaction between proteins, are much less sensitive to the distribution pattern and the nature of the “local” interactions on the protein surface. As a result, LLPS exhibits universal features applicable to a variety of proteins. LLPS is often superseded by aggregation, gelation, or crystallization. In such cases, LLPS can still be important as an underlying metastable phase transition, which substantially affects kinetics of these other condensation processes.
Recently, LLPS of several pharmaceutical antibodies have been reported (5–9). There are five isotypes of mammalian antibodies with distinct Fc regions, including IgA, IgD, IgE, IgG, and IgM. For each isotype, there are also large numbers of idiotypes with different Fab regions. Due to this great variety of antibodies, their condensation may occur at noticeably different conditions. As a cooperative phenomenon, LLPS is sensitive to rather small changes in the average interprotein interaction, and thereby can provide a useful tool to evaluate the propensities of different antibodies to condense.
High concentrations of both monoclonal and polyclonal antibodies also occur in the blood of patients with immunoproliferative disorders associated with a number of diseases, such as: multiple myeloma, hepatitis C, and HIV. In these cases, excessive endogenous antibodies (mainly IgG, IgM, and their mixtures) precipitate in blood at temperatures lower than 37 °C. This medical phenomenon is called cryoglobulinemia (10–12). Sometimes, intravascular condensation of antibodies can even occur at body temperature and have adverse physiological consequences such as auto immunogenicity, increase in blood viscosity, and deposition in blood vessels. The cryoglobulinemia is reversible upon raising the temperature, and antibodies may maintain their ability to bind to antigen. These characteristics are consistent with LLPS.
In order to investigate the propensity of antibodies to undergo protein condensation in vivo, both in the case of cryoglobulinemia and in the pharmaceutical applications, the solution conditions of blood serum must be taken into account. Here we report the study of the LLPS of a monoclonal human antibody, which is denoted by IgG2-A as in ref. 5, under solution conditions mimicking those in a blood serum. Specifically, we investigated LLPS at physiological pH (pH = 7.4) in the presence of human serum albumin (HSA), which is the major protein component in blood serum.
The solution conditions, such as protein concentration, composition, temperature, buffer properties, etc., under which LLPS occurs are represented by a phase diagram. The phase diagram may be viewed as a collection of coexistence curves which represent the dependence of phase separation temperature on the protein concentration at various conditions. In this work, we have determined the coexistence curves of a MAb solution in the presence of various concentrations of HSA. Here we show that the MAb solutions have much lower critical concentration and much wider coexistence curve as compared to solution of compact globular proteins. We ascribe this difference to extended Y-like shape of MAb molecules. Further, we find that HSA preferentially partitions into protein-rich phase and lowers phase separation temperature. Finally, we present the theoretical analysis of these phenomena, show that they imply an attractive interaction between MAb and HSA, and evaluate the magnitude of this interaction.
Results
The Coexistence Curve of MAb-Water Binary Solution at Physiological pH.
We have measured the temperature for phase separation, Tph, of our MAb as a function of antibody concentration, c1, and obtained the coexistence curve shown in Fig. 1. In a binary solution, the maximum temperature occurs at the critical point. Thus, in Fig. 1 we observe that the critical temperature, Tc, is equal to -0.6 ± 0.1 °C, and the critical concentration, cc, is 90 ± 9 mg/mL. For temperatures greater than the critical temperature, the MAb solution remains in a stable homogeneous phase for all concentrations. For temperatures below Tc, the coexistence curve specifies the concentrations of the two coexisting liquid phases corresponding to that temperature.
Fig. 1.

Liquid-liquid phase separation of MAb solutions in 0.1 M Tris·HCl buffer at pH 7.4. The eye guide for the LLPS boundary is indicated by the dashed line. The crossed square is the critical point determined at the maximum of the phase boundary.
Using the value of 0.71 mL/g for the protein specific volume (13), we find that the critical concentration corresponds to a critical volume fraction of 6.3%. This value is quite small considering that in solutions of spherical particles the critical volume fraction varies from 13% to 23% as the spatial range of the interparticle interaction varies from infinity to zero (14). The small value of the critical volume fraction of MAb reflects the extended, highly nonspherical shape of antibody molecules. This value implies that the volume of a spherical particle, which matches the observed critical concentration, is at least twice as large as the actual volume of the antibody molecule.
The phenomenon of separation into coexisting liquid phases signifies attractive interactions between the antibody molecules (14). Such attractive interactions can also lead to crystallization and aggregation of the antibody molecules. All these condensation phenomena of pharmaceutical or endogenous antibodies can have serious pathophysiological consequences in vivo such as immunogenicity, increase in blood viscosity, and deposition in blood vessels. From this perspective it is important to investigate how the condensation of antibodies can be affected by other components of blood serum.
Liquid-Liquid Phase Separation of MAb-HSA-Water Ternary Solutions.
In view of the fact that HSA is a major component of blood serum, we have measured the effect of HSA on the phase separation of MAb in aqueous solutions at physiological pH. We find that, regardless of MAb concentration, the addition of HSA lowers the phase separation temperature in direct proportion to the HSA concentration, c2. We list in Table 1 the values of (∂Tph/∂c2)c1. We see that this derivative is approximately independent of c1, and has the average value: -0.24 ± 0.03 °C·mL/mg. Therefore, at the typical concentration of HSA in blood of ∼40 mg/mL (15), HSA reduces the phase separation temperature by ∼9 °C. Thus, HSA may have a significant role in preventing condensation of antibodies in blood at body temperature.
Table 1.
The rate of change of the phase separation temperature, Tph, with HSA concentration, c2, at a fixed MAb concentration c1
| Measurement |
1 |
2 |
3 |
4 |
5 |
| c1 (mg/mL) | 37 | 54 | 98 | 114 | 140 |
| (∂Tph/∂c2)c1 | −0.22 | −0.27 | −0.22 | −0.24 | −0.26 |
| (°C·mL/mg) | ±0.03 | ±0.03 | ±0.03 | ±0.03 | ±0.03 |
The values in Table 1 were found by measuring the decrease in phase separation temperature upon adding HSA at fixed MAb concentration. Tph decreases linearly with increase of c2 as shown in Fig. 2A at two representative values of c1. (See Fig. S1 in SI Appendix for the entire dataset). In Fig. 2B we plot the coexistence curves (Tph, c1) at several values of HSA concentration, c2. We see that the entire coexistence curve shifts downwards as c2 increases. Fig. 2 A and B represent two cross sections of a phase diagram, which describes the solution conditions required for LLPS of MAb in the presence of HSA. Due to the diversity of antibodies, the critical temperatures, Tc, of different antibodies may vary widely. Indeed, in the case of cryoglobulinemia, antibodies form condensates even at body temperature. Thus, the phase diagram can become a clinically important representation of the conditions under which pathophysiological protein condensation can occur in blood.
Fig. 2.

(A) Decrease of LLPS temperature, Tph, vs. the HSA concentration, c2, at fixed MAb concentration, c1. Linear fitting of Tph vs c2 at each c1 is shown by the dashed line. (B) LLPS boundaries at fixed c2 shift to lower temperature as HSA concentration, c2, increases (The data were obtained by interpolation of the data in SI Appendix; Fig. S1).
In LLPS, the concentrations of MAb as well as the concentrations of HSA are different in the two coexisting phases. The actual partitioning of these two proteins depends on the magnitude and the sign of the interprotein interactions between pairs of MAb-MAb, MAb-HSA and HSA-HSA. These interprotein interactions are also responsible for the suppression of LLPS temperature of MAb solutions upon the addition of HSA. Therefore, it is important to measure quantitatively the actual compositions of MAb and HSA in the two coexisting phases.
Partitioning of MAb and HSA in the Coexisting Phases.
At any fixed temperature beneath Tc, the concentration of each protein in each coexisting phase depends upon the initial concentrations of the two proteins in the starting solution. We measured the concentrations of MAb and HSA in pairs of coexisting phases at fixed temperature. In Fig. 3 we present our results for two different temperatures. In Fig. 3, each pair of two data points representing the two coexisting phases are connected by a so-called “tie-line.” Fig. 3 shows that the concentration of HSA in the MAb-rich phase is higher than that in the MAb-poor phase, i.e., HSA preferentially partition into the protein-rich phase. This observation implies that the interprotein interaction between MAb and HSA is attractive. In part this attraction may be attributed to the electrostatic interaction between MAb and HSA. Indeed, the isoelectric point of MAb is pI = 8.8 and that of HSA is pI = 5.7 (calculated using www.expasy.org). Thus, at the physiological pH 7.4, MAb and HSA carry charges of opposite sign.
Fig. 3.

Partitioning of MAb and HSA upon LLPS at fixed temperature (A) T = -2.2 °C; and (B) T = -4.2 °C. The points representing the two coexisting phases are connected by the solid lines, i.e., the tie lines. Dashed lines are eye guides for the binodal curves fitted from both cloud-point measurements (open triangles) and partitioning measurements (solid circles). The critical points are represented by the crossed square.
In Fig. 3, we also designate the binodal curve (c1, c2) at constant temperature by fitting data from both partitioning measurement and Tph measurement. Using the method of analysis described previously (16), we also estimated the positions of the critical points of the MAb-HSA-water ternary solution. In Fig. 3, we show that c1 at the critical points are equal to 105 ± 10 mg/mL at both measured temperatures. The critical concentration of MAb in the ternary solution is equal to that found for the pure MAb solution, within experimental error.
In our samples, ∼80% of MAb molecules have two pyroglutamate residues at the heavy chain N termini. In the remaining fraction, only one of the heavy chains has pyroglutamate, whereas the other chain has the original N-terminal glutamine. We denote these two species by the symbols  and
and  respectively. These two species can be differentiated by CEX HPLC (5, 17). We have measured (Table S1 in SI Appendix) molar ratios of
  to
to  , x, in both coexisting phases as well as in the original solutions. In the protein-poor phase, x = 0.283 ± 0.002. In the protein-rich phase, x = 0.312 ± 0.004. In the original solutions, x = 0.302 ± 0.001. Table S1 shows that upon phase separation the relative proportion of
  to
to  is slightly but consistently increased in the protein-rich phase. The value of x in the two coexisting phases does not depend on HSA concentration within the experimental errors. Observation of the difference in the partitioning of
  and
and  signifies that alteration of a single amino acid residue could affect the interprotein interaction and thereby the phase behavior of the protein solution.
Quasielastic Light-Scattering (QLS) Study of the MAb-HSA Mixture Solution.
We have measured the apparent diffusion coefficients, D, of protein molecules in pure MAb solutions and in MAb-HSA mixtures containing 30% (w/w) HSA, as a function of total protein concentration (Fig. S2 in SI Appendix). We deduced the apparent diffusion coefficient, D0, of proteins for infinitely dilute pure and mixed solutions. Using these D0s, we calculated that the apparent hydrodynamic radius,  , of pure MAb solutions is equal to 5.9 ± 0.1 nm. Similarly, we have found the
  for pure HSA monomers to be equal to 4.1 ± 0.2 nm. In the MAb-HSA mixture, the apparent
  is equal to 5.7 ± 0.3 nm. This value indicates that no heterodimerization or other strong interactions between MAb and HSA takes place. The apparent diffusion coefficients decrease with the total protein concentration both in pure MAb solutions and in MAb-HSA mixtures. The negative value of dD/dc is indicative of attractive interactions. The value of the normalized slope, d(D/D0)/dc, is less negative for the mixture than that for the pure MAb solution, which implies that HSA diminishes the effective interprotein attraction. This observation is in accord with the suppression of LLPS upon the addition of HSA.
Discussion
In this work, we report the observation of LLPS of an IgG2 monoclonal antibody at physiological pH, as well as in the presence of human serum albumin. While LLPS in solutions of globular proteins is well documented (16, 18–21), it is often preempted by aggregation or crystallization. Recently, reports have appeared of such LLPS in solutions of antibodies (5–9, 22). Antibodies can be present in blood at relatively high concentrations. Furthermore, antibodies are widely and increasingly used in concentrated solutions as pharmaceutical drugs. In view of these facts, it is very important to quantitatively investigate phase separation phenomena for these proteins. Indeed the loss of homogeneity due to the formation of droplets of condensed phases can have adverse effects both physiologically, and in the manufacturing and storage of MAb-based therapeutics.
Phase Diagram of MAb Aqueous Solutions.
As is the case with other proteins, the MAb phase diagram provides a comprehensive delineation of the solution conditions under which phase separation can occur. Theoretical analysis of this diagram can provide insights into the intermolecular interactions responsible for the condensation of the protein. In previous studies of globular proteins, the main features of the coexistence curve such as the critical temperature, critical concentration, and the width of the coexistence curve were successfully explained in terms of the effective magnitude, range and anisotropy of the interprotein interactions (14, 23). However, these previous theoretical studies were predicated on the model of proteins as spherical particles (14, 23). We shall see here that such theories may have limited applicability to the phase behavior of Y-shaped antibody molecules.
Indeed, one of the striking features of the coexistence curve of pure MAb is the very small value of the critical concentration, cc, or critical volume fraction, ϕc = ccvsp, where vsp = 0.71 mL/g is the specific volume of protein molecules (13). In Table 2, we compare the critical volume fractions found theoretically for spherical particles in the limit of very short and very long range of attraction, as well as the experimentally observed critical volume fractions for various proteins. We believe that the small critical volume fraction of antibodies is a consequence of its extended, Y-like shape.
Table 2.
Theoretical and experimental values of the critical volume fraction, ϕc
In Fig. 4, we show several coexistence curves plotted using the scaled variables T/Tc and c/cc. Curve 1 shows the mean-field prediction for a solution of attractive hard spheres with a Carnahan-Starling approximation for the entropy. We may quantify the width, w, of each coexistence curve by fitting the curve in the neighborhood of the critical point using a phenomenological asymptotic expression: [(c - cc)/cc]2 = w(Tc - Tph)/Tc. For curve 1, the width is w = 6.15. Curve 2 shows the theoretical fit (20) of the data for bovine γB crystallin taken from ref. 18. Because of the short range and highly anisotropic (aeolotopic) interactions (14, 23), this coexistence curve has width w = 27 which is much wider than curve 1. The data points shown for other nearly spherical proteins follow coexistence curves similar to curve 2 (16, 24). Interestingly, the coexistence curve for our MAb (curve 3) is even wider than that observed for nearly spherical proteins, and is asymmetrical: being much wider on the high concentration side than on the low concentration side. For curve 3, w = 120. Coexistence curves of other reported MAb’s also share similar broad and asymmetrical shapes (6, 7). We believe that these characteristics of the MAb coexistence curve result from the highly nonspherical Y-like antibody shape (25, 26), and possibly from its flexibility. Thus, it appears that currently used model free energies, which assume a spherical shape of protein molecules, have limited applicability in the description of the thermodynamic properties of solutions of antibody.
Fig. 4.

Coexistence curves in the units of scaled phase separation temperatures, Tph/Tc, and the scaled protein concentrations, c/cc. Curve 1 (short dashed line) shows the theoretical coexistence curve of spherical particles using mean-field approximation of attraction and Carnahan-Starling expression for entropy. Curve 2 (long dashed line) shows the theoretical fit for the data of bovine γB crystallin (open squares) taken from (18). Curve 3 (solid line) shows the eye guide for the coexistence curve of MAb (solid circles). Data points on the coexistence curves of two other globular proteins (16, 24): human γD crystallin (open diamonds) and chicken egg white lysozyme (open triangles) are also shown.
Phase Diagrams of MAb-HSA Aqueous Solutions.
There are two important features of the phase diagrams of MAb-HSA-water ternary solutions: the reduction of Tph upon addition of HSA and the preferential partitioning of HSA into the concentrated MAb phase. In the following discussion, we will connect these two features to the “effective energies” of MAb-HSA interactions and to the excluded volume entropies for both of these molecules. In the limit of a small mole fraction of HSA, x = N2/N1 ≪ 1, where N1 and N2 are the numbers of molecules of MAb and HSA respectively, the HSA-HSA interaction is negligible. Hence, we may write the Helmholtz free energy as: F = F0 + N2kT ln(ϕ2/eα) + N2E12. Here, F0(ϕ1,T) is the Helmholtz free energy of a pure MAb solution. The remaining terms, linear in N2, represent the entropic and energetic contributions of HSA. The entropic term is written as the entropy of an ideal solution of HSA in the volume, Veff, accessible to it. Thus, the quantity α(ϕ1,T) represents the fraction of the total volume accessible to HSA, i.e., α = Veff/V. The energetic component, per HSA molecule, due to the MAb-HSA interaction is denoted as E12(ϕ1,T). In the high temperature approximation, both α and E12 are independent of T.
The Reduction of the Phase Separation Temperature of MAb Solutions in the Presence of HSA.
We now examine the factors, which determine the change of Tph in a MAb solution, ΔTph, upon addition of a small mole fraction, x, (x ≪ 1) of HSA. Using the equilibrium condition,  , and general thermodynamic relations (27), we have derived ΔTph at constant volume fraction of MAb, ϕ1 (see SI Appendix):
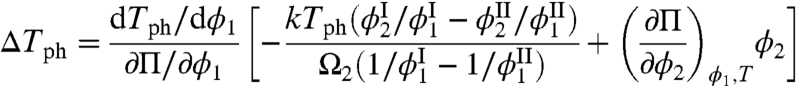 |
[1] |
Here, Tph is the phase separation temperature of the pure MAb solution, Π is the osmotic pressure of the solution, and Ω2 is the volume of one HSA molecule. The slope of the coexistence curve of pure MAb solution, dTph/dϕ1, is positive at ϕ1 smaller than the critical volume fraction ϕc and is negative at ϕ1 larger than ϕc. The osmotic incompressibility in a pure MAb solution, ∂Π/∂ϕ1, is always positive in a stable phase. Because experimentally ΔTph is negative for all values of ϕ1, it follows that the bracketed term in Eq. 1 must have opposite signs on the two sides of the coexistence curve. The first term in the brackets describes the effect of HSA partitioning. The experimentally observed partitioning of HSA is small (Fig. 3):  . This observation is actually remarkable because the condensed phase has much less free volume, Veff, to accommodate the HSA than has the dilute phase. When
  the partitioning term in Eq. 1 becomes equal to -kTphϕ2/Ω2. The second term in the bracket characterizes the change of osmotic pressure upon addition of HSA. Using Π = -(∂F/∂V)N1,N2,T, and our expression for the Helmholtz free energy, it follows that (∂Π/∂ϕ2)ϕ1,T = kTph/Ω2 + ϕ1(∂(E12 - kTph ln α)/∂ϕ1)/Ω2. The first term here represents the ideal (van’t Hoff) contribution to the osmotic incompressibility. Under the conditions of no partitioning (
 ), this contribution cancels the first term in the brackets in Eq. 1. This cancellation reflects the fact that adding an ideal, noninteracting solute should produce no change in the coexistence curve. The second term: ϕ1(∂(E12 - kTph ln α)/∂ϕ1), represents the nonideal contribution of HSA to the osmotic incompressibility. This term involves two elements: the MAb-HSA interaction energy E12 and the excluded volume entropy -kTph ln α. Using a Monte Carlo simulation and a three-sphere model for the Y-shaped MAb molecule (see SI Appendix), we have evaluated the free volume fraction α as a function of ϕ1. A graph of ∂(- ln α)/∂ϕ1 vs. ϕ1 is shown in (Fig. S6 in SI Appendix). This excluded volume contribution is positive and monotonically increases with ϕ1. At the critical point, this derivative is equal to 10. Because ϕ1(∂(E12 - kTph ln α)/∂ϕ1) changes sign at the critical point, it follows that there ∂E12/∂ϕ1 = -10kTph. The energy E12 is a smooth monotonic function of ϕ1, thus ∂E12/∂ϕ1 is not expected to vary dramatically. Indeed, in the mean-field approximation, E12 = ϵ12ϕ1, this derivative would be constant, ϵ12 = -10kTph, over the entire range of ϕ1, and E12 will be -1.4kTc at the critical point. The negative value of this energy is consistent with an attractive MAb-HSA interaction. This significant attraction compensates for the low entropy of HSA in the protein-rich phase and produces the nearly equal values of HSA volume fractions in the two phases.
Partitioning of MAb and HSA.
As has been seen above, the partitioning of HSA into the two coexisting phases is closely connected with the magnitude and sign of the change in Tph (Eq. 1). The partitioning of HSA is controlled by its chemical potential: μ2 = (∂F/∂N2)N1,V,T. Using the expression for Helmholtz free energy, we derived that: μ2 = kT ln(ϕ2/α) + E12. The partitioning of HSA between the two phases, i.e., the relation between  and
and  , is determined by the equilibrium condition,
  , which has the form:
| [2] |
This equation connects the ratio of HSA volume fractions in the two phases to the excluded volume entropies and the MAb-HSA interaction energies. With α(ϕ1) determined by Monte Carlo simulation, Eq. 2 provides an alternative way to evaluate E12. Using the simulation results and the experimental data from five tie-lines (Fig. 3), we have deduced  and found that this quantity ranged from -1.8kTph to -1.1kTph. The negative value of ΔE12 implies an attractive interaction between MAb and HSA. This attraction is the driving force for the partitioning of HSA. In the mean-field approximation, E12 = ϵ12ϕ1, then
  has a value ranging from -14.0kTph to -13.3kTph. Considering the approximations involved, this result is quite consistent with the estimation above, ϵ12 = -10kTph, based on the shift of the coexistence curve upon adding HSA.
Furthermore, it is interesting to examine the relative partitioning of  and
and  .
.  and
and  are identical in shape and size and are different at only one amino acid position. For these “similar” proteins, the difference between the molar ratios of
  to
to  , x, in the two coexisting phases, is solely determined, when x is small, by the difference between the energies of
  like-unlike interaction, E12, and that of
  like-like interaction, E11, in these two phases. We have previously shown (16) that this relative partitioning of similar proteins can be described by: kTph(ln xI - ln xII) = ΔE12 - ΔE11, where
  and
and  . The driving force for the relative partitioning of
  is: ΔE12 - ΔE11. Using the experimental data in Table S1 in SI Appendix, we can deduce ΔE12 - ΔE11 ≈ -0.1kT. The negative value of ΔE12 - ΔE11 suggests that the
  attraction is stronger than the
  attraction. The magnitude of ΔE12 is larger than that of ΔE11 by one tenth of the thermal energy kT. This change in interaction energy is caused by the alteration of a single amino acid residue. While the small difference between ΔE12 and ΔE11 is expected to have a small effect on the phase separation temperature, this difference produces an observable partitioning of these similar proteins. In vivo, as well as in biopharmaceutical production we frequently encounter mixtures of various antibody isoforms. The case of
  and
and  provides an important example of phase separation partitioning in such mixtures of closely related antibody variants.
In conclusion, we have observed LLPS of a monoclonal antibody, IgG2-A, at physiological pH. The phase diagram of our MAb solution is distinctly different from that of nearly spherical globular proteins. Our experiments, together with the data available for other antibodies (5–9), show that: the immunoglobulins have a markedly lower critical concentration and a much broader, asymmetric coexistence curve. We believe that these features are associated with the highly nonspherical shape of an IgG molecule, i.e., the Carnahan-Starling form for excluded volume entropy of hard spheres is unsuitable for thermodynamic analysis of antibody solutions. We have also examined the effect of HSA, the major protein component in blood, on the LLPS of MAbs. We have found that the phase separation temperature decreases as HSA concentration increases. This result is remarkable as it implies that HSA may play a significant role in maintaining the stability of antibodies in blood. By applying a general thermodynamic analysis, we have attributed the reduction of phase separation temperature of MAb solutions in the presence of HSA to the attractive interaction between MAb and HSA. This phenomenon shows the role of the protein-additive interaction in tuning the phase separation temperature of the protein solution. Furthermore, the partitioning of HSA (or any other excipient) also depends on the energy of MAb-additive interaction. In a special case of  , a minor antibody isoform, we have given a further analysis of the relative partitioning, and conclude that the
  attraction is stronger than the
  attraction.
This investigation along with other recent findings (5–9) suggests that LLPS may be a ubiquitous phenomenon in antibody solutions. This fact is of obvious importance for biotechnological and pharmaceutical applications and for understanding the origin of cryoglobulinemia which is a condition observed in a number of human diseases. The present work provides a conceptual experimental and theoretical framework for further studies in this emerging field.
Materials and Methods
Preparation and Purification of MAb and HSA.
MAb, IgG2-A, was produced at Amgen Inc. The original MAb solution contained  and
and  isoforms corresponding to partial and complete cyclization of the heavy chain N termini (Fig. S3 in SI Appendix). The two isoforms were identified by peptide mapping coupled with mass-spectrometry (performed at Amgen Inc.). HSA was purchased from Sigma. The dimers and oligomers of HSA were removed using a preparative chromatographic system (AKTA prime plus, Amersham Biosciences) and a size-exclusion column (Superdex 200, GE Healthcare).
Solution Preparation.
The purified MAb and HSA proteins were dialyzed exhaustively into Tris·HCl buffer (0.1 M, pH 7.4). Solutions containing dilute MAb and HSA in Tris·HCl buffer were concentrated by ultrafiltration (Amicon, 10 kDa) and Centrifugation (Amicon Ultra, 10 kDa). The concentrations of MAb and HSA in the mixture solutions were determined using HPLC with a CEX column (wide pore CBx 5 μ, J.T.Baker). The column was equilibrated with 20 mM potassium phosphate buffer and eluted with 0 to 100% 500 mM potassium phosphate over 30 min at pH 6. This column was precalibrated with standard MAb and HSA solutions respectively. The concentrations of standard solutions were measured by an UV spectrometer at 280 nm using the extinction coefficient value of 1.48 mg-1·mL·cm-1 for MAb and 0.52 mg-1·mL·cm-1 for HSA (www.expasy.org). The ratios of  to
to  in solutions were determined using a CEX HPLC method described in refs. 5, 17. The ratios of
  to
to  were calculated from the integrated peak areas using 280 nm detection.
Measurement of Tph.
A test tube containing the sample was placed in a thermostated light-scattering stage, whose temperature was initially set above the phase separation temperature so that the solution was transparent. The transmitted intensity of a 4-mW He-Ne laser was recorded by a photodiode. The temperature of the sample was then step wise lowered by 0.1 K every 5 min. At a well defined temperature, Tcloud, the sample became visibly cloudy. The temperature was then step wise raised by 0.1 K every 5 min. The minimum temperature at which the solution became clear again was denoted by Tclarify. The phase separation temperature Tph is estimated as the average of Tclarify and Tcloud. The difference between Tcloud and Tclarify is hysteresis which reflects the nucleation rate (19). Because hysteresis depends on kinetic processes, all the cooling and heating steps were set with a standard time interval (5 min).
Measurement of MAb-HSA Partitioning.
The solutions having known c1 and c2 were quenched to a temperature below Tph in a thermostated water bath. After an incubation time of one week, a sharp interface formed between two liquid phases. The formation of the sharp interface was taken as an indication that equilibrium was reached. The MAb and HSA in both phases were separated and their concentrations were measured using precalibrated CEX HPLC at pH 6.
QLS.
All protein samples were filtered through a 0.1 μm Millipore filter and placed in a test tube. QLS experiments were performed on a light-scattering apparatus using a PD2000DLSPLUS correlator (Precision Detectors) and a Coherent He-Ne laser (35 mW, 632.8 nm; Coherent Radiation). The measurements were performed at a scattering angle of 90°. The measured correlation functions were analyzed by the Precision Deconvolve 5.5 software (Precision Detectors). The correlation functions were used to calculate the apparent diffusion coefficients, D, of proteins in solutions with given total protein concentration, c, at different HSA weight fraction, w = 0%, 30%, and 100%. D(c = 0)w were obtained by extrapolating D(c)w to c = 0. The hydrodynamic radii, Rh’s, of proteins in solutions with fixed w were calculated from D(c = 0)w using Stokes-Einstein relation.
Supplementary Material
Acknowledgments.
We thank Sabine Hogan, John F. Valliere-Douglass (both of Amgen Inc.) and Olutayo Ogun (MIT) for technical support and to thank Suresh Vunnum, Jaby Jacob, Alison Wallace, Gerald W. Becker, Linda O. Narhi, Michael J. Treuheit, and David N. Brems (all of Amgen Inc.) for helpful discussions. We acknowledge the financial support of Amgen Inc.
Footnotes
The authors declare no conflict of interest.
This article contains supporting information online at www.pnas.org/lookup/suppl/doi:10.1073/pnas.1112241108/-/DCSupplemental.
References
- 1.An Z. Therapeutic monoclonal antibodies: from bench to clinic. Hoboken, NJ.: John Wiley & Sons; 2009. [Google Scholar]
- 2.Shire SJ, Shahrokh Z, Liu J. Challenges in the development of high protein concentration formulations. In: Shire SJ, Gombotz W, Bechtold-Peters K, Andya J, editors. Current trends in monoclonal antibody development and manufacturing. New York: Springer; 2009. pp. 131–147. [Google Scholar]
- 3.Wang W, Roberts CJ. Aggregation of therapeutic proteins. Hoboken, NJ: Wiley; 2010. [Google Scholar]
- 4.Rosenberg AS. Effects of protein aggregates: an immunologic perspective. AAPS J. 2006;8:E501–507. doi: 10.1208/aapsj080359. [DOI] [PMC free article] [PubMed] [Google Scholar]
- 5.Chen S, Lau H, Brodsky Y, Kleemann GR, Latypov RF. The use of native cation-exchange chromatography to study aggregation and phase separation of monoclonal antibodies. Protein Sci. 2010;19:1191–1204. doi: 10.1002/pro.396. [DOI] [PMC free article] [PubMed] [Google Scholar]
- 6.Mason BD, Zhang-van Enk J, Zhang L, Remmele RL, Jr, Zhang J. Liquid-liquid phase separation of a monoclonal antibody and nonmonotonic influence of Hofmeister anions. Biophys J. 2010;99:3792–3800. doi: 10.1016/j.bpj.2010.10.040. [DOI] [PMC free article] [PubMed] [Google Scholar]
- 7.Nishi H, et al. Phase separation of an IgG1 antibody solution under a low ionic strength condition. Pharm Res. 2010;27:1348–1360. doi: 10.1007/s11095-010-0125-7. [DOI] [PubMed] [Google Scholar]
- 8.Lewus RA, Darcy PA, Lenhoff AM, Sandler SI. Interactions and phase behavior of a monoclonal antibody. Biotechnol Progr. 2011;27:280–289. doi: 10.1002/btpr.536. [DOI] [PubMed] [Google Scholar]
- 9.Trilisky E, Gillespie R, Osslund TD, Vunnum S. Crystallization and liquid-liquid phase separation of monoclonal antibodies and Fc-fusion proteins: screening results. Biotechnol Progr. 2011;27:1054–1067. doi: 10.1002/btpr.621. [DOI] [PubMed] [Google Scholar]
- 10.Charles ED, Dustin LB. Hepatitis C virus-induced cryoglobulinemia. Kidney Int. 2009;76:818–824. doi: 10.1038/ki.2009.247. [DOI] [PMC free article] [PubMed] [Google Scholar]
- 11.Fabris P, et al. Prevalence and clinical significance of circulating cryoglobulins in HIV-positive patients with and without Co-infection with hepatitis C virus. J Med Virol. 2003;69:339–343. doi: 10.1002/jmv.10294. [DOI] [PubMed] [Google Scholar]
- 12.Dimopoulos MA, Alexanian R. Waldenstroms macroglobulinemia. Blood. 1994;83:1452–1459. [PubMed] [Google Scholar]
- 13.Schurtenberger P, Chamberlin RA, Thurston GM, Thomson JA, Benedek GB. Observation of critical phenomena in a protein-water solution. Phys Rev Lett. 1989;63:2064–2067. doi: 10.1103/PhysRevLett.63.2064. [DOI] [PubMed] [Google Scholar]
- 14.Lomakin A, Asherie N, Benedek GB. Monte Carlo study of phase separation in aqueous protein solutions. J Chem Phys. 1996;104:1646–1656. [Google Scholar]
- 15.Omenn GS. Exploring the human plasma proteome. Weinheim: Wiley-VCH; 2006. p. xxii, 372. [Google Scholar]
- 16.Wang Y, Lomakin A, McManus JJ, Ogun O, Benedek GB. Phase behavior of mixtures of human lens proteins Gamma D and Beta B1. Proc Natl Acad Sci USA. 2010;107:13282–13287. doi: 10.1073/pnas.1008353107. [DOI] [PMC free article] [PubMed] [Google Scholar]
- 17.Lau H, et al. Investigation of degradation processes in IgG1 monoclonal antibodies by limited proteolysis coupled with weak cation-exchange HPLC. J Chromatogr B. 2010;878:868–876. doi: 10.1016/j.jchromb.2010.02.003. [DOI] [PubMed] [Google Scholar]
- 18.Broide ML, Berland CR, Pande J, Ogun OO, Benedek GB. Binary-liquid phase separation of lens protein solutions. Proc Natl Acad Sci USA. 1991;88:5660–5664. doi: 10.1073/pnas.88.13.5660. [DOI] [PMC free article] [PubMed] [Google Scholar]
- 19.Liu C, et al. Phase separation in aqueous solutions of lens gamma-crystallins: special role of gamma s. Proc Natl Acad Sci USA. 1996;93:377–382. doi: 10.1073/pnas.93.1.377. [DOI] [PMC free article] [PubMed] [Google Scholar]
- 20.Thomson JA, Schurtenberger P, Thurston GM, Benedek GB. Binary liquid phase separation and critical phenomena in a protein/water solution. Proc Natl Acad Sci USA. 1987;84:7079–7083. doi: 10.1073/pnas.84.20.7079. [DOI] [PMC free article] [PubMed] [Google Scholar]
- 21.Delaye M, Clark JI, Benedek GB. Coexistence curves for the phase separation in the calf lens cytoplasm. Biochem Biophys Res Commun. 1981;100:908–914. doi: 10.1016/s0006-291x(81)80259-8. [DOI] [PubMed] [Google Scholar]
- 22.Jion AI, Goh LT, Oh SK. Crystallization of IgG1 by mapping its liquid-liquid phase separation curves. Biotechnol Bioeng. 2006;95:911–918. doi: 10.1002/bit.21054. [DOI] [PubMed] [Google Scholar]
- 23.Lomakin A, Asherie N, Benedek GB. Aeolotopic interactions of globular proteins. Proc Nat’l Acad Sci USA. 1999;96:9465–9468. doi: 10.1073/pnas.96.17.9465. [DOI] [PMC free article] [PubMed] [Google Scholar]
- 24.Taratuta VG, Holschbach A, Thurston GM, Blankschtein D, Benedek GB. Liquid-liquid phase separation of aqueous lysozyme solutions—effects of pH and salt identity. J Phys Chem. 1990;94:2140–2144. [Google Scholar]
- 25.Sandin S, Ofverstedt LG, Wikstrom AC, Wrange O, Skoglund U. Structure and flexibility of individual immunoglobulin G molecules in solution. Structure. 2004;12:409–415. doi: 10.1016/j.str.2004.02.011. [DOI] [PubMed] [Google Scholar]
- 26.Harris LJ, Larson SB, Skaletsky E, McPherson A. Comparison of the conformations of two intact monoclonal antibodies with hinges. Immunol Rev. 1998;163:35–43. doi: 10.1111/j.1600-065x.1998.tb01186.x. [DOI] [PubMed] [Google Scholar]
- 27.Landau LD, Lifshitz EM, Pitaevskii LP. Statistical physics. 3d rev. and enl. Ed. Oxford; New York: Pergamon Press; 1980. [Google Scholar]
- 28.Silverton EW, Navia MA, Davies DR. Three-dimensional structure of an intact human immunoglobulin. Proc Natl Acad Sci USA. 1977;74:5140–5144. doi: 10.1073/pnas.74.11.5140. [DOI] [PMC free article] [PubMed] [Google Scholar]
Associated Data
This section collects any data citations, data availability statements, or supplementary materials included in this article.