

Abstract
Despite advances in resolution accompanying the development of high-field superconducting magnets, biomolecular applications of NMR require multiple dimensions in order to resolve individual resonances, and the achievable resolution is typically limited by practical constraints on measuring time. In addition to the need for measuring long evolution times to obtain high resolution, the need to distinguish the sign of the frequency constrains the ability to shorten measuring times. Sign discrimination is typically accomplished by sampling the signal with two different receiver phases or by selecting a reference frequency outside the range of frequencies spanned by the signal and then sampling at a higher rate. In the parametrically sampled (indirect) time dimensions of multidimensional NMR experiments, either method imposes an additional factor of 2 sampling burden for each dimension. We demonstrate that by using a single detector phase at each time sample point, but randomly altering the phase for different points, the sign ambiguity that attends fixed single-phase detection is resolved. Random phase detection enables a reduction in experiment time by a factor of 2 for each indirect dimension, amounting to a factor of 8 for a four-dimensional experiment, albeit at the cost of introducing sampling artifacts. Alternatively, for fixed measuring time, random phase detection can be used to double resolution in each indirect dimension. Random phase detection is complementary to nonuniform sampling methods, and their combination offers the potential for additional benefits. In addition to applications in biomolecular NMR, random phase detection could be useful in magnetic resonance imaging and other signal processing contexts.
Keywords: compressed sensing, MRI
In NMR and MRI, practical constraints on data sampling limit the achievable frequency resolution. In sampling-limited regimes, it is increasingly clear that eschewing the use of uniform sampling enables the recovery of high-resolution spectra using substantially fewer samples (1–15). The approach is not without limitations: Nonuniform sampling (NUS) introduces sampling artifacts that present severe limitations. When the discrete Fourier transform (DFT) is used to obtain a frequency spectrum from NUS data (16–18), the resulting spectrum is the convolution of the sampling schedules’s point-spread function (PSF) with the true spectrum (19). A host of non-Fourier methods of spectrum analysis can effectively deconvolve the PSF from the NUS spectrum (3, 8, 15, 16, 20–28), and although successful to a degree, their ability to remove sampling artifacts is invariably limited by the presence of noise. Thus the design of efficient nonuniform sampling schemes that minimize sampling artifacts is an active area of research in both NMR and MRI. The power of randomness for minimizing sampling artifacts, essentially by inducing decoherence of the sampling artifacts, has been recognized (12, 29–31), and incoherent sampling is one of the principal tenets in the field known as compressed sensing (22, 32, 33). Many of the artifacts that accompany nonuniform sampling are spectral aliases (34, 35), and randomization helps to suppress them in part by increasing the effective bandwidth of a sampling scheme.
In NMR, the need to unambiguously determine the sign of the frequency places additional demands on sampling. Spectrum analysis of an oscillating signal from single-phase measurements is subject to sign ambiguity of the frequency (36). An approach widely used to resolve this ambiguity is to simultaneously detect two orthogonal phases (simultaneous quadrature detection). When simultaneous quadrature detection is not feasible, oversampling by a factor of 2 together with placing the detector reference frequency outside the spectral window spanned by the signal can resolve the ambiguity. The detector frequency can be shifted outside the spectra window either by actually setting it there or by time-proportional phase incrementation (TPPI) (37). Alternatively, two orthogonal phases can be detected sequentially (sequential quadrature detection; ref. 38). The total number of samples required to resolve the sign ambiguity is the same whether quadrature detection or oversampling is employed.
Randomness can also be used to resolve sign ambiguity, which itself is a form of aliasing. We show that single-phase detection using uniform sampling, while randomly choosing either 0° or 90° phase for each sample point (random phase detection, RPD), is able to resolve the frequency sign ambiguity. RPD results in a factor of 2 reduction in the number of samples required, compared to quadrature or TPPI detection methods, for each indirect dimension of a multidimensional experiment, or a factor of 2 increase in resolution in each dimension for a fixed amount of sampling. RPD data can be processed using conventional DFT methods, but as with NUS data, this results in sampling artifacts. More sophisticated spectral estimation methods that suppress sampling artifacts are preferable. The gains that can be achieved with RPD are comparable to those obtained with NUS. However RPD is complementary to NUS, permitting the methods to be used concurrently.
Theory
A one-dimensional time series collected using quadrature detection is a vector z of complex values:
| [1] |
The DFT spectrum of z is given by w = DFT(z):
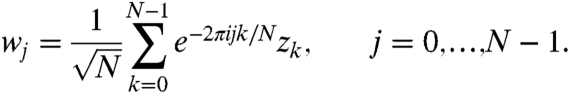 |
[2] |
If z contains an exponentially decaying sinusoid with frequency f and decay rate r,
| [3] |
then w will contain a peak centered at wj, where j = fN (for simplicity, we may assume that fN is an integer). However, if we throw away the imaginary components of z, leaving only the single-phase signal zsp,
| [4] |
the corresponding spectrum wsp will contain symmetrical peaks centered at both j = fN and j = (1 - f)N, as can be seen by replacing j with N - j and taking the complex conjugate in Eq. 2.
With RPD, we throw away one component from each element of z, but randomly select either the real or imaginary component:
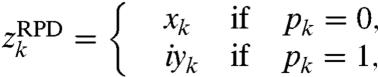 |
[5] |
where for each k, pk is set at random to either 0 or 1 (p is the sampling vector). The corresponding DFT spectrum, wRPD, will contain artifacts, owing to the missing data values, but it will have only one peak.
Fig. 1A shows a one-dimensional DFT spectrum for a synthetic simultaneous quadrature dataset containing a single exponentially decaying sinusoid. Fig. 1B shows the spectrum obtained using only the real component of the data [wsp = DFT(zsp)], illustrating the sign ambiguity attending single-phase detection. Fig. 1C shows the spectrum obtained using RPD. Although the sign ambiguity is lifted, significant sampling artifacts are apparent. Fig. 1D shows the spectrum obtained from the same data (zRPD) using maximum entropy (MaxEnt) reconstruction (39). MaxEnt reconstruction determines the spectrum having the maximum entropy subject to the constraint that the inverse DFT of the spectrum is consistent with the measured data (40). The sampling artifacts in Fig. 1D, which resemble those in C, are greatly reduced but not eliminated. [The ability of MaxEnt reconstruction and related methods to suppress sampling artifacts is limited by the presence of noise (41); the example here is unrealistic because the data contain no noise. Although in this case MaxEnt is capable of nearly complete elimination of the sampling artifacts, we purposely tempered the reconstruction here to demonstrate that, when sampling artifacts are not totally eliminated, they resemble dampened versions of the sampling artifacts present in the zero-augmented DFT spectrum.] The total amount of data employed in Fig. 1 B–D is one-half that of A.
Fig. 1.

One-dimensional spectra for synthetic data containing a single exponentially decaying sinusoid. (A) The real part of the DFT spectrum of the complex data vector. (B) The DFT spectrum obtained using only the real part of the synthetic data (wsp). (C) The DFT spectrum of the RPD data (wRPD). (D) The MaxEnt spectrum of the RPD data.
RPD is closely connected to NUS, but they are not the same. A nonuniformly sampled one-dimensional time series would be given by
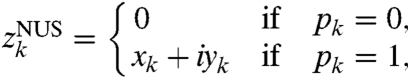 |
[6] |
where the pk values constitute the sampling schedule; equivalently, we have 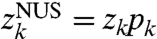 . By the Convolution Theorem, it follows that the NUS spectrum wNUS = DFT(zNUS) can be written as a convolution:
| [7] |
In this equation, DFT(p) can be regarded as a PSF.
However wRPD cannot be written as a convolution, because it is not true that 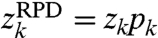 . In fact, there is no complex vector q (depending only on the sampling function p) such that
  .
.
Nevertheless, NUS and RPD share many properties, in particular, the ability to obtain a desired spectral resolution with fewer data values than conventional sampling would require. The benefits of RPD and NUS both come at the price of sampling artifacts in the spectrum. These artifacts can be suppressed, but not eliminated, by processing the data using non-Fourier methods. In addition, RPD and NUS need not be mutually exclusive. Single-phase detection with random choice of phase can be combined with nonuniform sampling in time.
These notions generalize to higher dimensions. In NMR, a two-dimensional time series is a matrix z of hypercomplex values (38, 42):
| [8] |
where i1 and i2 are distinct commuting imaginary units (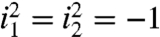 , i1i2 = i2i1) representing 90° phase shifts in the two time dimensions. An RPD time series zRPD with sampling matrix p is given by
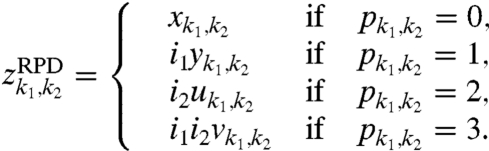 |
[9] |
The same approach extends to three or more dimensions.
Application of RPD to multidimensional NMR requires only slight modification of conventional methods. In a conventional n-dimensional NMR experiment, the real and imaginary components of the acquisition or real-time dimension (tn) are collected simultaneously by the spectrometer hardware. In the indirect dimensions (i.e., t1, t2,…,tn-1, the dimensions that are sampled parametrically rather than in real time), the various hypercomplex components are detected as 2n-1 separate complex time series (free induction decays, FIDs). To apply RPD in t1 through tn-1, one collects only a single FID for each time index k1,…,kn-1 according to the sampling function. The resulting dataset can be processed using the DFT in the normal way, if it is first expanded by inserting zeroes for the FIDs that were not acquired. Alternatively, to ameliorate the sampling artifacts that arise with DFT, the data can be processed by methods that do not assume that the nonsampled FIDs are zero, such as MaxEnt reconstruction.
Results
Fig. 2A illustrates a two-dimensional cross-section from a four-dimensional DFT spectrum for a C,N-NOESY simultaneous quadrature experiment on the first Dbl-homology domain (DH1) from the protein Kalirin. Fig. 2B is the same cross-section obtained by applying the DFT to a dataset consisting solely of the real/real/real components in the three indirect time dimensions selected from the same dataset used in A. Fig. 2 C and D illustrates the cross-section obtained using DFT and MaxEnt reconstruction, respectively, applied to a random-phase subset of the data. The amount of data employed in Fig. 2 B–D are one-eighth that employed in A.
Fig. 2.

Two-dimensional f1/f2 cross-sections from four-dimensional N,C-NOESY data for the DH1 domain of Kalirin. One-dimensional cross-sections parallel to the f1 axis at the f2 frequencies indicated by the colored lines are shown above/below each panel. A is from the two-dimensional DFT spectrum using quadrature detection in all dimensions. B is from the DFT spectrum obtained using only the real/real/real component from the three indirect time dimensions of the time domain data, analogous to Fig. 1B. (C and D) The DFT and MaxEnt spectra (respectively) obtained using RPD. B–D employ one-eighth the amount of data used in A.
Fig. 3 compares RPD to conventional NUS. Fig. 3 A and B depicts the DFT and MaxEnt spectra, respectively, for a two-dimensional NUS dataset in which 25% of the samples from a 64 × 64 hypercomplex matrix were randomly selected. Fig. 3 C and D depicts the DFT and MaxEnt spectra, respectively, for a two-dimensional RPD dataset. Both approaches employ the same number of samples. There is essentially no difference between the NUS and RPD spectra. It is noteworthy that the sampling artifacts in the two-dimensional DFT spectra are noticeably smaller than the sampling artifacts in the one-dimensional DFT spectrum (Fig. 1).
Fig. 3.

Comparison of NUS and RPD spectra for synthetic 2D data containing two positive and one negative components. (A) DFT and (B) MaxEnt spectra obtained using random NUS at 25% coverage of a 64 × 64 element hypercomplex dataset. (C) DFT and (D) MaxEnt spectra using RPD (equivalent to 25% coverage of the data). One-dimensional cross-sections through the spectra at the frequency indicated by the dashed line are shown above or below the corresponding contour plots. Contours in black are drawn at 10% of the highest peak and multiples of 1.4; contours in red are the negative of the black contours. Contours in green are at ± 2% of the maximum value.
For a fixed number of data samples, RPD improves resolution by a factor of 2 compared to quadrature or TPPI detection methods. The gain is illustrated in Fig. 4, which shows two-dimensional spectra obtained for a pair of synthetic sinusoids with similar frequencies. Fig. 4A is the result using quadrature detection and 64 samples in each dimension. Fig. 4B is the result of using RPD and 128 samples in each dimension. Although both A and B employed the same amount of data, the peaks are clearly resolved using RPD (B), but not using conventional quadrature detection (A).
Fig. 4.

Two-dimensional DFT spectra illustrating the improved resolution afforded by RPD for a fixed amount of data, using synthetic data consisting of two exponentially decaying sinusoids separated by 55 Hz in f2. The one-dimensional f2 cross-section through the peaks is superimposed. A corresponds to a 64 × 64 hypercomplex data matrix employing quadrature detection. B corresponds to a 128 × 128 hypercomplex data matrix employing RPD. The same amount of data are used in each panel.
Discussion
For linear methods of spectrum analysis (such as the DFT), the sensitivity of multidimensional experiments employing RPD is diminished by  for each dimension in which it is applied, relative to quadrature detection. The sensitivity per unit time, however, is unchanged. Because there is no time cost to performing simultaneous quadrature detection in real time when two detectors are available, RPD saves time only when applied in parametrically sampled (indirect) dimensions. Thus the time-saving benefits of RPD are mainly restricted to sampling-limited settings, rather than sensitivity-limited settings.
The properties of sampling artifacts associated with NUS can be derived from the properties of the PSF. Lustig et al. (22) showed that the standard deviation of the side-lobe-to-peak ratio (SPR) of the PSF for random sampling is given by
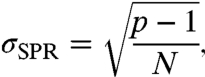 |
[10] |
where N is the number of samples and p is the sampling reduction factor G/N, with G the total number of grid points. The example in Fig. 3 shows that the sampling noise distributions associated with RPD and NUS have similar statistical properties.
Although the DFT can be applied to RPD data (as for NUS data), the attendant artifacts can be problematic. For multidimensional data, where the sampling artifacts tend to be less pronounced than in one dimension, or data in which the dynamic range (the difference between the strongest and weakest signal components) is low, the artifacts can be circumvented by simple thresholding of the DFT spectrum. In general, however, both RPD and NUS benefit from the use of non-Fourier methods of spectrum analysis (such as MaxEnt or l1-norm minimization; refs. 27 and 28) that can suppress sampling artifacts.
RPD and NUS can both be considered special cases of a more general data collection scheme in which arbitrary hypercomplex components are acquired for arbitrary subsets of sample times. This scheme affords greater freedom for tailoring the sampling for optimizing sensitivity or resolution or minimizing artifacts. Another possible generalization of RPD involves the phase of the samples; although the approach used here always collects data using phases of 0° or 90° (i.e., the real or imaginary components in each time dimension), in principle, one could acquire data at arbitrary intermediate phases. Just as with “off-grid” NUS sampling schemes (39), however, such datasets could not be processed with the DFT.
In conclusion, RPD reduces the number of samples required to discriminate frequency sign by a factor of 2 for each dimension in which it is employed. Conversely, RPD can be used to increase resolution by a factor of 2 for a fixed number of samples. RPD is applicable to any signal processing application that employs coherent detection, but for applications where coherent detection is employed in more than one dimension, such as multidimensional NMR spectroscopy or MRI, the benefits in decreased measurement time or improved resolution can be substantial. RPD, much like NUS, provides a fresh avenue for optimizing data collection in multidimensional NMR experiments to increase the information content of spectra or reduce data collection time. Because RPD and NUS are complementary, their combination affords the potential for improvements over either method alone.
Materials and Methods
Uniformly sampled 4D C,N-NOESY data were collected using a Varian 600 MHz instrument equipped with a cryogenic probe. We employed the heteronuclear multiple quantum coherence-NOESY-heteronuclear single quantum coherence pulse sequence implemented in the Varian BioPack pulse sequence library (gChmqcnoesyNhsqc). The NMR sample contained 0.6 mM of the Kalirin DH1 domain (pH 6.8), 50 mM Hepes buffer. The experiment was performed at 25 °C. Carrier frequencies, spectral widths, and the number of (complex) samples in each dimension were as follows: t4 (1H) 599.28 MHz, 7,843.137 Hz, 256 points; t3 (15N) 60.72 MHz, 1,336.07 Hz, 16 points; t2 (13C) 150.69 MHz, 9,343.61 Hz, 16 points; t1 (1H), 599.27 MHz, 7,843.14 Hz, 64 points.
DFT and MaxEnt reconstruction computations were performed using the Rowland NMR Toolkit. The software, which implements MaxEnt reconstruction for RPD, NUS, and joint RPD-NUS data, is available from the authors.
Acknowledgments.
We thank Prof. Martin Schiller for providing the Kalirin construct used to prepare the NMR sample, and Oksana Gorbatyuk for technical assistance preparing the sample. Support from the US National Institutes of Health is gratefully acknowledged (Grants GM047467 and RR020125).
Footnotes
Conflict of interest statement: The University of Connecticut has filed a provisional patent application on the method described in the manuscript.
This article is a PNAS Direct Submission.
References
- 1.Aggarwal K, Delsuc MA. Triangular sampling of multidimensional NMR data sets. Magn Reson Chem. 1997;35:593–596. [Google Scholar]
- 2.Barna JCJ, Laue ED. Conventional and exponential sampling for 2D NMR experiments with application to a 2D NMR spectrum of a protein. J Magn Reson. 1987;75:384–389. [Google Scholar]
- 3.Barna JCJ, Laue ED, Mayger MR, Skilling J, Worrall SJP. Exponential sampling: An alternative method for sampling in two dimensional NMR experiments. J Magn Reson. 1987;73:69–77. [Google Scholar]
- 4.Bodenhausen G, Ernst RR. The Accordion Experiment A simple approach to three-dimensional spectroscopy. J Magn Reson. 1981;45:367–373. [Google Scholar]
- 5.Coggins BE, Zhou P. Sampling of the NMR time domain along concentric rings. J Magn Reson. 2007;184:207–221. doi: 10.1016/j.jmr.2006.10.002. [DOI] [PMC free article] [PubMed] [Google Scholar]
- 6.Ding K, Gronenborn AM. Novel 2D triple-resonance NMR experiments for sequential resonance assignments of proteins. J Magn Reson. 2002;156:262–268. doi: 10.1006/jmre.2002.2537. [DOI] [PubMed] [Google Scholar]
- 7.Freeman R, Kupce E. New methods for fast multidimensional NMR. J Biomol NMR. 2003;27:101–113. doi: 10.1023/a:1024960302926. [DOI] [PubMed] [Google Scholar]
- 8.Hyberts SG, et al. Ultrahigh-resolution (1)H-(13)C HSQC spectra of metabolite mixtures using nonlinear sampling and forward maximum entropy reconstruction. J Am Chem Soc. 2007;129:5108–5116. doi: 10.1021/ja068541x. [DOI] [PMC free article] [PubMed] [Google Scholar]
- 9.Kim S, Szyperski T. GFT NMR, a new approach to rapidly obtain precise high-dimensional NMR spectral information. J Am Chem Soc. 2003;125:1385–1393. doi: 10.1021/ja028197d. [DOI] [PubMed] [Google Scholar]
- 10.Rovnyak D, et al. Accelerated acquisition of high resolution triple-resonance spectra using non-uniform sampling and maximum entropy reconstruction. J Magn Reson. 2004;170:15–21. doi: 10.1016/j.jmr.2004.05.016. [DOI] [PubMed] [Google Scholar]
- 11.Schmieder P, Stern AS, Wagner G, Hoch JC. Application of nonlinear sampling schemes to COSY-type spectra. J Biomol NMR. 1993;3:569–576. doi: 10.1007/BF00174610. [DOI] [PubMed] [Google Scholar]
- 12.Schmieder P, Stern AS, Wagner G, Hoch JC. Improved resolution in triple-resonance spectra by nonlinear sampling in the constant-time domain. J Biomol NMR. 1994;4:483–490. doi: 10.1007/BF00156615. [DOI] [PubMed] [Google Scholar]
- 13.Jaravine V, Ibraghimov I, Orekhov VY. Removal of a time barrier for high-resolution multidimensional NMR spectroscopy. Nat Methods. 2006;3:605–607. doi: 10.1038/nmeth900. [DOI] [PubMed] [Google Scholar]
- 14.Jaravine VA, Orekhov VY. Targeted acquisition for real-time NMR spectroscopy. J Am Chem Soc. 2006;128:13421–13426. doi: 10.1021/ja062146p. [DOI] [PubMed] [Google Scholar]
- 15.Jaravine VA, Zhuravleva AV, Permi P, Ibraghimov I, Orekhov VY. Hyperdimensional NMR spectroscopy with nonlinear sampling. J Am Chem Soc. 2008;130:3927–3936. doi: 10.1021/ja077282o. [DOI] [PubMed] [Google Scholar]
- 16.Kazimierczuk K, Kozminski W, Zhukov I. Two-dimensional Fourier transform of arbitrarily sampled NMR datasets. J Magn Reson. 2006;179:323–328. doi: 10.1016/j.jmr.2006.02.001. [DOI] [PubMed] [Google Scholar]
- 17.Kazimierczuk K, Misiak M, Stanek J, Zawadzka-Kazimierczuk A, Kozminski W. Generalized Fourier Transform for Non-Uniform Sampled Data. Heidelberg: Springer; 2011. pp. 1–46. (Topics in Current Chemistry). [DOI] [PubMed] [Google Scholar]
- 18.Kazimierczuk K, Zawadzka A, Kozminski W, Zhukov I. Lineshapes and artifacts in Multidimensional Fourier Transform of arbitrary sampled NMR datasets. J Magn Reson. 2007;188:344–356. doi: 10.1016/j.jmr.2007.08.005. [DOI] [PubMed] [Google Scholar]
- 19.Hoch JC, Stern AS. Maximum entropy reconstruction, spectrum analysis and deconvolution in multidimensional nuclear magnetic resonance. Methods Enzymol. 2001;338:159–178. doi: 10.1016/s0076-6879(02)38219-3. [DOI] [PubMed] [Google Scholar]
- 20.Barna JCJ, Tan SM, Laue ED. Use of CLEAN in conjunction with selective data sampling for 2D NMR experiments. J Magn Reson. 1988;78:327–332. [Google Scholar]
- 21.Bretthorst GL, Kotyk JJ, Ackerman JJ. 31P NMR Bayesian spectral analysis of rat brain in vivo. Magn Reson Med. 1989;9:282–287. doi: 10.1002/mrm.1910090214. [DOI] [PubMed] [Google Scholar]
- 22.Lustig M, Donoho D, Pauly JM. Sparse MRI: The application of compressed sensing for rapid MR imaging. Magn Reson Med. 2007;58:1182–1195. doi: 10.1002/mrm.21391. [DOI] [PubMed] [Google Scholar]
- 23.Malmodin D, Billeter M. Multiway decomposition of NMR spectra with coupled evolution periods. J Am Chem Soc. 2005;127:13486–13487. doi: 10.1021/ja0545822. [DOI] [PubMed] [Google Scholar]
- 24.Orekhov VY, Ibraghimov I, Billeter M. Optimizing resolution in multidimensional NMR by three-way decomposition. J Biomol NMR. 2003;27:165–173. doi: 10.1023/a:1024944720653. [DOI] [PubMed] [Google Scholar]
- 25.Tugarinov V, Kay LE, Ibraghimov I, Orekhov VY. High-resolution four-dimensional 1H–13C NOE spectroscopy using methyl-TROSY, sparse data acquisition, and multidimensional decomposition. J Am Chem Soc. 2005;127:2767–2775. doi: 10.1021/ja044032o. [DOI] [PubMed] [Google Scholar]
- 26.Werner-Allen JW, Coggins BE, Zhou P. Fast acquisition of high resolution 4-D amide-amide NOESY with diagonal suppression, sparse sampling and FFT-CLEAN. J Magn Reson. 2010;204:173–178. doi: 10.1016/j.jmr.2010.02.017. [DOI] [PMC free article] [PubMed] [Google Scholar]
- 27.Holland DJ, Bostock MJ, Gladden LF, Nietlispach D. Fast multidimensional NMR spectroscopy using compressed sensing. Angew Chem Int Ed Engl. 2011;50:6548–6551. doi: 10.1002/anie.201100440. [DOI] [PubMed] [Google Scholar]
- 28.Kazimierczuk K, Orekhov VY. Accelerated NMR spectroscopy by using compressed sensing. Angew Chem Int Ed Engl. 2011;50:5556–5559. doi: 10.1002/anie.201100370. [DOI] [PubMed] [Google Scholar]
- 29.Hoch JC, Maciejewski MW, Filipovic B. Randomization improves sparse sampling in multidimensional NMR. J Magn Reson. 2008;193:317–320. doi: 10.1016/j.jmr.2008.05.011. [DOI] [PMC free article] [PubMed] [Google Scholar]
- 30.Kazimierczuk K, Zawadzka A, Kozminski W, Zhukov I. Random sampling of evolution time space and Fourier transform processing. J Biomol NMR. 2006;36:157–168. doi: 10.1007/s10858-006-9077-y. [DOI] [PubMed] [Google Scholar]
- 31.Pannetier N, Houben K, Blanchard L, Marion D. Optimized 3D-NMR sampling for resonance assignment of partially unfolded proteins. J Magn Reson. 2007;186:142–149. doi: 10.1016/j.jmr.2007.01.013. [DOI] [PubMed] [Google Scholar]
- 32.Candes E, Romberg J, Tao T. Robust uncertainty principles: Exact signal reconstruction from highly incomplete frequency information. IEEE Trans Inf Theory. 2006;52:489–509. [Google Scholar]
- 33.Donoho DL. Compressed sensing. IEEE Trans Inf Theory. 2006;52:1289–1306. [Google Scholar]
- 34.Bretthorst GL. Nonuniform sampling: Bandwidth and aliasing. Concepts Magn Reson Part A Bridg Educ Res. 2008;32A:417–435. [Google Scholar]
- 35.Maciejewski MW, Qui HZ, Rujan I, Mobli M, Hoch JC. Nonuniform sampling and spectral aliasing. J Magn Reson. 2009;199:88–93. doi: 10.1016/j.jmr.2009.04.006. [DOI] [PMC free article] [PubMed] [Google Scholar]
- 36.Hoch JC, Stern AS. NMR Data Processing. New York: Wiley-Liss; 1996. pp. 12–15. [Google Scholar]
- 37.Marion D, Wüthrich K. Application of phase sensitive two-dimensional correlated spectroscopy (COSY) for measurement of 1H–1H spin-spin coupling constants in proteins. Biochem Biophys Res Commun. 1983;113:967–974. doi: 10.1016/0006-291x(83)91093-8. [DOI] [PubMed] [Google Scholar]
- 38.States DJ, Haberkorn RA, Ruben DJ. A two-dimensional nuclear Overhauser experiment with pure absorption phase in four quadrants. J Magn Reson. 1982;48:286–292. [Google Scholar]
- 39.Mobli M, Hoch JC. Maximum entropy spectral reconstruction of nonuniformly sampled data. Concepts Magn Reson Part A Bridg Educ Res. 2008;32A:436–448. doi: 10.1002/cmr.a.20126. [DOI] [PMC free article] [PubMed] [Google Scholar]
- 40.Laue ED, Skilling J, Staunton J, Sibisi S, Brereton RG. Maximum entropy method in nuclear magnetic resonance spectroscopy. J Magn Reson. 1985;62:437–452. [Google Scholar]
- 41.Mobli M, Hoch JC, King GF. Fast acquisition methods in multidimensional NMR. In: Dingley AJ, Pascal SM, editors. Advances in Biomedical Spectroscopy. Amsterdam: IOS Press; 2011. pp. 305–337. [Google Scholar]
- 42.Delsuc MA. Spectral representation of 2D NMR spectra by hypercomplex numbers. J Magn Reson. 1988;77:119–124. [Google Scholar]