Abstract
Silica optical microcavity sensors show great promise in the kinetic evaluation of binding pairs, fundamental in understanding biomolecular interactions. Here, we develop and demonstrate a novel platform, based on bioconjugated silica microsphere resonators, to study the binding kinetics of the biotin-streptavidin system. We characterize the optical performance, verify the covalent attachment of biotin to the surface, and perform streptavidin detection experiments. We perform preliminary kinetic analysis of the detection data which shows the potential of whispering gallery mode resonators in the determination of the dissociation constant of the binding pair, which is in good agreement with previously published values.
The binding site affinity of an enzyme or antibody (i.e., its ability to bind to its specific complement), determines its utility in a given application. For example, in designing therapeutics, a strong affinity for a specific target is desired to maximize the effectiveness of the therapeutic.1 Conversely, in immunoassay applications, a tunable affinity is often desired to enable sensor reusability.2 Therefore, it is not surprising that the study of binding site affinities is of great scientific and industrial importance. In order to fully characterize the binding site affinity, it is necessary to perform measurements using both free and fixed molecules. However, while there are numerous methods for determining the affinity with free molecules, the approaches for fixed molecules are limited.2
The primary approach for fixed molecule characterization is based on surface plasmon resonance (SPR) sensors. This technique relies on the decaying evanescent optical field generated by the SPR, which is established at the interface of a metal film and the solution, and is approximately ∼50 nm long.3 When a molecule is located within the evanescent field, it modifies the effective refractive index. This change is detected as an increase in the SPR wavelength. While current SPR systems are ideal for characterizing single interaction pairs, they often experience difficulties resolving multi-valent interactions. This limitation is a result of the short interaction time between the photon and the molecule, limited bioconjugation protocols for attachment of one half of the binding pair to metal surfaces, and restricted mass transport across the sensor surface.3
An alternative evanescent wave technique whose detection capability arises from changes in the refractive index is based on silica whispering gallery mode optical resonant cavities.4 Previous research using microsphere optical cavities has demonstrated the detection of proteins and single virus, emphasizing the potential diagnostics or detection applications.5 Therefore, the ability of a resonant cavity to perform ultra-sensitive detection experiments has been well-established.4 In these devices, the evanescent wave is established by a circulating optical field, which is characterized by the photon lifetime inside the cavity or the quality factor (Q). Ultra high-Q devices (Q > 100 × 106) can have photon lifetimes in excess of 100 ns in the visible spectrum.6 These long photon lifetimes result in a single photon interacting with a bound molecule over 100 000 times, substantially increasing the sensitivity. Additionally, the silica cavity has two advantages over the SPR sensor. First, the refractive index contrast between the cavity and the environment is reduced, resulting in a significantly longer evanescent tail (∼100 nm as compared to ∼50 nm, at the same wavelength). This allows the optical cavity to probe a much larger region and to study larger molecules.7 Second, a wide variety of surface chemistries are already established for silica. Therefore, by combining a high Q cavity with a covalent surface functionalization, it is possible to perform very accurate kinetic measurements.4
In the present work, we illustrate the potential for using silica microsphere cavities to measure the binding kinetics of the streptavidin-biotin pair. We enable the specific targeting of streptavidin through immobilization of one half of the binding pair on the sensor surface and, subsequently, verify the bioactivity of this probe molecule. Throughout the functionalization process, we monitor the quality factor of the microcavity, to ensure that the process does not degrade the optical performance of the device. Finally, we perform the detection experiments and kinetic analysis.
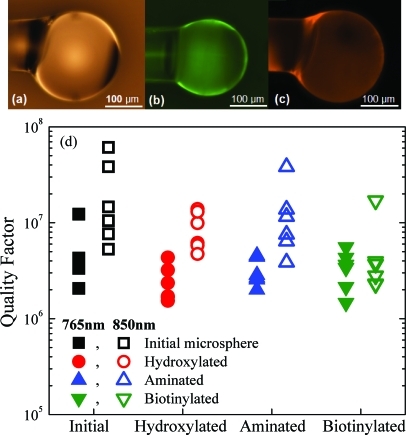
The silica microsphere resonant cavities used in this study were fabricated by heating the tip of an optical fiber with a CO2 laser (Fig. 1a).6 The microspheres were then functionalized with biotin probe molecules through a three-step covalent attachment process: hydroxylation, amination, and finally biotinylation of the surface.8, 9 The surface is hydroxylated using an oxygen plasma treatment, aminated through vapor deposition of aminopropyltrimethoxysilane, and biotinylated through exposure to N-hydroxysuccinimide-biotin dissolved in dimethylsulfoxide (DMSO).8, 9 To characterize the surface chemistry of these functionalized devices, widefield fluorescence microscopy was performed to confirm the uniformity and the bioactivity of the bioconjugation technique. Fluorescein isothiocyanate (FITC) was used to label the amine groups on the surface of the microsphere after the second step of the functionalization (Fig. 1b), while avidin-Texas Red was used to label the biotin groups after the third and final steps of the functionalization process (Fig. 1c).9 Additionally, a fluorescence intensity study was performed to evaluate the stability of the biotin attachment over the course of 60 days in order to ensure stability of the probe molecule on the sensor surface.8, 9
Figure 1.
(Color) Surface chemistry and optical performance of the resonant cavity. (a) Optical image of the silica microsphere, (b) fluorescent image of an amine-terminated microsphere labeled with FITC, (c) fluorescent image of a biotinylated microsphere labeled with avidin-Texas Red, and (d) the quality factor of the microsphere optical resonators after each step in the functionalization process measured at 765 nm and 850 nm.
The optical performance or Q factor was determined for 12 microcavities after each step in the functionalization process. The microcavities were coupled to a pair of tunable diode lasers centered at 765 nm and 850 nm using tapered optical fibers.6 Low input power and coupling were used to minimize non-linear effects (broadening of the linewidth) during detection. The linewidth (full width at half-maximum or Δλ) was recorded in the under-coupled regime, and the Q factor was determined using a simple mode coupling model.9 As can be observed in Figure 1d, the functionalization process has minimal impact on the Q of the cavity, thus enabling both specific and sensitive detection of binding kinetics.
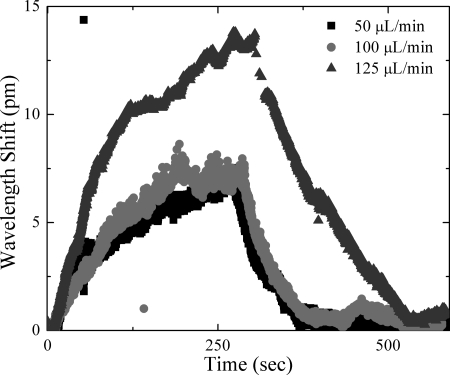
After complete functionalization of the microsphere optical cavities, detection experiments were performed using the 765 nm laser. A low input and coupled power was used to minimize the thermal broadening which results from a non-ideal overlap of the optical field with the buffer.10 A syringe pump flowed 1 mL of a 1 nM streptavidin solution into an aqueous environment surrounding the functionalized microsphere. Three different injection rates were used to explore the possibility of mass transport limitations in detection. All other parameters were held constant (Q factor, scan rate, scan speed, sphere diameter, etc). The resonant frequency was continuously monitored during injection and was automatically recorded on a custom LabVIEW program.9 These detection experiments were performed several times, and similar results were obtained for each flow rate. A representative data set is plotted in Figure 2.
Figure 2.
(Color online) Association and dissociation curves using 1 nM streptavidin solution at three separate flow rates of 50, 100, and 125 μL∕min.
The strength of the biotin-streptavidin interaction can be approximated by a reversible bimolecular reaction, which allows the dissociation constant (kd) to be calculated through the linearization of the dissociation phase from the resonant peak shift data using the following equation:11
| (1) |
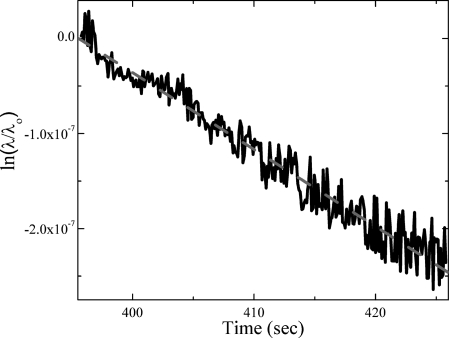
In the above equation, λo is the wavelength at the beginning of the dissociation phase and λ(t) is the wavelength as a function of time. We determined the kd of our immobilized biotin-streptavidin system from the slope of this line to be on the order of 10−9 for all three flow rates. Specifically, the kd was calculated to be 8.27E-9, 7.58E-9, and 5.70E-9 for streptavidin flow rates of 50, 100, and 125 μL∕min, respectively. Figure 3 shows the fit for the 50 μL∕min sample, which is a representative fit for all three flow rates as the standard error in the calculated kd is on the order of 10−10. It is noted that our kd value reported through this series of experiments is higher than the dissociation rate of the biotin-streptavidin system in solution, which is conventionally assumed to be on the order of 10−13 to 10−14.12, 13 However, it has been shown that the kd values for the surface-immobilized probe-ligand systems are typically several orders of magnitude larger, and values as high as 10−7 have been recorded for immobilized biotin-streptavidin systems.11, 14 This significant difference in binding behavior suggests that steric hindrance plays a role in the interaction of the binding pair when one half is immobilized.9, 11, 15, 16 Additionally, prior literature shows that the dissociation constant for this binding pair can vary significantly depending on the specific environment and test conditions during association and dissociation phases, as expected.11, 15, 16
Figure 3.
(Color online) Linear fit of ln(λ∕λo) during the dissociation phase of the curve taken at a flow rate of 50 μL∕min.
In addition to calculating the dissociation constant, the association constant (ka) can also be calculated. To do this, however, requires the deconvolution of environmental effects, such as transport phenomena and steric hindrance, from the binding events.15, 16 Although this has been extensively studied by researchers using SPR sensors, mass transport limitations have not received similar attention by whispering gallery mode device researchers. However, in the present series of experiments, we observed a dependence of the sensing signal on the fluid flow rate, indicating that there are mass transport effects during the association phase (Fig. 2). Specifically, the wavelength change during the injection period is directly a result of the flow rate of injection, indicating mass transport limitations are hindering the association of the streptavidin with immobilized biotin. By adding a transport constant and performing experiments over a wide range of flow rates and concentrations, it would possible to correct for these effects and to accurately determine the ka.14, 16 Additionally, as the majority of previous experiments with microspheres have been performed in non-flowing or stagnant solutions, optimizing the flow rate could provide a route to improve the collection efficiency or the detection ability of microsphere sensors. Results of flow rate optimization experiments would have a wide range of applications including, but not limited to, the arena of binding kinetics. In addition to mass transport limitations in the present system, there is steric hindrance as a result of a high density of biotin binding sites on the sensor surface.11, 15, 16 Such overcrowding has been shown to result in reduced association rates and higher dissociation rates.11 By tailoring the density of binding sites, it will be possible to de-convolve these effects from the binding data.
In summary, this work demonstrates the ability of whispering gallery mode resonators to determine the dissociation constant of the biotin-streptavidin binding pair and to act as probes for the presence of environmental phenomena, such as mass transport effects and kinetic detection experiments. This research involved the development of a covalent attachment strategy for binding probe molecules to a silica optical microsphere resonator, as well as kinetic measurements during label-free detection of target molecules. Specifically, a protocol for covalently attaching biotin to microsphere surfaces was developed and verified using fluorescence microscopy, and the lifetime of the active site was characterized. A series of bioconjugated microspheres was fabricated and demonstrated Q values greater than 1 × 10⁶. Using these functionalized devices, binding kinetics measurements on the biotin-streptavidin system were performed, and the kd of the interaction was found using a simple linearization of the dissociation phase. Our measured value is in good agreement with previously demonstrated kd values when biotin is substrate-bound.11, 13 Additionally, mass transport limitations were observed, indicating that the maximum sensor signal is dependent on the fluid flow, thus providing a mechanism to tune the sensor response. This approach to measuring binding kinetics will find numerous applications, including therapeutics development, immunoassay design, and fundamental biological investigations.1, 2, 17
Acknowledgments
The authors thank Matthew Reddick for the development of the LabVIEW program for data acquisition. This work was supported by the National Science Foundation [Grant Nos. 085281 and 1028440] and the National Institutes of Health through NIH Director’s New Innovator Award Program [No. 1DP2OD007391-01].
References
- Morin A., Meiler J., and Mizoue L. S., Trends Biotechnol. 29(4 ), 159 (2011). 10.1016/j.tibtech.2011.01.002 [DOI] [PMC free article] [PubMed] [Google Scholar]
- Jing M. and Bowser M. T., Anal. Chim. Acta 686(1–2 ), 9 (2011). 10.1016/j.aca.2010.10.032 [DOI] [PMC free article] [PubMed] [Google Scholar]
- Liedberg B., Nylander C., and Lundstrom I., Sensors Actuators 4(2 ), 299 (1983) 10.1016/0250-6874(83)85036-7 [DOI] [Google Scholar]; Abbas A., Linman M. J., and Cheng Q. A., Biosens. Bioelectron. 26(5 ), 1815 (2011). 10.1016/j.bios.2010.09.030 [DOI] [PMC free article] [PubMed] [Google Scholar]
- Hunt H. K. and Armani A. M., Nanoscale 2(9 ), 1544 (2010) 10.1039/c0nr00201a [DOI] [PubMed] [Google Scholar]; Erickson D., Mandal S., Yang A. H. J., and Cordovez B., Microfluid. Nanofluid. 4(1–2 ), 33 (2008). 10.1007/s10404-007-0198-8 [DOI] [PMC free article] [PubMed] [Google Scholar]
- Ilchenko V. S. and Maleki L., Proc. SPIE 4270, 120 (2001) 10.1117/12.424663 [DOI] [Google Scholar]; Vollmer F., Arnold S., and Keng D., Proc. Natl. Acad. Sci. U.S.A. 105, 52 (2008). 10.1073/pnas.0808988106 [DOI] [PMC free article] [PubMed] [Google Scholar]
- Gorodetsky M. L., Savchenkov A. A., and Ilchenko V. S., Opt. Lett. 21(7 ), 453 (1996). 10.1364/OL.21.000453 [DOI] [PubMed] [Google Scholar]
- Freeman L. M., Li S., Dayani Y., Choi H. S., Malmstadt N., and Armani A. M., Appl. Phys. Lett. 98(15 ), 143703 (2011). 10.1063/1.3576908 [DOI] [PMC free article] [PubMed] [Google Scholar]
- Hunt H. K., Soteropulos C., and Armani A. M., Sensors 10 (10 ), 9317 (2010). 10.3390/s101009317 [DOI] [PMC free article] [PubMed] [Google Scholar]
- See supplementary material at http://dx.doi.org/10.1063/1.3634023 for additional figures and details.
- Armani A. M., Kulkarni R. P., Fraser S. E., Flagan R. C., and Vahala K. J., Science 317, 783 (2007). 10.1126/science.1145002 [DOI] [PubMed] [Google Scholar]
- Zhao S. and Reichert W. M., Langmuir 8(11 ), 2785 (1992). 10.1021/la00047a034 [DOI] [Google Scholar]
- Green N. M., Methods Enzymol. 184, 51 (1990). 10.1016/0076-6879(90)84259-J [DOI] [PubMed] [Google Scholar]
- Hermanson G. T., Bioconjugate Techniques, 2 ed. (Academic, London, 2008). [Google Scholar]
- Chaiken I., Rosé S., and Karlsson R., Anal. Biochem. 201(2 ), 197 (1992). 10.1016/0003-2697(92)90329-6 [DOI] [PubMed] [Google Scholar]
- Myszka D. G., Curr. Opin. Biotechnol. 8(1 ), 50 (1997). 10.1016/S0958-1669(97)80157-7 [DOI] [PubMed] [Google Scholar]
- Schuck P., Annu. Rev. Biophys. Biomol. Struct. 26, 541 (1997) 10.1146/annurev.biophys.26.1.541 [DOI] [PubMed] [Google Scholar]; Schuck P. and Minton A. P., Anal. Biochem. 240(2 ), 262 (1996). 10.1006/abio.1996.0356 [DOI] [PubMed] [Google Scholar]
- Cho J. H., Muralidharan V., Vila-Perello M., Raleigh D. P., Muir T. W., and Palmer A. G., Nat. Struct. Mol. Biol. 18(5 ), 550 (2011). 10.1038/nsmb.2039 [DOI] [PMC free article] [PubMed] [Google Scholar]


