

Abstract
Objective
We investigated a neural basis of speech-in-noise perception in older adults. Hearing loss, the third most common chronic condition in older adults, is most often manifested by difficulty with understanding speech in background noise. This trouble with understanding speech in noise, which occurs even in individuals who have normal hearing thresholds, may arise, in part, from age-related declines in central auditory processing of the temporal and spectral components of speech. We hypothesized that older adults with poorer speech-in-noise (SIN) perception demonstrate impairments in the subcortical representation of speech.
Design
In all participants (28 adults, ages 60 to 73 years), average hearing thresholds calculated from 500 to 4000 Hz were ≤ 25 dB HL. The participants were evaluated behaviorally with the Hearing in Noise Test (HINT) and neurophysiologically using speech-evoked auditory brainstem responses recorded in quiet and in background noise. The participants were divided based on their HINT scores into top and bottom performing groups that were matched for audiometric thresholds and IQ. We compared brainstem responses in the two groups, specifically, the average spectral magnitudes of the neural response and the degree to which background noise affected response morphology.
Results
In the quiet condition, the bottom SIN group had reduced neural representation of the fundamental frequency of the speech stimulus and an overall reduction in response magnitude. In the noise condition, the bottom SIN group demonstrated greater effects of noise, which may reflect reduction in neural synchrony. All physiologic measures correlated with SIN perception.
Conclusion
Adults in the bottom SIN group differed from the audiometrically-matched top SIN group in how speech was neurally encoded. The strength of subcortical encoding of the fundamental frequency appears to be a factor in successful speech-in-noise perception in older adults. Given the limitations of amplification for improving central auditory processing, our results indicate the need for inclusion of auditory training in intervention plans for older adults with SIN perception difficulties.
Keywords: Aging, Central, Brainstem, Speech-in-Noise Perception
Introduction
Older adults1 frequently report having difficulty understanding speech in background noise. Peripheral hearing loss explains some of this difficulty; in fact, hearing impairment ranks third among chronic conditions in older adults (aged 65 and above) after hypertension and arthritis (Yueh et al., 2003). Yet, speech-in-noise (SIN) perception difficulty can be present in older adults who have normal audiometric thresholds (Cruickshanks et al., 1998; Gordon-Salant & Fitzgibbons, 1993). The audiogram fails to accurately predict speech recognition performance for all age groups, particularly in background noise (Killion & Niquette, 2000; Souza, 2007). The relationship between pure-tone thresholds and SIN perception is even weaker in the older population (Dubno, 1984; Hargus & Gordon-Salant, 1995; Kim et al., 2006), with word recognition scores in background noise falling below predicted scores by increasing amounts from middle to older adult ages (Souza et al., 2007).
The factors contributing to SIN perception difficulties are not well understood. Deficits in cognitive processing contribute to the problems experienced by older adults when listening in noise (Frisina & Frisina, 1997; Gordon-Salant & Fitzgibbons, 1997; Tremblay et al., 2002; Tun et al., 2002). For example, older adults are more vulnerable to the distracting effects of semantic content in background noise than younger adults, indicating that cognitive factors contribute to their SIN perception difficulties (Tun et al., 2002). Age-related sensory declines, including those in SIN perception, may be accompanied by increased activation in more general cognitive regions (i.e., working memory and attention) as a means of compensating for these declines (Wong et al., 2009). Therefore, older adults who have experienced losses in memory or attention are especially affected by decreases in sensory perception (Shinn-Cunningham & Best, 2008).
SIN perception may also be affected by changes in central auditory processing. Aging affects the ability to process pitch cues (Helfer & Vargo, 2009). Given that pitch is an important cue for speaker identification and object formation, this deficit may interfere with the older listener’s ability to follow a single voice from among a stream of competing voices (Oxenham, 2008; Shinn-Cunningham & Best, 2008). Older adults are unable to benefit from voicing cues as effectively as younger adults in an informational masking task (Helfer, 2008; Huang et al., 2010). A possible deficit in frequency representation is supported by reduced frequency following responses (FFRs) to tone bursts, as well as increased frequency discrimination difference limens in older adults compared to younger adults (Clinard et al., 2010).
Age-related changes have been found in temporal processing. Declines in temporal resolution, as measured by gap detection, have been found in both animal (Walton et al., 1998) and human studies on aging (Harris et al., 2010; He et al., 1999; Ross et al., 2010; Walton, 2010), and gap detection is related to SIN perception (Feng et al., 2010; Gordon-Salant & Fitzgibbons, 1993). Precise representation of neural timing is important for capturing fast changing acoustic transitions that characterize consonants. Older adults demonstrate auditory brainstem response offset timing delays to a speech syllable compared to younger adults (Vander Werff & Burns, 2011). Furthermore, older adults have impaired neural representation of voice-onset-time contrasts, indicating that some of the SIN perception difficulties experienced by older adults may arise from impaired temporal resolution in the central auditory system (Tremblay et al., 2003). Accurate subcortical representation of temporal information (as assessed by peak timing) is known to contribute to SIN perception in young adults and children (Anderson et al., 2010a; Hornickel et al., 2011; Hornickel et al., 2009; Kraus et al., 1995; Parbery-Clark et al., 2009; Skoe et al., 2011; Tzounopoulos & Kraus, 2009). Therefore, age-related decreases in temporal processing may lead to impairments in SIN perception.
The auditory brainstem response to speech stimuli (sABR) is ideal for the assessment of auditory processing mechanisms associated with SIN perception (as reviewed in Anderson & Kraus, 2010). The clear relationship between the stimulus and brainstem response waveforms allows for the direct comparison of the frequency and timing components of the stimulus and the response (Galbraith et al., 1995; Skoe & Kraus, 2010). Previous work has demonstrated relationships between SIN perception and the temporal and spectral components of the sABR in both children (Anderson, Skoe, Chandrasekaran, & Kraus, 2010; Anderson, Skoe, Chandrasekaran, Zecker et al., 2010; Chandrasekaran et al., 2009; Hornickel et al., 2009; Skoe et al., 2011; Hornickel et al., 2011) and young adults (Parbery-Clark et al., 2009; Song et al., 2010). Subcortical encodingof the fundamental frequency (F0) of the stimulus, an important cue in the perception of pitch (Fellowes et al., 1997; Meddis & O’Mard, 1997), appears to play a role in SIN perception, with better SIN perception linked to greater F0 magnitudes in the sABR (Anderson, Skoe, Chandrasekaran, Zecker et al., 2010; Song et al., 2010). Likewise, greater degradation of brainstem responses to speech presented in background noise, as evidenced by delayed peak timing and reduced morphology, is associated with poor SIN perception (Anderson, Skoe, Chandrasekaran, & Kraus, 2010; Anderson, Skoe, Chandrasekaran, Zecker et al., 2010; Alexandra Parbery-Clark et al., 2009; Song et al., 2010). We therefore hypothesized that older adults with better SIN perception would have greater representation of the F0 in the sABR, and would have less response changes in the presence of noise than an audiometrically-matched group with poorer SIN perception.
Materials and Methods
Participants
Twenty-eight older participants (ages 60 to 73; 15 females; mean = 63.1; SD = 3.83) were recruited from Chicago, IL and surrounding communities. Audiometric air-conduction thresholds were obtained at octave intervals from 125 to 12,000 Hz and bone conduction thresholds were obtained from 500 to 4000 Hz. In all participants, pure-tone averages (calculated as the average threshold from 500 to 4000 Hz) were ≤ 25 dB HL. No individual threshold was greater than 40 dB at or below 4000 Hz or greater than 60 dB above 4000 Hz, and conductive hearing loss (air-bone gap ≥ 15dB) was not present at 2 or more frequencies in either ear. Participants had no history of neurological disorders nor asymmetric pure-tone thresholds (defined as >15 dB difference at 2 or more frequencies between ears), and had normal click-evoked auditory brainstem responses (defined as a wave V latency of ≤ 6.8 ms at 80 dB SPL presented at a rate of 31.25 Hz). All participants had normal cognitive abilities as measured by IQs ≥ 95 on the Wechsler Abbreviated Scale of Intelligence (WASI; Zhu and Garcia, 1999). All procedures were approved by the Northwestern University Institutional Review Board.
Speech in Noise
SIN perception was assessed using the Hearing in Noise Test (HINT; Bio-logic Systems Corp., Mundelein, IL). HINT is an adaptive, widely used clinical test that uses phonetically balanced Bamford-Kowal-Bench (BKB) sentences (Bench, Kowal, & Bamford, 1979) superimposed on a fixed speech-shaped noise masker. The sentences are presented at varying signal-to-noise ratios (SNRs). The speech reception threshold is determined by the SNR at which the participants repeat the sentences correctly 50% of the time. Lower and more negative SNR thresholds indicate the ability to repeat sentences in higher levels of noise. Both the sentences and speech-shaped noise are delivered binaurally through insert earphones. Participants with hearing loss (thresholds greater than 20 dB HL at any frequency from 250 to 8000 Hz; n = 12) were tested in the standard unaided condition as well as the aided condition supplied by the HINT software. The aided condition compensated for reduced audibility by applying gain to the sentences (National Acoustics Laboratories-Revised; Byrne & Dillon, 1986) according to each individual’s air-conduction thresholds.
Participant Groups
The participants were grouped according to their HINT scores using aided scores when applicable for those with hearing loss. The participants’ HINT scores formed a normal distribution around the mean of −2.69 dB SNR (SD = 0.92). Fourteen participants (7 females) who scored better than the median (< −2.75 dB SNR) were placed in the top SIN group and the other fourteen (8 females) who performed worse (> −2.75 dB SNR) in the bottom SIN group. The two groups did not differ in age, working memory (cluster score obtained from 2 subtests of the Woodcock-Johnson III Test of Cognitive Abilities, Numbers Reversed and Auditory Working Memory; Woodcock et al., 2001), IQ, pure-tone average, click-ABR wave V latency, or hearing thresholds (See Table 1 for means and SDs and Figure 1 for audiogram displaying mean audiometric thresholds for each group).
Table 1.
The means and standard deviations for top and bottom SIN groups as well as p-values for group differences are listed for HINT-Front scores, pure-tone averages (.5 to 4 kHz), age, click wave V latencies, WASI IQ standard scores, and Woodcock-Johnson III Working Memory standard scores.
| HINT dB (SNR) | PTA for (.5–4kHz) dB HL | Age (Years) | Click Latency Wave V (ms) | WASI IQ (Standard Score) | Working Memory (Standard Score) | |
|---|---|---|---|---|---|---|
|
Total Group Mean (SD) |
−2.69 (.92) | 13.71 (6.01) | 63 (3.83) | 6.04 (.31) | 122 (11.21) | 115 (14.74) |
|
Top SIN Mean (SD) |
−3.40 (.54) | 1.45 (2.37) | 62 (3.24) | 6.03 (.33) | 123 (11.32) | 111(13.64) |
|
Bottom SIN Mean (SD) |
−1.99 (.64) | 2.13 (4.21) | 64 (4.31) | 6.04 (.31) | 120 (10.67) | 119(14.97) |
| p - value | < 0.001 | 0.538 | 0.265 | 0.959 | 0.391 | 0.119 |
Figure 1.
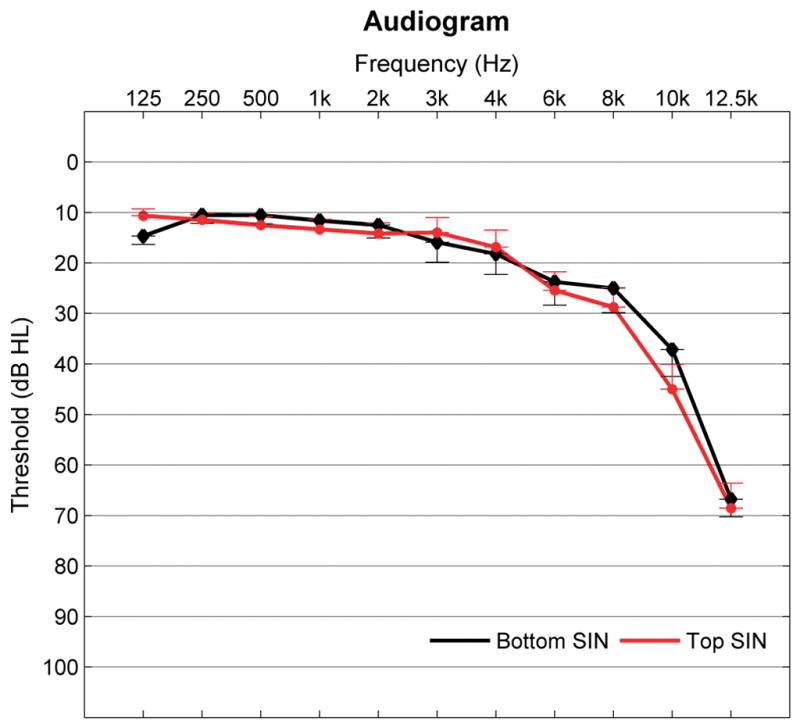
Mean pure tone thresholds (average of right and left) for top and bottom SIN groups from 125 to 12.5 kHz. No significant group differences were noted at any frequency. Error bars equal 1 standard error of measurement (SEM).
Stimuli for Neurophysiologic Recordings
For the sABR procedure, the speech stimulus was a syllable [da] synthesized at 20 kHz using a Klatt synthesizer (Klatt, 1980) with a duration of 170 ms. This syllable consisted of a 50-ms transition (from the stop burst of [d] to [a]) followed by a 120-ms unchanging steady-state region corresponding to the vowel [a]. After an initial 5 ms stop burst, the voicing remained constant at the F0 of 100 Hz. During the consonant-vowel transition, the lower three formants shifted linearly (F1: 400 to 720 Hz; F2: 1700 to 1240 Hz; F3: 2580 to 2500 Hz) and then reached a plateau during the steady-state region, while the upper three remained constant (F4: 3330 Hz; F5: 3750 Hz; F6: 4900 Hz) for the entire syllable.
The background noise stimulus was created from syntactically correct, nonsense English sentences spoken by six talkers (four females) in a conversational style. This 45-ms track (16 kHz sampling rate) was looped for the duration of the condition without pause. Consequently, the onset of the [da] coincided with different regions of the babble over the course of the condition. The [da] (with an interstimulus inverval of 83 ms) was played at a SNR of +10 dB relative to the 70 dB SPL noise. Both the [da] and the noise stimuli were presented to the participants binaurally through insert earphones (ER-3, Etymotic Research, Elk Grove Village, IL) using NeuroScan Stim2 stimulus presentation software (NeuroScan Compumedics Inc., Charlotte, NC). See Figure 2 for the stimulus waveform and grand average responses and spectra to the stimulus presented in quiet and in noise conditions. In order to compensate for an individual’s hearing loss (defined as thresholds greater than 20 dB at any frequency from 250 to 6000 Hz), the NAL-R formula was used to selectively amplify frequencies of the stimulus based on the individual’s hearing thresholds. Stimulus compensation was performed by MATLAB-coded routines (The MathWorks, Inc., Natick, MA) to create binaural stimuli amplified individually for each ear. Brainstem responses were collected with a binaural vertical montage with the active electrode placed at Cz, linked earlobes serving as reference and forehead as the ground electrode. Responses were recorded using NeuroScan Acquire 4 at a sampling rate of 20 kHz. In order to maintain participant cooperation and a relaxed state, participants watched muted subtitled movies of their choice. The recording sessions lasted for approximately two hours. All brainstem responses were collected in a sound-proof, electrically-shielded booth.
Figure 2.
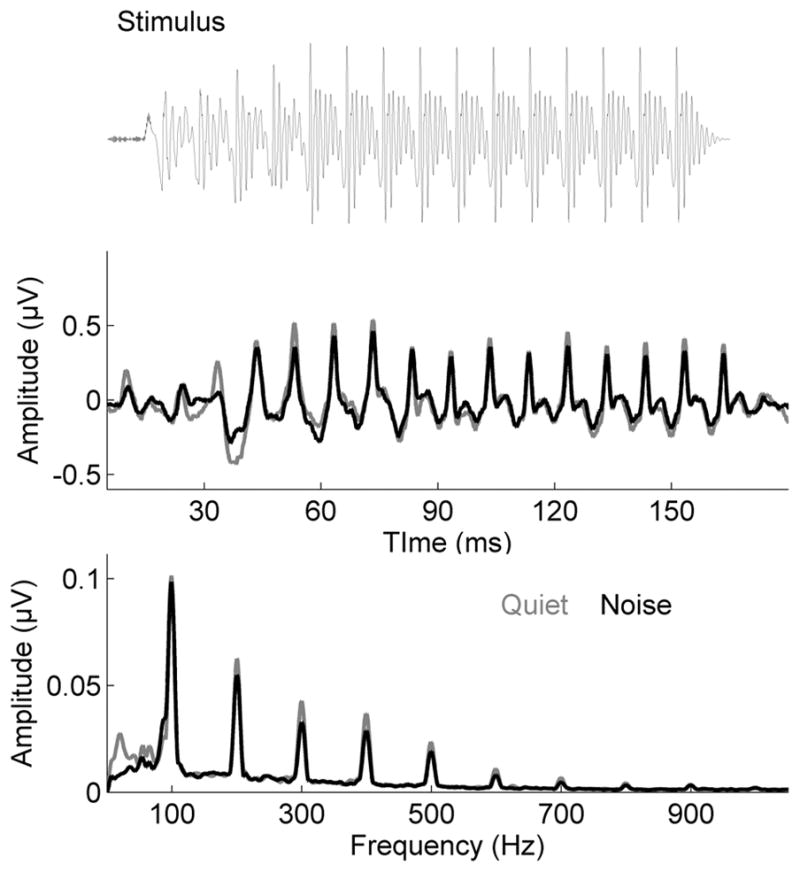
Top: The stimulus waveform of the speech syllable [da]. Middle: Grand average response waveforms to the speech syllable [da] (N=28) in quiet (gray) and noise (black). Bottom: Grand average frequency spectra of brainstem responses to the speech syllable [da] in quiet (gray) and noise (black) contain energy at the fundamental frequency (F0 = 100 Hz) and integer multiples up to 1000 Hz.
The [da] stimulus was presented in alternating, opposite polarities. After obtaining sub-average responses to each polarity, the subaverages were added together to minimize contamination of the data by the cochlear microphonic and stimulus artifact (Gorga, Abbas, & Worthington, 1985; Russo, Nicol, Musacchia, & Kraus, 2004). This adding method, aside from minimizing noise, also strengthens the envelope following response (Aiken & Picton, 2008). However, the response to the high frequency content of the stimulus may be underrepresented in the added response (Aiken & Picton, 2008). Therefore, we also subtracted the response to the two polarities to enhance spectral components that are canceled when the polarities are added (Aiken & Picton, 2008; Heinz & Swaminathan, 2009; Skoe & Kraus, 2010). All analyses were conducted using added polarities unless indicated.
Data Analysis
Because the electrophysiological responses collected from Cz do not distinguish cortical and myogenic activities from those of subcortical nuclei, the EEG was filtered from 70 to 2000 Hz (12 dB/octave, zero phase-shift). This range reflects the upper but probably not the lower phase-locking function of the brainstem (Chandrasekaran & Kraus, 2010). In order to analyze the evoked properties of the response, epoching was done from −40 to 213 ms relative to the stimulus onset at 0ms. Any sweep exceeding ±35 μV was considered an artifact and was excluded from the average. The initial 6000 accepted sweeps (3000 of each polarity) were included in the analysis for each listening condition.
Measurement of the Brainstem Response
All analyses were performed on the 5 to 190 ms window (the time range for the response to [da]). Average spectral amplitudes were calculated from the response, and zero padding was applied to the Fourier analysis to increase the resolution of the spectral display. For statistical analysis, the average amplitudes were calculated using 30 Hz bins around the frequencies of interest, which included the F0 and its integer harmonics up to 1000 Hz. Root-mean-square (RMS) amplitude was used to quantify the overall magnitude of the response. The SNR of the response was measured by dividing the RMS of the response region (5–190 ms) of the waveform by the RMS of the prestimulus region (−40 to 0 ms).
Using cross-correlation, the similarity between the responses from the two conditions (quiet and noise) was assessed. Correlation coefficients were calculated by shifting the response waveform obtained in noise relative to the response waveform obtained in quiet (+/− 2 ms) until a maximum correlation was achieved, resulting in a Pearson’s r-value, which we refer to as the quiet-to-noise response correlation value. When the correlation between the quiet and noise condition is high (approaching 1), noise is interpreted as having a minimal impact on the response, whereas lower correlations indicate that noise has a greater impact on the response (Parbery-Clark et al., 2009a). Fisher’s transformation was used to convert the r-values to z-scores for statistical computations.
Statistical Analysis
All statistical analyses were conducted with SPSS software (SPSS Inc., Chicago, IL). We compared ABRs in quiet and noise conditions using a two-way mixed-model analysis of variance (ANOVA) with group (top SIN vs bottom SIN) serving as the between-group independent variable and condition (quiet vs noise) serving as the within-group independent variable. F0 and RMS amplitudes served as dependent variables. We did not expect to see group differences in representation of stimulus harmonics and used a separate MANOVA to compare differences in harmonics (H2 to H10). MANOVAs were also used to assess group differences in the impact of noise on responses (quiet-to-noise response correlations) and overall noise levels (response SNRs). The Levene test for Equality of Variances revealed homogeneity of variance for HINT scores and all dependent variables. Pearson’s correlations were used to explore the continuous relationships between the measures of SIN perception and brainstem encoding in quiet and noise.
Results
Groups differ in the F0 and RMS magnitudes
The two-way mixed ANOVA revealed a main effect for group, with greater F0 magnitudes in the top than in the bottom SIN group (F[1,26] = 6.595; p = 0.016). The group difference was significant in quiet (F[1,26] = 7.769; p = 0.010; Fig. 3) and was trending towards significance in noise (F[1,26] = 3.793; p = 0.062; Fig.4). This enhanced F0 encoding was reflected in greater overall neural activity, as evidenced by the top SIN group having greater RMS amplitudes compared to the bottom group (F[1,26] = 5.003; p = 0.034). The group differences in RMS were significant for both the quiet (F[1,26] = 4.700; p = 0.039; Fig.3) and the noise conditions (F[1,26] = 4.348; p = 0.047; Fig.4). The overall interaction between group and condition was not significant (F[2,25] = 0.883; p = 0.426), indicating that noise had similar effects on both the top and bottom SIN groups for the F0 and RMS measurements.
Figure 3.

Top left: Grand average responses for top (red) and bottom (black) SIN groups to the speech syllable [da] in quiet. A significant RMS difference was noted (*p = 0.039). Top right: Grand average frequency spectra with significant difference for F0 (*p = 0.010) calculated over the entire response range (5 to 190 ms). Bottom: HINT scores are significantly related to RMS (left) and F0 (right) amplitudes.
Figure 4.

Top left: Grand average responses for top (red) and bottom (black) SIN groups to the speech syllable [da] in six-talker babble. A significant RMS difference was noted (*p = 0.047). Top right: Grand average frequency spectra with the difference for F0 approaching significance (~ p = 0.062) when calculated over the entire range (5 to 190 ms). Bottom: HINT scores are significantly related to RMS (left) and F0 (right) amplitudes.
HINT scores are related to F0 and RMS magnitudes
Better HINT scores (i.e., lower SNRs) were associated with higher F0 magnitudes and RMS amplitudes. HINT scores were related to F0 magnitude in quiet (r = −0.553, p = 0.002) and in noise (r = −0.489, p = 0.008) and RMS amplitudes (r = −0.503, p = 0.006) in quiet and in noise (r = −0.528, p = 0.004).
Groups did not differ in the pre-stimulus range
The groups did not differ in the RMS of the pre-stimulus range (−40 to 0 ms) in quiet (F[1,26] = 4.348; p = 0.047) or in noise (F[1,26] = 0.167; p = 0.687), indicating that the differences in overall response amplitude were not influenced by pre-stimulus baseline neural activity. The groups also did not differ in response SNRs in quiet (F[1,26] = 2.379; p = 0.135) or in noise (F[1,26] = 2.009; p = 0.168).
Groups did not differ in the response to the harmonics
There was no main effect of group for the response to the higher harmonics (H2 - H10) when they were entered as dependent variables in the MANOVA in quiet (F[9,18] = 0.326; p = 0.955) or in noise (F[9,18] = 0.789; p = 0.630). Subtracted polarities failed to reveal any group differences in quiet in the F0 (F[1,26] = 1.399; p = 0.248) or higher harmonics (H2- H10; F[9,18] = 0.249; p = 0.981), or in noise in the F0 (F[1,26] = 0.261; p = 0.614) or higher harmonics (H2-H10; F[9,18] = 0.167; p = 0.995). The groups differed in F0 magnitude for added polarities but not for subtracted polarities, confirming that the differences arise from the brainstem response to the amplitude modulation of the signal.
Groups differ in the effects of noise on response morphology
Quiet-to-noise response correlations revealed significant SIN group differences (F[1,26] = 4.961, p = 0.035; Fig. 5). The top SIN perceivers showed greater similarity between their responses in quiet and responses in noise than the bottom SIN perceivers. Correlation analyses indicated a strong relationship between HINT scores and quiet-to-noise response correlation values (r = −0.682, p < 0.001; Fig. 5), in which better performance on the HINT was associated with reduced impact of noise on response morphology. In order to determine if this relationship was driven by greater noise in the bottom SIN group’s response, the correlation was repeated with the SNR in quiet entered as a covariate. The correlations remained strong even after controlling for the SNR in quiet (r = −0.564; p = 0.002).
Figure 5.

Responses in the bottom SIN group changed significantly in noise compared to those in the top SIN group. Response waveforms in quiet (gray) and noise (black) are shown for an individual in the top SIN group (top panel) and the bottom SIN group (middle panel). Bottom panel, left: HINT scores are highly correlated with quiet-to-noise correlation r-values (***p < .001) over the entire response (5 to 190 ms) Bottom panel, right: Bar graphs illustrating significant group differences in quiet-to-noise correlation r-values (p = 0.035). Error bars equal 1 SEM.
Discussion
Summary
Our results demonstrate the importance of subcortical encoding of the F0 for successful SIN perception in older adults. Participants in the top SIN group had greater subcortical representation of F0 magnitudes in response to a speech syllable than participants in the bottom SIN group. This F0 enhancement was also reflected in greater RMS amplitudes. Furthermore, the neural response timing of participants with better SIN was less affected by noise, having higher quiet-to-noise correlations between responses. Strong relationships were found between subcortical response measures and behavioral measures of speech in noise (HINT scores).
Audiometrically-matched groups differ in SIN perception
In our data set, two groups of older adults with matched audiograms differed in SIN performance, confirming previous work demonstrating that peripheral hearing does not fully account for the variance in SIN perception (Killion & Niquette, 2000; Souza, 2007). People with hearing loss typically perform worse on perceptual SIN tests than those with normal hearing, yet some of our participants with moderate high frequency hearing loss (above 3000 Hz) had speech-in-noise scores in the top 25th percentile of the overall group. We found that in these hearing-matched groups, brainstem encoding of the F0 and the degree of noise-induced change on response morphology were each predictive of SIN ability, thus highlighting the need to consider subcortical encoding of speech as an important factor contributing to behavioral SIN performance.
Role of the F0 in speech-in-noise perception
In our data set, the subcortical encoding of the F0 was revealed to be an important factor in SIN perception. The F0 and other pitch cues contribute to auditory object identification, allowing the listener to “tag” the target voice with a specific identity and to follow this particular voice from among competing voices or other noises. The ability to distinguish between competing streams of information is dependent, in part, on the F0, as demonstrated by enhanced discrimination of vowels with greater F0 separation between concurrent vowels (Assmann & Summerfield, 1987; Culling & Darwin, 1993) and sentences (Bird & Darwin, 1998; Brokx & Nooteboom, 1982). Moreover, compared to younger adults, older adults benefit less from the pitch cues in male vs. female contrasts (Helfer, 2008) or from prior familiarization with the target voice (Huang et al., 2010) – both key elements for establishing talker identity. Our results suggest that this lack of benefit may reflect subcortical deficits of pitch encoding. Age-related changes in perceptual measures involving processing of F0 differences (Clinard et al., 2010; He et al., 2008; Lam, 2007; Souza et al., 2010) and in a frequency discrimination task using cortical evoked potentials (Harris et al., 2008) support the idea of decreased neurophysiological representation of frequency in older adults.
Although pitch plays an important role in SIN perception, other aspects of the speech signal (e.g., timing, harmonics) are equally as important for understanding one voice from among a background of voices (Shinn-Cunningham & Best, 2008). While we found no differences in the representation of individual harmonics between good and poor SIN perceivers, we do not interpret these results as indicating that harmonic encoding does not contribute to SIN perception. Rather, we conjecture that the representation of pitch was a more important factor for distinguishing between good and poor SIN perceivers in this group of individuals. Furthermore, our results indicate that the neural representation of pitch does not fully account for SIN perception, suggesting that there are other important aspects of cortical and subcortical encoding which contribute to SIN perception in older adults. In fact, response timing as reflected by quiet-to-noise correlation r values was indeed another factor. Harmonic information is likely to prove particularly important for individuals with hearing loss.
Age-related changes in GABA inhibition
The decline in the ability to use pitch cues may arise from age-related decreases in γ-Aminobutyric acid (GABA) inhibition. Decreases in GABA were found in the inferior colliculus and dorsal cochlear nucleus of rats (Caspary et al., 1995; Caspary et al., 2005). Down-regulation of inhibitory function may lead to degradation of subcortical temporal resolution (Caspary et al., 2008) by decreasing selectivity of pertinent acoustic features in the stimulus (Burger & Pollak, 1998; Edwards et al., 2008; Hall, 1999). We conjecture that GABA inhibition may be partly responsible for stronger F0 encoding and more stable/precise neural timing in the top SIN group.
While decreases in GABAergic inhibition may contribute to age-related deficits in subcortical encoding of pitch and timing, the primary purpose of this study was to examine aspects of subcortical processing important for SIN perception in older adults rather than to assess the effects of aging on subcortical responses. Given previous findings demonstrating smaller representation of the F0 in children and young adults with poor SIN perception (Anderson et al., 2010; Song et al., 2010), it is possible that our replication of these effects in an older population is indicative of a fundamental mechanism of auditory processing – a process that would hence be age-independent. Whether similar mechanisms operate in the hearing impaired older adult is currently under investigation; the present work provides a foundation for considering the influence of this key factor on the neural representation of sound.
Clinical Implications
Peripheral aspects of presbycusis, such as widened auditory filters and reduced frequency selectivity (Florentine et al., 1980), and central factors, such as decreased neural synchrony and impaired temporal resolution, limit the benefits of amplification (Gordon-Salant, 2005; Tremblay et al., 2003). Therefore, what are the implications of our findings for clinical management of people with hearing in noise difficulties? Given the limits of amplification, it is important to examine the effects of auditory training on SIN perception. Neural plasticity in the auditory pathway has been demonstrated in animal (Bajo et al., 2010; Gao & Suga, 2000) and human studies (de Boer & Thornton, 2008; Russo, 2005; Song et al., 2008); (Tremblay et al., 2001; Tremblay & Kraus, 2002). For example, training in pitch discrimination leads to more robust neural phase locking in the FFR (Carcagno & Plack, 2010; Song et al., 2008). Auditory training also results in improved SIN perception based on behavioral and self-assessment measures (Burk & Humes, 2008; Sabes & Sweetow, 2007). Moreover, musicians, who undergo a form of lifelong auditory training, have better SIN perception and enhanced subcortical encoding of speech in noise compared to nonmusicians (Bidelman & Krishnan, 2010; Alexandra Parbery-Clark et al., 2009; A. Parbery-Clark et al., 2009) and generally enhanced auditory skills (Kraus & Chandrasekaran, 2010). In these studies, the impact of experience is evident in the very aspects of processing (neural timing and frequency representation, especially in noise) that distinguish our top and bottom SIN perceivers, demonstrating that auditory training (both short- and long-term) can be used to modulate responses in the auditory pathway. The determination of neural factors associated with better SIN perception may lead to more effective training programs.
Future Work
In our dataset, the personal characteristics of individuals with robust F0 encoding were varied. At present, we cannot pinpoint the mechanisms or experiences contributing to enhanced brainstem responses in these older adults. Future work will use Structural Equation Modeling (a statistical technique for estimating causal relationships) to examine the contributions of physical fitness, and cognitive factors such as memory and attention, to the strength of subcortical responses and to performance on speech-in-noise measures. It will be important to extend this work to older adults with more severe hearing loss, for whom peripheral pathology complicates interpretation of factors contributing to SIN perception. The current study provides a baseline from which we can investigate the effects of hearing loss on these processes and examine neural response changes elicited by auditory and cognitive training paradigms targeting improved auditory perception in older adults.
Conclusions
In summary, our findings suggest that central auditory processes contribute to the variance in speech-in-noise perception experienced by older adults. These results extend the work of previous studies demonstrating relationships between SIN ability and subcortical representation of speech in children and young adults (Anderson et al, 2010a; Anderson et al., 2010b; Parbery-Clark et al., 2009; Song et al., 2010) to older adults who have clinically normal hearing. The responses of the top SIN group had more robust representation of the F0 and response morphology, magnitude and timing and were less affected by noise. The brainstem response to speech is therefore an objective measure of neural responses to speech in noise and has the potential to improve assessment and management of SIN difficulties.
Acknowledgments
The authors thank Trent Nicol, Jane Hornickel, and Dr. Judy Song for their helpful comments on the original manuscript and Erika Skoe for her critical review and comments on the revised manuscript. They also thank the people who participated in this study. The authors wish to acknowledge the work of Erika Skoe and Dr. Sumitrajit Dahr for their help in developing the MATLAB routine used for stimulus amplification.
This work was supported by the National Institutes of Health Grant R01-DC010016.
Abbreviations
- SIN
speech-in-noise
- HINT
Hearing in Noise Test
- FFR
frequency following response
- sABR
auditory brainstem response to speech stimuli
- F0
fundamental frequency
- SNR
signal-to-noise ratio
- WASI
Wechsler Abbreviated Scales of Intelligence
- NAL-R
National Acoustics Laboratory-Revised
- RMS
root-mean-square
- MANOVA
multivariate analysis of variance
- FFT
fast Fourier transform
Footnotes
Defined as age 60 and above for the purposes of this study.
References
- Anderson S, Kraus N. Objective neural indices of speech-in-noise perception. Trends Amplif. 2010;14:73–83. doi: 10.1177/1084713810380227. [DOI] [PMC free article] [PubMed] [Google Scholar]
- Anderson S, Skoe E, Chandrasekaran B, Kraus N. Neural timing is linked to speech perception in noise. J Neurosci. 2010;30:4922–4926. doi: 10.1523/JNEUROSCI.0107-10.2010. [DOI] [PMC free article] [PubMed] [Google Scholar]
- Anderson S, Skoe E, Chandrasekaran B, Zecker S, Kraus N. Brainstem correlates of speech-in-noise perception in children. [doi: DOI: 10.1016/j.heares.2010.08.001] Hear Res. 2010 doi: 10.1016/j.heares.2010.08.001. In Press, Corrected Proof. [DOI] [PMC free article] [PubMed] [Google Scholar]
- Assmann PF, Summerfield Q. Perceptual segregation of concurrent vowels. J Acoust Soc Am. 1987;82:S120. [Google Scholar]
- Bidelman GM, Krishnan A. Effects of reverberation on brainstem representation of speech in musicians and non-musicians. Brain Res. 2010;1355:112–125. doi: 10.1016/j.brainres.2010.07.100. [DOI] [PMC free article] [PubMed] [Google Scholar]
- Bird J, Darwin CJ. Effects of a difference in fundamental frequency in separating two sentences. In: Palmer AR, Rees A, Summerfield AQ, Meddis R, editors. Psychophysical and physiological advances in hearing. London: Whurr; 1998. pp. 263–269. [Google Scholar]
- Brokx JP, Nooteboom S. Intonation and the perceptual separation of simultaneous voices. J Phonetics. 1982;10:23–26. [Google Scholar]
- Burger RM, Pollak GD. Analysis of the role of inhibition in shaping responses to sinusoidally amplitude-modulated signals in the inferior colliculus. J Neurophysiol. 1998;80:1686–1701. doi: 10.1152/jn.1998.80.4.1686. [DOI] [PubMed] [Google Scholar]
- Burk MH, Humes LE. Effects of long-term training on aided speech-recognition performance in noise in older adults. J Speech Lang Hear Res. 2008;51:759–771. doi: 10.1044/1092-4388(2008/054). [DOI] [PMC free article] [PubMed] [Google Scholar]
- Byrne D, Dillon H. The national acoustic laboratories’ (nal) new procedure for selecting the gain and frequency response of a hearing aid. Ear Hear. 1986;7:257–265. doi: 10.1097/00003446-198608000-00007. [DOI] [PubMed] [Google Scholar]
- Caspary DM, Ling L, Turner JG, Hughes LF. Inhibitory neurotransmission, plasticity and aging in the mammalian central auditory system. J Exp Biol. 2008;211:1781–1791. doi: 10.1242/jeb.013581. [DOI] [PMC free article] [PubMed] [Google Scholar]
- Caspary DM, Milbrandt JC, Helfert RH. Central auditory aging: Gaba changes in the inferior colliculus. Exp Gerentol. 1995;30:349–360. doi: 10.1016/0531-5565(94)00052-5. [DOI] [PubMed] [Google Scholar]
- Caspary DM, Schatteman TA, Hughes LF. Age-related changes in the inhibitory response properties of dorsal cochlear nucleus output neurons: Role of inhibitory inputs. J Neurosci. 2005;25:10952–10959. doi: 10.1523/JNEUROSCI.2451-05.2005. [DOI] [PMC free article] [PubMed] [Google Scholar]
- Chandrasekaran B, Hornickel J, Skoe E, Nicol TG, Kraus N. Context-dependent encoding in the human auditory brainstem relates to hearing speech in noise: Implications for developmental dyslexia. Neuron. 2009;64:311–319. doi: 10.1016/j.neuron.2009.10.006. [DOI] [PMC free article] [PubMed] [Google Scholar]
- Clinard CG, Tremblay KL, Krishnan AR. Aging alters the perception and physiological representation of frequency: Evidence from human frequency-following response recordings. Hear Res. 2010;264:48–55. doi: 10.1016/j.heares.2009.11.010. [DOI] [PMC free article] [PubMed] [Google Scholar]
- Cruickshanks KJ, Wiley TL, Tweed TS, Klein BEK, Klein R, Mares-Perlman JA, et al. Prevalence of hearing loss in older adults in beaver dam, wisconsin: The epidemiology of hearing loss study. Am J Epidemiol. 1998;148:879–886. doi: 10.1093/oxfordjournals.aje.a009713. [DOI] [PubMed] [Google Scholar]
- Culling JF, Darwin CJ. Perceptual separation of simultaneous vowels: Within and across-formant grouping by f0. J Acoust Soc Am. 1993;93:3454–3467. doi: 10.1121/1.405675. [DOI] [PubMed] [Google Scholar]
- de Boer J, Thornton ARD. Neural correlates of perceptual learning in the auditory brainstem: Efferent activity predicts and reflects improvement at a speech-in-noise discrimination task. J Neurosci. 2008;28:4929–4937. doi: 10.1523/JNEUROSCI.0902-08.2008. [DOI] [PMC free article] [PubMed] [Google Scholar]
- Dubno J, Dirks D, Morgan D. Effects of age and mild hearing loss on speech recognition in noise. J Acoust Soc Am. 1984;76:87–96. doi: 10.1121/1.391011. [DOI] [PubMed] [Google Scholar]
- Edwards CJ, Leary CJ, Rose GJ. Mechanisms of long-interval selectivity in midbrain auditory neurons: Roles of excitation, inhibition, and plasticity. J Neurophysiol. 2008;100:3407–3416. doi: 10.1152/jn.90921.2008. [DOI] [PMC free article] [PubMed] [Google Scholar]
- Fellowes J, Remez R, Rubin P. Perceiving the sex and identity of a talker without natural vocal timbre. Percep Psychophys. 1997;59:839–840. doi: 10.3758/bf03205502. [DOI] [PubMed] [Google Scholar]
- Florentine M, Buus S, Scharf B, Zwicker E. Frequency selectivity in normally-hearing and hearing-impaired observers. J Speech Hear Res. 1980;23:646–669. doi: 10.1044/jshr.2303.646. [DOI] [PubMed] [Google Scholar]
- Frisina DR, Frisina RD. Speech recognition in noise and presbycusis: Relations to possible neural mechanisms. Hear Res. 1997;106:95–104. doi: 10.1016/s0378-5955(97)00006-3. [DOI] [PubMed] [Google Scholar]
- Galbraith GC, Arbagey PW, Branski R, Comerci N, Rector PM. Intelligible speech encoded in the human brain stem frequency-following response. NeuroReport. 1995;6:2363–2367. doi: 10.1097/00001756-199511270-00021. [DOI] [PubMed] [Google Scholar]
- Gordon-Salant S. Hearing loss and aging: New research findings and clinical implications. J Rehab Research Dev. 2005;42:9–24. doi: 10.1682/jrrd.2005.01.0006. [DOI] [PubMed] [Google Scholar]
- Gordon-Salant S, Fitzgibbons PJ. Temporal factors and speech recognition performance in young and elderly listeners. J Speech Hear Res. 1993;36:1276. doi: 10.1044/jshr.3606.1276. [DOI] [PubMed] [Google Scholar]
- Gordon-Salant S, Fitzgibbons PJ. Selected cognitive factors and speech recognition performance among young and elderly listeners. J Speech Lang Hear Res. 1997;40:423–431. doi: 10.1044/jslhr.4002.423. [DOI] [PubMed] [Google Scholar]
- Hall JC. Gabaergic inhibition shapes frequency tuning and modifies response properties in the auditory midbrain of the leopard frog. J Comp Physiol. 1999;185:479–491. doi: 10.1007/s003590050409. [DOI] [PubMed] [Google Scholar]
- Hargus SE, Gordon-Salant S. Accuracy of speech intelligibility index predictions for noise-masked young listeners with normal hearing and for elderly listeners with hearing impairment. J Speech Hear Res. 1995;38:234–243. doi: 10.1044/jshr.3801.234. [DOI] [PubMed] [Google Scholar]
- Harris KC, Mills JH, He NJ, Dubno JR. Age-related differences in sensitivity to small changes in frequency assessed with cortical evoked potentials. [doi: DOI: 10.1016/j.heares.2008.05.005] Hear Res. 2008;243:47–56. doi: 10.1016/j.heares.2008.05.005. [DOI] [PMC free article] [PubMed] [Google Scholar]
- He N-j, Mills JH, Ahlstrom JB, Dubno JR. Age-related differences in the temporal modulation transfer function with pure-tone carriers. J Acoust Soc Am. 2008;124:3841–3849. doi: 10.1121/1.2998779. [DOI] [PMC free article] [PubMed] [Google Scholar]
- Helfer K, Freyman R. Aging and speech-on-speech masking. Ear Hear. 2008;29:87–98. doi: 10.1097/AUD.0b013e31815d638b. [DOI] [PMC free article] [PubMed] [Google Scholar]
- Helfer KS, Vargo M. Speech recognition and temporal processing in middle-aged women. J Am Acad Audiol. 2009;20:264–271. doi: 10.3766/jaaa.20.4.6. [DOI] [PMC free article] [PubMed] [Google Scholar]
- Hornickel J, Chandrasekaran B, Zecker S, Kraus N. Auditory brainstem measures predict reading and speech-in-noise perception in school-aged children. Beh Brain Res. doi: 10.1016/j.bbr.2010.08.051. (in press) [DOI] [PMC free article] [PubMed] [Google Scholar]
- Hornickel J, Skoe E, Nicol T, Zecker S, Kraus N. Subcortical differentiation of stop consonants relates to reading and speech-in-noise perception. Proc Natl Acad Sci USA. 2009;106:13022–13027. doi: 10.1073/pnas.0901123106. [DOI] [PMC free article] [PubMed] [Google Scholar]
- Huang Y, Xu L, Wu X, Li L. The effect of voice cuing on releasing speech from informational masking disappears in older adults. Ear Hear. 2010;31:579–583. doi: 10.1097/AUD.0b013e3181db6dc2. [DOI] [PubMed] [Google Scholar]
- Killion M, Niquette P. What can the pure-tone audiogram tell us about a patient’s snr loss? Hear Jour. 2000;53:46–53. [Google Scholar]
- Kim S, Frisina RD, Mapes FM, Hickman ED, Frisina DR. Effect of age on binaural speech intelligibility in normal hearing adults. Speech Comm. 2006;48:591–597. [Google Scholar]
- Kraus N, Chandrasekaran B. Music training for the development of auditory skills. Nat Rev Neurosci. 2010;11:599–605. doi: 10.1038/nrn2882. [DOI] [PubMed] [Google Scholar]
- Lam E, Sanchez L. Evaluation of screening instruments for auditory processing disorder (apd) in a sample of referred children. Australian New Zealand. J Audiol. 2007;29:26–39. [Google Scholar]
- Meddis R, O’Mard L. A unitary model of pitch perception. J Acoust Soc Am. 1997;102:1811–1820. doi: 10.1121/1.420088. [DOI] [PubMed] [Google Scholar]
- Oxenham AJ. Pitch perception and auditory stream segregation: Implications for hearing loss and cochlear implants. Trends Amplif. 2008;12:316–331. doi: 10.1177/1084713808325881. [DOI] [PMC free article] [PubMed] [Google Scholar]
- Parbery-Clark A, Skoe E, Kraus N. Musical experience limits the degradative effects of background noise on the neural processing of sound. J Neurosci. 2009;29:14100–14107. doi: 10.1523/JNEUROSCI.3256-09.2009. [DOI] [PMC free article] [PubMed] [Google Scholar]
- Parbery-Clark A, Skoe E, Lam C, Kraus N. Musician enhancement for speech-in-noise. Ear Hear. 2009;30:653–661. doi: 10.1097/AUD.0b013e3181b412e9. [DOI] [PubMed] [Google Scholar]
- Russo N, Nicol T, Zecker S, Hayes E, Kraus N. Auditory training improves neural timing in the human brainstem. Beh Brain Res. 2005;156:95–103. doi: 10.1016/j.bbr.2004.05.012. [DOI] [PubMed] [Google Scholar]
- Sabes JH, Sweetow RW. Variables predicting outcomes on listening and communication enhancement (lace (tm)) training. Int J Audiol. 2007;46:374–383. doi: 10.1080/14992020701297565. [DOI] [PubMed] [Google Scholar]
- Shinn-Cunningham BG, Best V. Selective attention in normal and impaired hearing. Trends in Amplification. 2008;12:283–299. doi: 10.1177/1084713808325306. [DOI] [PMC free article] [PubMed] [Google Scholar]
- Skoe E, Kraus N. Auditory brain stem response to complex sounds: A tutorial. Ear Hear. 2010;31:302–324. doi: 10.1097/AUD.0b013e3181cdb272. [DOI] [PMC free article] [PubMed] [Google Scholar]
- Skoe E, Nicol T, Kraus N. Cross-phaseogram: Objective neural index of speech sound differentiation. J Neurosci Meth. 2011;196:308–317. doi: 10.1016/j.jneumeth.2011.01.020. [DOI] [PMC free article] [PubMed] [Google Scholar]
- Song J, Skoe E, Banai K, Kraus N. Perception of speech in noise: Neural correlates. J Cog Neurosci. 2010;0:1–12. doi: 10.1162/jocn.2010.21556. [DOI] [PMC free article] [PubMed] [Google Scholar]
- Song JH, Banai K, Kraus N. Brainstem timing deficits in children with learning impairment may result from corticofugal origins. Audiol Neurotol. 2008;13:335–344. doi: 10.1159/000132689. [DOI] [PubMed] [Google Scholar]
- Souza P, Arehart K, Miller CW, Muralimanohar RK. Effects of age on f0 discrimination and intonation perception in simulated electric and electroacoustic hearing. Ear Hear, Publish Ahead of Print. 2010 doi: 10.1097/AUD.1090b1013e3181eccfe1099. [DOI] [PMC free article] [PubMed] [Google Scholar]
- Souza P, Boike K, Witherell K, Tremblay K. Prediction of speech recognition from audibility in older listeners with hearing loss: Effects of age, amplification, and background noise. J Am Acad Audiol. 2007;18:54–65. doi: 10.3766/jaaa.18.1.5. [DOI] [PubMed] [Google Scholar]
- Souza P, Boike K, Witherell K, Tremblay K. Prediction of speech recognition from audibility in older listeners with hearing loss: Effects of age, amplification, and background noise. J Am Acad Audiol. 2007;18:54–65. doi: 10.3766/jaaa.18.1.5. [DOI] [PubMed] [Google Scholar]
- Tremblay K, Kraus N, McGee T, Ponton C, Otis B. Central auditory plasticity: Changes in the n1-p2 complex after speech-sound training. Ear Hear. 2001;22:79–90. doi: 10.1097/00003446-200104000-00001. [DOI] [PubMed] [Google Scholar]
- Tremblay K, Piskosz M, Souza P. Aging alters the neural representation of speech cues. NeuroReport. 2002;13:1865–1870. doi: 10.1097/00001756-200210280-00007. [DOI] [PubMed] [Google Scholar]
- Tremblay K, Piskosz M, Souza P. Effects of age and age-related hearing loss on the neural representation of speech cues. Clin Neurophysiol. 2003;114:1332–1343. doi: 10.1016/s1388-2457(03)00114-7. [DOI] [PubMed] [Google Scholar]
- Tremblay KL, Kraus N. Auditory training induces asymmetrical changes in cortical neural activity. J Speech Lang Hear Res. 2002;45:564–572. doi: 10.1044/1092-4388(2002/045). [DOI] [PubMed] [Google Scholar]
- Tun P, O’Kane G, Wingfield A. Distraction by competing speech in young and older adult listeners. Psych Aging. 2002;17:453–467. doi: 10.1037//0882-7974.17.3.453. [DOI] [PubMed] [Google Scholar]
- Wong PCM, Jin JX, Gunasekera GM, Abel R, Lee ER, Dhar S. Aging and cortical mechanisms of speech perception in noise. Neuropsychologia. 2009;47:693–703. doi: 10.1016/j.neuropsychologia.2008.11.032. [DOI] [PMC free article] [PubMed] [Google Scholar]
- Woodcock RW, McGrew KS, Mather N. Woodcock-johnson iii tests of cognitive abilities. Itasca, IL: Riverside Publishing; 2001. [Google Scholar]
- Yueh B, Shapiro N, MacLean CH, Shekelle PG. Screening and management of adult hearing loss in primary care: Scientific review. J Am Med Assoc. 2003;289:1976–1985. doi: 10.1001/jama.289.15.1976. [DOI] [PubMed] [Google Scholar]