
Figure 2.
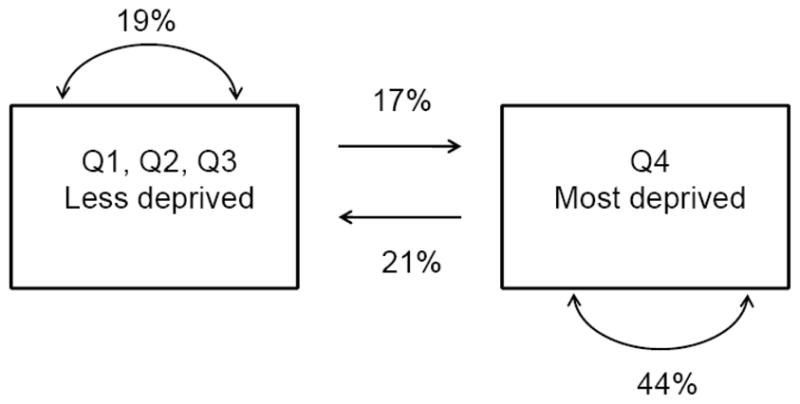
Diagram showing residential relocation between and within neighborhoods of differing levels of deprivation among ALIVE study participants in Baltimore City, 1988–2008. Q1–Q4: quartiles of neighborhood deprivation in Baltimore City.
Official websites use .gov
A
.gov website belongs to an official
government organization in the United States.
Secure .gov websites use HTTPS
A lock (
) or https:// means you've safely
connected to the .gov website. Share sensitive
information only on official, secure websites.
Diagram showing residential relocation between and within neighborhoods of differing levels of deprivation among ALIVE study participants in Baltimore City, 1988–2008. Q1–Q4: quartiles of neighborhood deprivation in Baltimore City.