Abstract
Microdamage density has been shown to increase with age in trabecular bone and is associated with decreased fracture toughness. Numerous studies of crack propagation in cortical bone have been conducted, but data in trabecular bone is lacking. In this study, propagation of severe, linear, and diffuse damage was examined in trabecular bone cores from the femoral head of younger (61.3 ± 3.1 years) and older (75.0 ± 3.9 years) men and women. Using a two-step mechanical testing protocol, damage was first initiated with static uniaxial compression to 0.8% strain then propagated at a normalized stress level of 0.005 to a strain endpoint of 0.8%. Coupling mechanical testing with a dual fluorescent staining technique, the number and length/area of propagating cracks were quantified. It was found that the number of cycles to the test endpoint was substantially decreased in older compared to younger samples (younger: 77372 ± 15984 cycles; older: 34944 ± 11964 cycles, p=0.06). This corresponded with a greater number of severely damaged trabeculae expanding in area during the fatigue test in the older group. In the younger group, diffusely damaged trabeculae had a greater damage area, which illustrates an efficient energy dissipation mechanism. These results suggest that age-related differences in fatigue life of human trabecular bone may be due to differences in propagated microdamage morphology.
Keywords: Bone, Cancellous, Fatigue, Microdamage, Aging
Introduction
Fatigue microdamage forms after repeated loading in daily activities. (Burr et al. 1985) Damage formation is not necessarily pathologic; microdamage dissipates strain energy and limits the development of more serious fractures at sites subjected to high stress. (Vashishth et al. 1997) Damaged sites are repaired using targeted remodeling mechanisms, preserving the structural integrity of the trabecular lattice. (Burr et al. 1985) With aging, however, targeted remodeling processes diminish and allow fatigue microdamage to accumulate. (Schaffler et al. 1995; Allen 2008) Also, changes in trabecular matrix properties and morphology with age, including increased local mineralization levels, decreased thickness, increased spacing, loss of connectivity, and increased anisotropy, contribute to the deterioration of bone strength and stiffness and can promote microdamage formation and propagation. (Burr et al. 1997) Significant damage accumulation lowers stiffness and increases the probability of fracture. (Burr et al. 1998; Sobelman et al. 2004)
Much of what is known about age-related differences in microdamage and fatigue properties is derived from cortical (Schaffler et al. 1995; Vashishth et al. 1997; Norman et al. 1998; Vashishth et al. 2000; Zioupos 2001; Zioupos 2001) rather than trabecular bone studies. (Seeman 2003; Cook et al. 2009) Previous studies have reported that bone from younger individuals has a longer fatigue life due to increased formation of diffuse damage, whereas bone from older donors form fewer but longer linear microcracks. (Diab et al. 2006) Linear microdamage, associated with a quadratic loss of modulus, propagates more easily than diffuse damage, which can dissipate energy while limiting propagation. (Burr et al. 1998; Diab et al. 2006) However it is unclear whether these findings are translatable to trabecular bone.
Furthermore, it is unclear whether sex differences influence the fatigue behavior of trabecular bone. Histomorphometric studies have found few bone volume fraction or compressive strength differences attributable to sex in vertebral trabecular bone in age-matched groups. (Bergot et al. 1988; Thomsen et al. 2000; Keaveny et al. 2002) One study reported an increased tendency for perforation of horizontal trabecular struts and increased trabecular spacing between horizontal trabeculae in females compared with males, but found no other histomophometric sex differences. (Mosekilde 1989) Given that 3 out of 4 fragility fractures occur in women, further investigation into sex differences in fatigue behavior is warranted.
In this study, trabecular bone cores from the femoral head of men and women aged 55–81 years were tested in a two step mechanical testing protocol in order to investigate age and sex differences in crack propagation. We hypothesize that bone from older individuals will demonstrate decreased resistance to crack propagation, though we do not expect to see differences due to sex.
Methods
Femoral heads from 10 males and 10 females aged 55–81 years were obtained using the National Disease Research Interchange (NDRI). Donors had no history of bone disease, cancer, or use of medication altering bone morphology. Tissue was removed at autopsy within 12 hours of death and fresh frozen at −80°C. Donors were initially divided into four groups based on sex and age: young males (60.2 ± 3.7 years; mean ± s.d.), old males (77.2 ± 1.5 years), young females (63.0 ± 2.8 years), and old females (72.8 ± 4.8 years). After finding no sex-related differences in any measure, sex groups were combined to form two groups based on age (younger: 61.3 ± 3.1 years; older: 75.0 ± 3.9 years).
Two trabecular bone cores from each sample (5 mm diameter) were removed from the central portion of the femoral head using a trephine under constant irrigation with saline such that the longitudinal axis was oriented approximately parallel with the material axis. Cores were sized to a final length of 18 mm with a diamond saw. Bone marrow was removed using a water pik (WP-72W, WaterPik, USA) to improve stain penetration, and the ends of each core were glued with cyanoacrylate (Prism 401, Loctite, Newington, CT, USA) into stainless steel endcaps of 5 mm depth to minimize the effect of end-artifacts on mechanical testing. (Keaveny et al. 1994) Cores were scanned with micro-CT at a voxel resolution of 16 um. (µCT 40, Scanco Medical, Basserdorf, Switzerland) A threshold to distinguish trabecular bone from background was chosen through histogram analysis of grayscale images and remained consistent throughout all sample reconstructions, and evaluation of the reconstructed images yielded morphological descriptors (bone volume fraction, connectivity density, structural model index, trabecular number, trabecular thickness, trabecular spacing, and degree of anisotropy). Bone mineralization (in mg/cc HA) was computed from attenuation values of grayscale micro-CT images based on hydroxyapatite (HA) calibration standards. Specifically, for calibration of the linear attenuation coefficient (1/cm) to hydroxyapatite (HA) mineral density (mgHA/cm3), a cylindrical HA phantom (Scanco Medical, Basserdorf, Switzerland; 38mm diameter) was utilized. This phantom contained known density rods (0, 200, 400, and 800 mgHA/cm3) embedded in resin. Scans were performed at the X-ray source energy used in this study (45 kVp). A 0.5mm Al filter was used for all scans. Reconstructions also incorporated a beam hardening correction curve.
Mechanical Testing
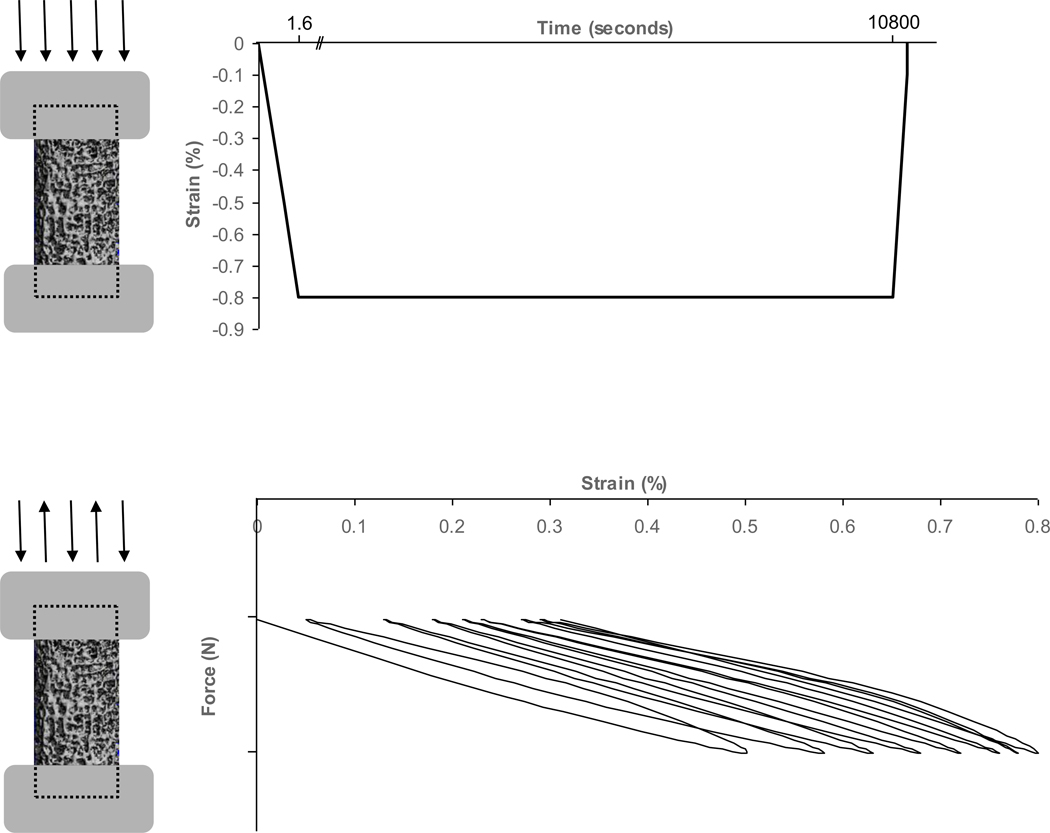
Throughout the mechanical testing process (Mini Bionix 858, MTS Corp.), specimens (2 per donor, n=40) were immersed in 0.9% physiological saline and 10 µmol/L protease inhibitor (E-64, Sigma Chemical) to prevent tissue degradation. In the first portion of mechanical testing (Figure 1a), cores were preconditioned for 3 cycles at a strain rate of 0.5% strain/second to 0.1% strain then loaded in static uniaxial compression at a strain rate 0.5% strain/second to a strain endpoint of 0.8% and held for three hours to initiate microdamage throughout the specimen.
Figure 1. Stylized figure demonstrating two-step mechanical testing protocol.
1a. Part one of the mechanical testing protocol induced damage formation by uniaxially compressing and holding samples at a strain level of 0.8%. 1b. Part two of the mechanical testing protocol promoted microdamage progression by cyclically compressing samples uniaxially between −10 N and a maximum force calculated from a normalized stress level (Δσ/E0) of 0.005. The test ended when a strain of 0.8% was reached.
In the fatigue portion of mechanical testing (Figure 1b), samples were first preconditioned for 10 compression cycles under strain control from 0.05% to 0.45% using a sinusoidal waveform at a frequency of 2 Hz. The initial secant modulus, E0, was calculated from the linear best-fit of the 10th loading cycle. Samples were then preloaded to 10 N and underwent compressive fatigue testing to a strain endpoint of 0.8% (within the linear region of the stress-strain curve and below 0.9% yield strain) using a sinusoidal waveform at a normalized stress range (Δσ/E0) of 0.005 and frequency of 2 Hz. (Caler et al. 1989; Pattin et al. 1996; Moore et al. 2003) Tests were stopped after reaching a strain level of 0.8% or 150,000 cycles, whichever came first. The number of cycles and the initial, precyclic, and final secant moduli were calculated for each specimen.
Dual-fluorescent staining protocol
A two-step staining procedure with chelating fluorophores was used to visualize changes in microdamage size and morphology during the mechanical test. (O'Brien et al. 2003) One core from each donor (n=10 per age group) was stained with 0.02% alizarin plus 10 µmol/L protease inhibitor at atmospheric pressure and 4°C for 8 hours after completion of the static loading portion of the mechanical test. Samples were stained again with 0.01% calcein after the cyclic loading portion of the mechanical test to label damage progression and de novo damage created from fatigue loading. (O'Brien et al. 2002) Microdamage analysis was chosen among cores most similar in gross morphological parameters, as studies have demonstrated that bone volume fraction and architectural characteristics influence damage formation. (Table 1) (Stepan et al. 2007; Arlot et al. 2008; Shi et al. 2010) At the completion of mechanical testing, cores were fixed in 70% ethanol for 24 hours then dehydrated using a graded alcohol infiltration procedure. Cores were embedded in methyl methacrylate and 6 slides of 100–150 µm thickness were cut along the longitudinal axis with a diamond saw.
Table 1.
Architectural Characteristics of Trabecular Bone Samples by Age Group
| All Samples | Microdamage-Assessed Samples |
|||||||
|---|---|---|---|---|---|---|---|---|
| Parameter | Younger | Older | Younger | Older | ||||
| Bone Volume Fraction | 0.27 | 0.02 | 0.23 | 0.01 | 0.25 | 0.02 | 0.23 | 0.02 |
| Connectivity Density | 8.26 | 0.64 | 7.09 | 0.56 | 7.71 | 0.63 | 6.85 | 0.68 |
| Structural Model Index | 0.29 | 0.20 | 0.63 | 0.11 | 0.52 | 0.17 | 0.63 | 0.16 |
| Trabecular Number (mm−1) | 1.60 | 0.07 | 1.46 | 0.05 | 1.56 | 0.07 | 1.43 | 0.06 |
| Trabecular Thickness (mm) | 0.18 | 0.01 | 0.18 | 0.01 | 0.17 | 0.01 | 0.18 | 0.01 |
| Trabecular Spacing (mm) | 0.61 | 0.03 | 0.67 | 0.03 | 0.62 | 0.03 | 0.68 | 0.03 |
| Degree of Anisotropy | 1.58 | 0.05 | 1.62 | 0.04 | 1.61 | 0.08 | 1.65 | 0.07 |
| Mineralization (mg HA/cm3) | 1063.4 | 8.6 | 1062.8 | 9.2 | 1078.9 | 14.8 | 1083.9 | 13.0 |
Microdamage Analysis
Investigators were blinded to the demographic group of each sample for the microdamage analysis. Three slides from each core corresponding with the middle section of the cylindrical sample were evaluated, and the microdamage analysis region omitted trabeculae immediately adjacent to specimen edges. Microdamage was assessed at 100× and identified based on criteria that cracks are intermediate in size (larger than canaliculi but smaller than vascular channels), have sharp borders, and have a focus plane demonstrating depth of field. (Burr et al. 1990; Huja et al. 1999) Alizarin-labeled damage, encompassing damage formed during the static-loading portion of the mechanical test as well as in vivo damage and incidental damage from the core extraction, was quantified under red epifluorescence. Calcein-labeled damage, including damage created de novo in the fatigue portion of the mechanical test as well as crack growth from initial alizarin-labeled damage, was quantified under green epifluorescence. (O'Brien et al. 2002) Cracks exhibiting both alizarin and calcein fluorescence were evaluated from a composite image generated from two images of the damage incident under each filter. In all, 338 damage incidents from older females (210 alizarin-labeled, 20 calcein-labeled, and 108 dual-labeled), 394 damage incidents from older males (214 alizarin-labeled, 32 calcein-labeled, and 148 dual-labeled), 282 damage incidents from younger females (173 alizarin-labeled, 21 calcein-labeled, and 88 dual-labeled), and 301 damage incidents from younger males (142 alizarin-labeled, 21 calcein-labeled, 138 dual-labeled) were counted. Damage counts were normalized by bone slide surface area obtained with image analysis software. (Axiovision, Zeiss Corporation, USA)
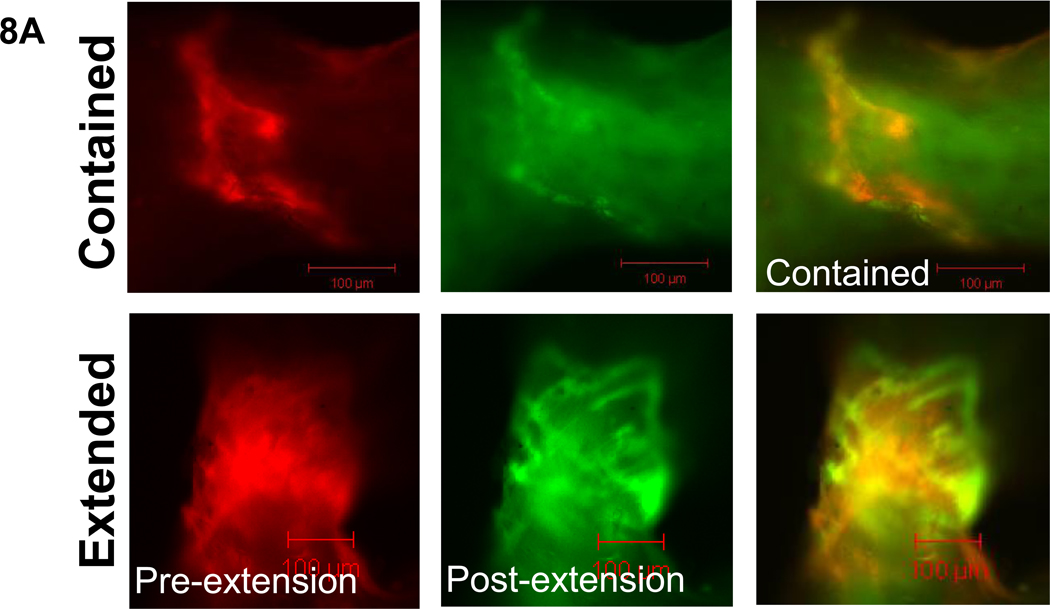
Microdamage was classified into severe, diffuse, or linear morphological categories based on previously published criteria. (O'Neal et al. 2010) Propagated damage was classified based on whether alizarin and calcein-labeled damage areas were completely overlapping (contained), or whether the calcein-labeled areas extended beyond the initial alizarin-labeled damage area. Linear damage length and diffuse and severe damage area were measured using image analysis software. (Axiovision, Zeiss Corporation, USA) To obtain the length of linear cracks, measurements along the entire length of the fluorescent crack were used. Contained linear damage had the same length and overlapped exactly under both red and green epifluorescence, while extended damage exhibited greater length under green than red epifluorescence. For area measurements, contour lines were used to outline the area based on increased fluorescence above background. Measurements were made under red epifluorescence and green epifluorescence separately, and were classified as contained if the area of calcein-stained damage did not extend beyond the area of alizarin-stained damage. Extended damage occurred if the area of calcein-stained damage extended beyond that of alizarin-stained damage. The extended area reported is that of the total final area of the damage incident, which includes damage formed by both static and cyclic loading.
Statistics
All statistical tests were conducted using Minitab statistical software. Global architectural differences, number of cycles, and differences in modulus were evaluated for age and sex differences with three way ANOVA using age and sex as fixed factors and donor as a random factor. After determining no sex-related differences, groups were combined according to age, and two way ANOVA was conducted for these measures using age as a fixed factor and donor as a random factor. Differences in the initial, precyclic, and final secant modulus within each age group were obtained with two-way ANOVA and Tukey post-hoc comparisons using the modulus as a fixed factor and specimen donor as a random factor.
Three-way ANOVA and Tukey post-hoc comparisons were used for evaluating differences in static load-induced crack density, crack propagation density, and length/area changes with fatigue loading using age group and damage type as fixed factors and specimen donor as a random factor. For all tests, p<0.05 was considered statistically significant.
Results
No differences due to sex were noted for any comparisons, so sex groups were combined and comparisons were made between younger and older groups (younger: 61.3 ± 3.1 years; older: 75.0 ± 3.9 years). Gross morphological properties are reported for all mechanically tested samples (two cores/donor, n=20 per age group) and microdamage-assessed samples (one core/donor, n=10 per age group). An assessment of the global architectural properties of the trabecular bone samples revealed no significant differences between groups (Table 1).
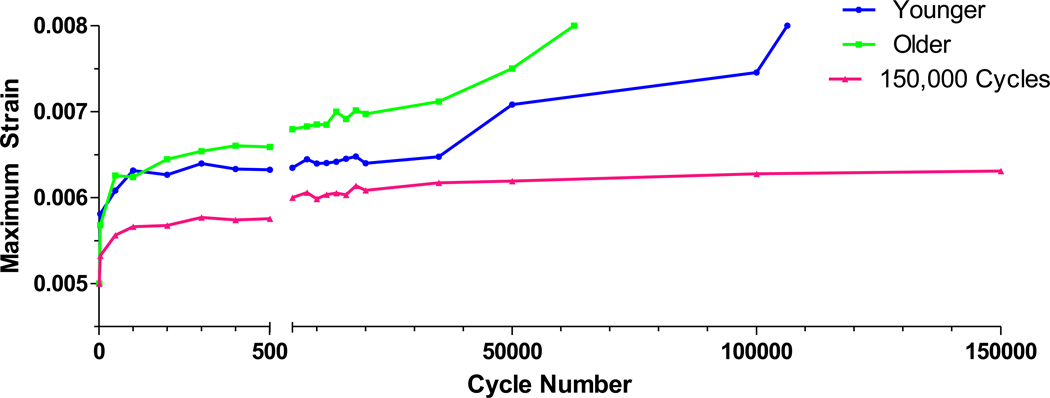
The difference in the number of cycles to the fatigue test endpoint approached significance between age groups (younger: 77372 ± 15984 cycles; older: 34944 ± 11964 cycles, p=0.06). A number of samples reached 150,000 cycles, which was the ceiling placed on all tests due to the observation that the modulus had stopped declining and max strain had stopped progressing by this point. In the younger group, 9 of 20 samples reached the limit, while only 3 of 20 samples reached the limit in the older group. The maximum strain per cycle, calculated by averaging values from multiple fatigue tests, was plotted as a function of number of cycles to illustrate how strains progressed during fatigue testing (Figure 2).
Figure 2. Changes in maximum strain per cycle in younger samples, older samples, and samples that went to 150,000 cycles.
The greatest rate of change in maximum strain occurred within the first 100 cycles. Samples in the older group tracked at higher strain rates/cycle than samples in the younger group. Samples that went to 150,000 cycles (younger and older combined) are plotted separately to illustrate that their maximum strain/cycle changed very little throughout the test
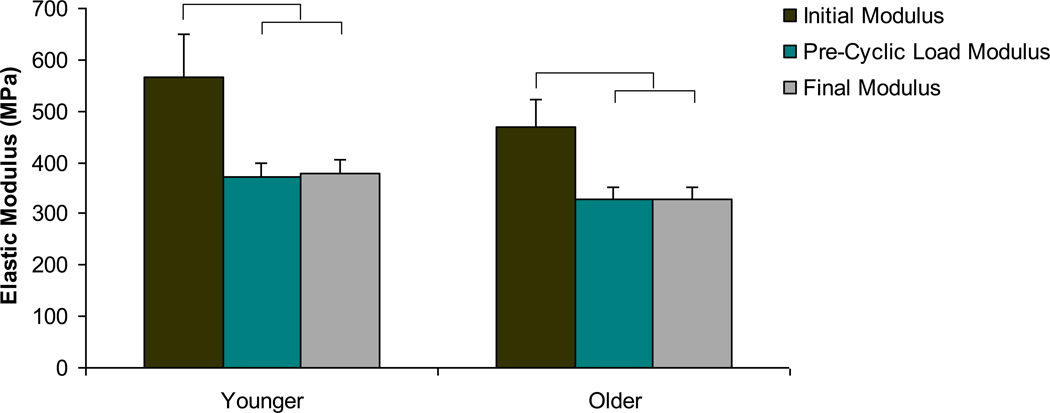
The secant elastic modulus of each sample was calculated at three intervals: at the initial static load to 0.8% strain, at the end of the 10th pre-conditioning cycle before fatigue testing, and at the final cycle of the fatigue loading protocol. The initial modulus was significantly greater than the pre-cyclic modulus and the final modulus in both the younger and older age group (Figure 3, p<0.02).
Figure 3. Elastic modulus changes during mechanical test by age group.
Significant decreases in the elastic modulus after the initial static loading protocol were noted in both age groups. No differences in modulus due to the fatigue test were found. Bars represent significant differences.
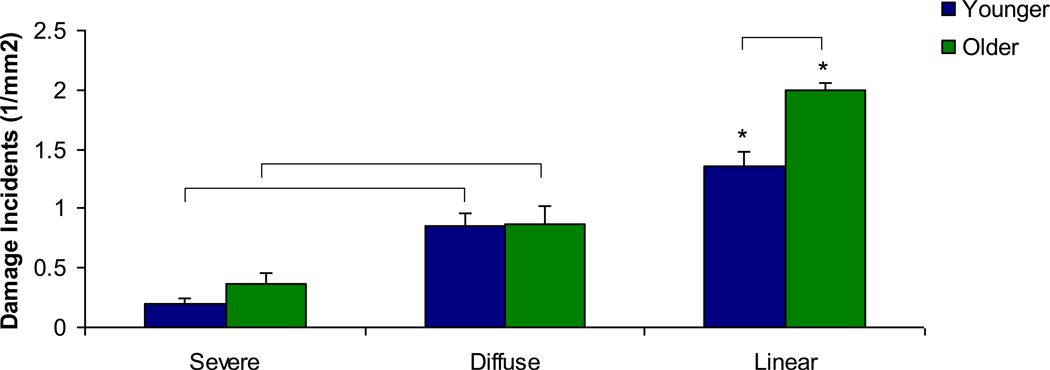
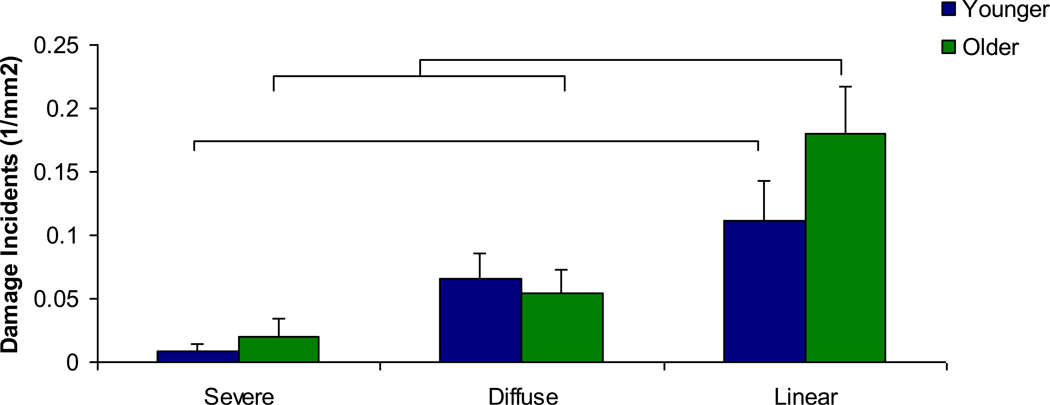
Alizarin-labeled microdamage incidents were quantified and compared between younger and older age groups. Significantly increased incidents of linear damage relative to diffuse and severe damage were seen in both age groups (Figure 4, p<0.005). Also, significantly increased diffuse damage incidents compared to severe damage incidents were found in both age groups (p<0.005). There was significantly more linear damage in the older age group after the initial loading protocol compared to the younger age group (p<0.001).
Figure 4. Microdamage density after initial static loading by age group.
Linear damage incidents were the most common in both age groups, significantly greater than diffuse and severe damage incidents. (*) Diffuse damage incidents were more common than severe damage incidents in both age groups. Finally, linear damage incidents were increased in the older group compared to the younger group. Bars represent significant differences.
Cyclic de novo damage was more rare, representing 6.7% of total calcein-labeled damage in the younger group and 7.1% in the older group. Of de novo damage incidents, significantly more linear damage than severe damage was observed in both age groups (Figure 5, younger: p<0.04; older: p<0.001). In the older age group, the number of linear damage incidents was significantly greater than diffuse damage incidents (p<0.005).
Figure 5. Microdamage density of de novo damage created with fatigue loading by microdamage morphology.
More linear damage than severe damage was found in both age groups, and linear damage density was greater than diffuse damage density in the older group as well. p<0.01; bars indicate significant differences.
The percentage of damage propagating from alizarin-labeled damage was not different between the age groups: 46% of the younger group and 43% of the older group’s static load-induced damage (alizarin-labeled) was classified as propagated (exhibiting dual-fluorescence). Overwhelmingly, propagated damage adhered to the morphology it assumed at initial formation; less than 5% of total propagated damage changed morphological categories (e.g. linear remained linear, diffuse remained diffuse, etc).
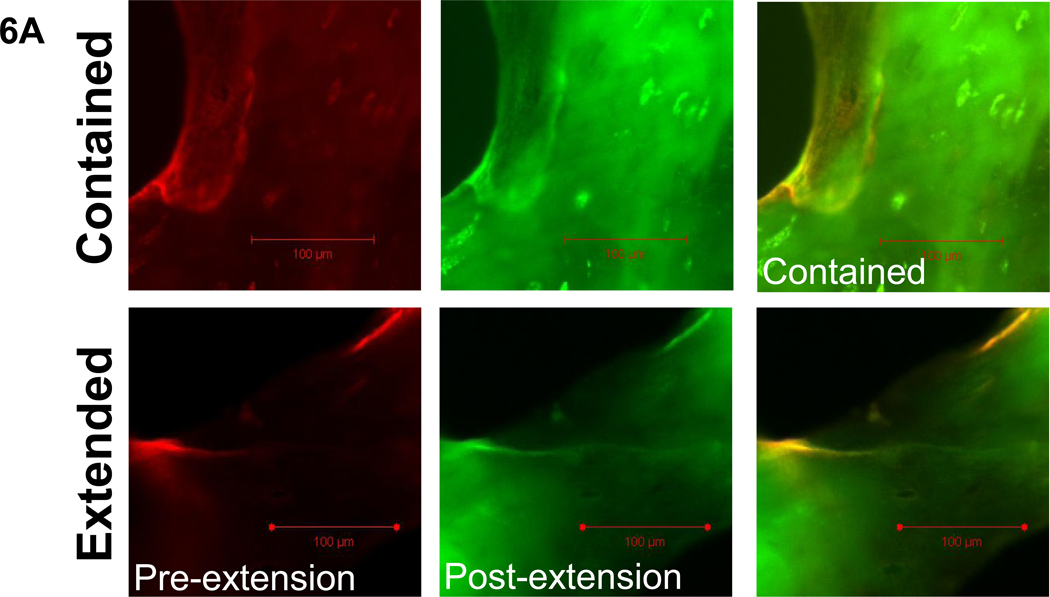
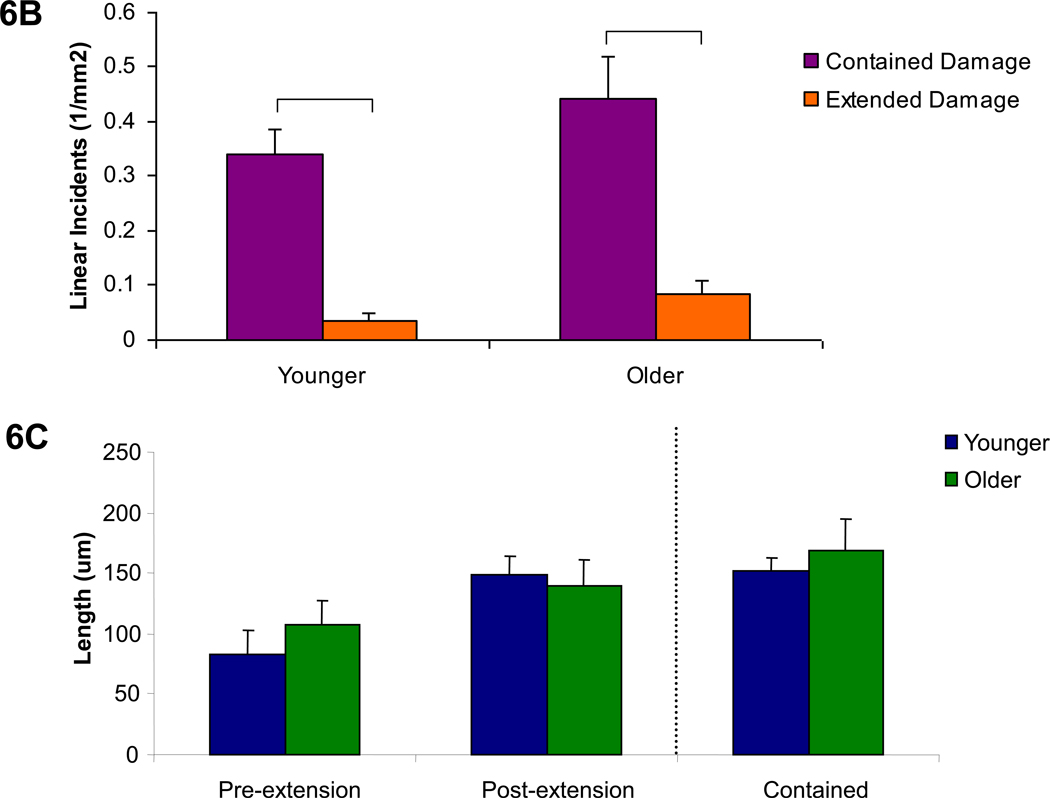
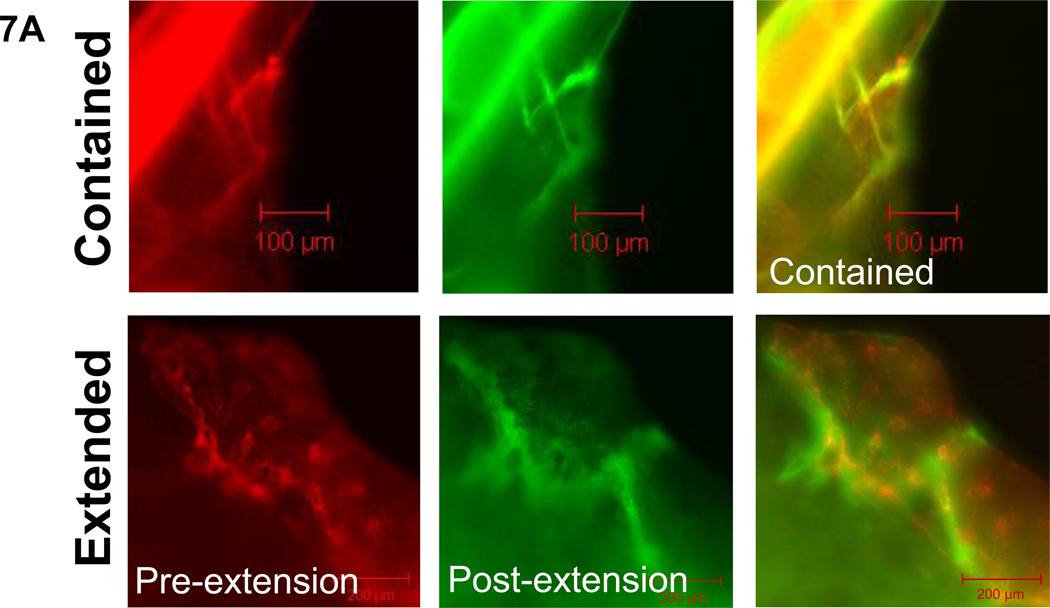
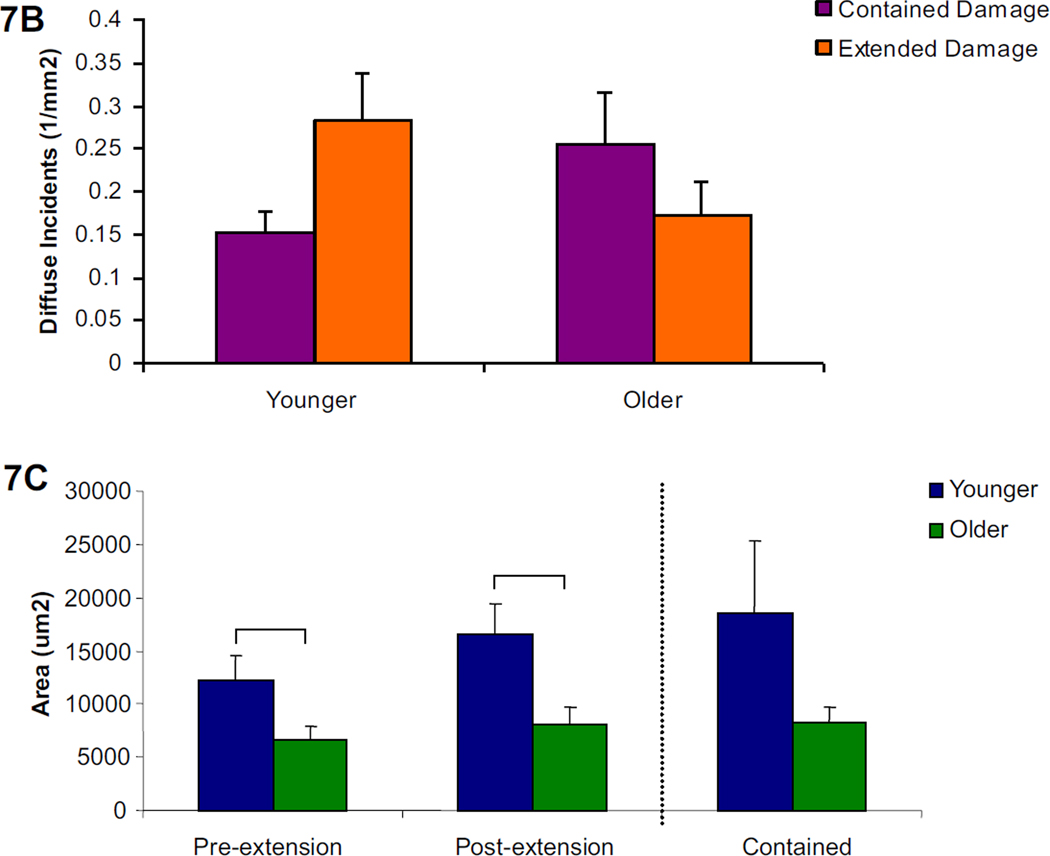
Propagated damage was classified according to its fluorescence pattern. Damage incidents demonstrating completely overlapping fluorescence of alizarin and calcein labels were classified as contained damage, while calcein-labeled regions which increased the damage area or length of an initial alizarin-labeled damage incident were classified as extended damage (Figures 6a, 7a, and 8a). It was found that linear propagated damage was more contained than extended in both age groups (Figure 6b, p<0.001). No differences in linear damage length were found. (Figure 6c)
Figure 6. Linear propagated damage images, character, and length by age group.
6a. Examples of the two groups of propagated linear damage, contained and extended, are shown under filters for each fluorescent stain as well as the composite image (alizarin=red, calcein=green). 6b. Comparisons of the number of contained versus extended damage incidents demonstrated that damage of a linear morphology was more likely to remain confined to its initial damage length in both age groups. 6c. Length measurements of linear damage incidents showed that the initial length of damage (initial extended) which extended during the fatigue test (final extended) did not exceed the length of contained linear damage incidents for both age groups. Bars represent significant differences.
Figure 7. Diffuse propagated damage images, character, and length by age group.
7a. Examples of the two types of propagated diffuse damage, contained and extended, are shown under filters for each fluorescent stain as well as the composite image (alizarin=red, calcein=green). 7b. No significant differences by propagation type or age group were seen among diffuse damage incidents. 7c. Measurements of the initial extended diffuse damage area after static loading and final extended damage area after cyclic loading showed significant increases in the younger group compared to the older group. The final extended damage area did not exceed the damage area for contained damage in either age group. Bars represent significant differences.
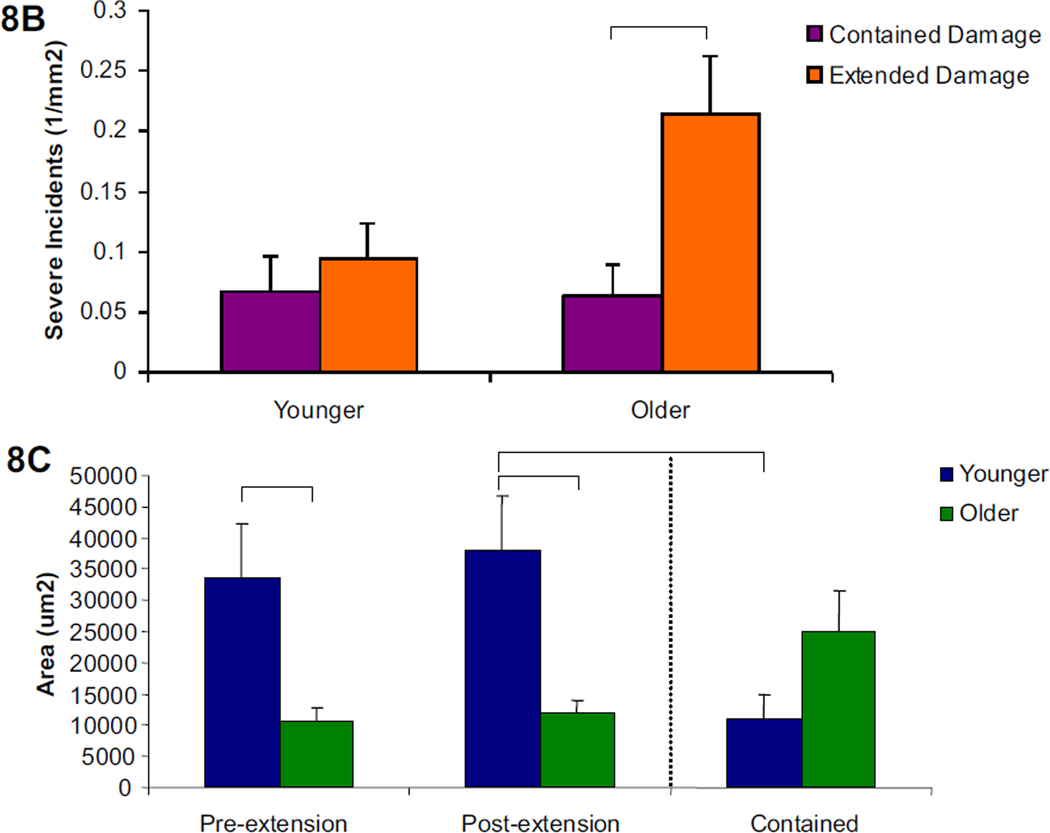
Figure 8. Severe propagated damage images, character, and length by age group.
8a. Examples of the two types of propagated severe damage, contained and extended, are shown under filters for each fluorescent stain as well as the composite image (alizarin=red, calcein=green). 8b. In the older age group, propagated severe damage was more likely to be extended than contained. 8c. Damage areas in the initial extended group after static loading and final extended group after cyclic loading were greater in younger compared to older groups. In the younger group, the final extended damage area was significantly greater than the contained damage area. Bars represent significant differences.
No age-related differences in the propagation character (extended vs. contained) of diffuse damage incidents was found, although the damage area for the younger group was significantly greater than the older group in the initial and final extended damage area (Figure 7b and c, p<0.05). Among severe damage, incidents in the older group were significantly more extended than contained (Figure 8b, p<0.02), while no differences were seen in the younger age group. When the severe damage areas were compared, the younger group had a significantly larger damage area in the initial and final extended damage group compared with the older group. (Figure 8c, p<0.02) The final extended damage area in the younger age group was also significantly greater than the damage area of contained propagation. (p<0.03)
Discussion
In this study, trabecular bone cores from the femoral head of 10 younger and 10 older individuals were subjected to a two-step mechanical testing protocol. Microdamage was first induced with static uniaxial compressive loading to 0.8% then propagated with cyclic uniaxial compressive loading under a modest normalized stress range. It was found that samples from older donors reached the fatigue test endpoint with substantially fewer cycles than younger individuals. This was associated with greater numbers of extending severe damage incidents in the older group compared to the younger group.
At the normalized stress level used in this study, no differences in linear crack propagation character or length due to cyclic loading were observed in either age group, perhaps due to microstructural barriers which arrested crack propagation. (Wang et al. 2006) This makes it unlikely that these damage incidents had a large impact on age differences in fatigue life. Among diffusely damaged extended cracks, however, a larger damage area was found in the younger compared with the older group. This result corroborates findings by Diab et al, which found that younger donors had a longer fatigue life and formed more diffuse damage than older donors. (Diab et al. 2006) This mechanism illustrates an efficient energy dissipation strategy which protects the overall structural integrity of the trabecular bone lattice by localizing damage expansion within a morphology that is less likely to propagate, and may provide one explanation for aging differences in fatigue life. (Diab et al. 2005; Badiei et al. 2007; Cook et al. 2009)
Examination of propagating severe damage showed that cracks in samples from older donors were more likely to be expanding in area with fatigue. Despite large differences in severe damage area between age groups, the percent difference between initial and final area was similar (13% in younger vs 12% in older). This suggests that the age-related differences in the time to the fatigue strain endpoint were driven in part by the number of severe damage incidents that were expanding, rather than the damage area. It is advantageous to concentrate damage progression in trabeculae which are already compromised rather than damaging a greater number of trabeculae, as the probability of overt fracture increases as the number of failed trabeculae increases. (Guo et al. 1994; Cook et al. 2009) Differences in bone mineral age and density, alterations in collagen quality, and other changes in the composition of the bone matrix may play a role in severe damage expansion. (Currey et al. 1996; Zioupos 2001; Wang et al. 2002; Seeman 2003)
It was surprising to see that the initial severe damage area of younger individuals was much greater than older individuals. This phenomenon has been observed in mechanical testing of alendronate-treated bone, where decreased amounts of severe damage were formed in alendronate-treated bone which had increased levels of in vivo damage compared to controls. (O'Neal et al. 2010) It is probable that the older bone was initially more damaged and that sites vulnerable to damage initiation already exhibited microcracks. (Schaffler et al. 1995; Vashishth et al. 1997) In the less damaged core from younger donors, vulnerable sites would be more likely to experience higher stresses/strains at damage initiation than in vivo, resulting in more extensive initial damage.
While sex-related differences in microdamage formation and propagation were examined in this study, no meaningful differences emerged. The results suggest that age-related differences in trabecular architecture and arrangement are a bigger factor in influencing damage character than sex differences. It is likely that at the microstructural level, bone behaves similarly regardless of sex, while at the apparent level, sex is more relevant to fracture risk due to differences in bone mass and force distribution.
In the fatigue portion of the mechanical test, the stress-strain loop translated along the strain axis. While some have suggested that this translation is due to creep (Carter et al. 1983), further investigation has shown that it is predominantly due to microdamage accumulation and propagation at low normalized stress levels. (Moore et al. 2003; Moore et al. 2003; Moore et al. 2004) We did not note a change in the secant elastic modulus between the beginning and end of the cyclic loading protocol in any of the groups. Further investigation revealed that the samples that reached 150,000 cycles experienced an average increase in the elastic modulus of 11%, while all other samples experienced an average decrease in modulus of 2% (p<0.02). This phenomenon has been observed in many previously published studies of fatigue loading in trabecular bone. (Linde et al. 1987; Michel et al. 1993; Moore et al. 2003) It is likely that a viscoelastic steady state had not been reached in the first 10 preconditioning cycles of the fatigue test, leading to an underestimation of stiffness. (Linde 1994) The effect would be particularly pronounced in samples that went to 150,000 cycles due to their greater initial stiffness relative to other samples (419.9 ± 34.7 MPa in 150,000 cycle samples vs. 317.1 ± 99.5 MPa in all others). (Linde 1994; Sobelman et al. 2004)
There are a number of limitations to consider in interpreting these results. Strain levels used in this study, while remaining at levels below the uniaxial yield strain, are still higher than would be expected due to physiological loading. (Yang et al. 2011) For sex comparisons, no differences in number of cycles or the amount of microdamage were found, though achieved power (1-β=0.2 for both parameters) was too low to detect subtle differences. Although consistent with other studies showing no sex differences in fatigue life, larger studies may find meaningful sex differences. (Sobelman et al. 2004) Finally, damage morphology and stain location were evaluated from thin slides, which may result in some erroneous classifications if additional cracks or evidence of damage propagation extended into the plane perpendicular to the evaluated planes. The large number of damage incidents evaluated in this study should limit the influence of such errors if they occurred.
In conclusion, a novel mechanical testing protocol was used to induce propagation of microdamage in trabecular bone of the proximal femur in younger and older individuals. A decreased number of cycles to the test endpoint in older individuals were attributed to the damage area expansion of a greater number of trabeculae exhibiting severe damage morphology coupled with a more efficient strain energy dissipation mechanism among diffusely damaged trabeculae in younger individuals.
Acknowledgments
This research study was supported by NIH grant R01 AG027249. The micro-CT system was provided by NSF Major Research Instrumentation Award 9977551.
Footnotes
Publisher's Disclaimer: This is a PDF file of an unedited manuscript that has been accepted for publication. As a service to our customers we are providing this early version of the manuscript. The manuscript will undergo copyediting, typesetting, and review of the resulting proof before it is published in its final citable form. Please note that during the production process errors may be discovered which could affect the content, and all legal disclaimers that apply to the journal pertain.
Conflict of Interest Statement
The authors have no conflicts of interest to disclose.
References
- Allen MR, Burr DB. Skeletal Microdamage: Less About Biomechanics and More About Remodeling. Clinic Rev Bone Miner Metab. 2008;6:24–30. [Google Scholar]
- Arlot ME, Burt-Pichat B, et al. Microarchitecture Influences Microdamage Accumulation in Human Vertebral Trabecular Bone. Journal of Bone and Mineral Research. 2008;23(10):1613–1618. doi: 10.1359/jbmr.080517. [DOI] [PMC free article] [PubMed] [Google Scholar]
- Badiei A, Bottema MJ, et al. Influence of orthogonal overload on human vertebral trabecular bone mechanical properties. J Bone Miner Res. 2007;22(11):1690–1699. doi: 10.1359/jbmr.070706. [DOI] [PubMed] [Google Scholar]
- Bergot C, Laval-Jeantet AM, et al. Measurement of anisotropic vertebral trabecular bone loss during aging by quantitative image analysis. Calcif Tissue Int. 1988;43(3):143–149. doi: 10.1007/BF02571311. [DOI] [PubMed] [Google Scholar]
- Burr DB, Forwood MR, et al. Bone microdamage and skeletal fragility in osteoporotic and stress fractures. J Bone Miner Res. 1997;12(1):6–15. doi: 10.1359/jbmr.1997.12.1.6. [DOI] [PubMed] [Google Scholar]
- Burr DB, Martin RB, et al. Bone remodeling in response to in vivo fatigue microdamage. J Biomech. 1985;18(3):189–200. doi: 10.1016/0021-9290(85)90204-0. [DOI] [PubMed] [Google Scholar]
- Burr DB, Stafford T. Validity of the bulk staining technique to seperate artifactual from in vivo bone microdamage. Clin. Orthop. Relat. Res. 1990;260:305–208. [PubMed] [Google Scholar]
- Burr DB, Turner CH, et al. Does microdamage accumulation affect the mechanical properties of bone? J Biomech. 1998;31(4):337–345. doi: 10.1016/s0021-9290(98)00016-5. [DOI] [PubMed] [Google Scholar]
- Caler WE, Carter DR. Bone creep-fatigue damage accumulation. J Biomech. 1989;22(6–7):625–635. doi: 10.1016/0021-9290(89)90013-4. [DOI] [PubMed] [Google Scholar]
- Carter DR, Caler WE. Cycle-dependent and time-dependent bone fracture with repeated loading. J Biomech Eng. 1983;105(2):166–170. doi: 10.1115/1.3138401. [DOI] [PubMed] [Google Scholar]
- Cook RB, Zioupos P. The fracture toughness of cancellous bone. J Biomech. 2009;42(13):2054–2060. doi: 10.1016/j.jbiomech.2009.06.001. [DOI] [PubMed] [Google Scholar]
- Currey JD, Brear K, et al. The effects of ageing and changes in mineral content in degrading the toughness of human femora. J Biomech. 1996;29(2):257–260. doi: 10.1016/0021-9290(95)00048-8. [DOI] [PubMed] [Google Scholar]
- Diab T, Condon KW, et al. Age-related change in the damage morphology of human cortical bone and its role in bone fragility. Bone. 2006;38(3):427–431. doi: 10.1016/j.bone.2005.09.002. [DOI] [PubMed] [Google Scholar]
- Diab T, Vashishth D. Effects of damage morphology on cortical bone fragility. Bone. 2005;37(1):96–102. doi: 10.1016/j.bone.2005.03.014. [DOI] [PubMed] [Google Scholar]
- Guo XE, McMahon TA, et al. Finite element modeling of damage accumulation in trabecular bone under cyclic loading. J Biomech. 1994;27(2):145–155. doi: 10.1016/0021-9290(94)90203-8. [DOI] [PubMed] [Google Scholar]
- Huja SS, Hasan MS, et al. Development of a fluorescent light technique for evaluating microdamage in bone subjected to fatigue loading. J Biomech. 1999;32(11):1243–1249. doi: 10.1016/s0021-9290(99)00047-0. [DOI] [PubMed] [Google Scholar]
- Keaveny TM, Guo XE, et al. Trabecular bone exhibits fully linear elastic behavior and yields at low strains. J Biomech. 1994;27(9):1127–1136. doi: 10.1016/0021-9290(94)90053-1. [DOI] [PubMed] [Google Scholar]
- Keaveny TM, Yeh OC. Architecture and trabecular bone - toward an improved understanding of the biomechanical effects of age, sex and osteoporosis. J Musculoskelet Neuronal Interact. 2002;2(3):205–208. [PubMed] [Google Scholar]
- Linde F. Elastic and Viscoelastic Properties of Trabecular Bone by a Compression Testing Approach. Danish Medical Bulletin. 1994;41(2):119–138. [PubMed] [Google Scholar]
- Linde F, Hvid I. Stiffness behaviour of trabecular bone specimens. J Biomech. 1987;20(1):83–89. doi: 10.1016/0021-9290(87)90270-3. [DOI] [PubMed] [Google Scholar]
- Michel MC, Guo XD, et al. Compressive fatigue behavior of bovine trabecular bone. J Biomech. 1993;26(4–5):453–463. doi: 10.1016/0021-9290(93)90009-4. [DOI] [PubMed] [Google Scholar]
- Moore TL, Gibson LJ. Fatigue microdamage in bovine trabecular bone. J Biomech Eng. 2003;125(6):769–776. doi: 10.1115/1.1631584. [DOI] [PubMed] [Google Scholar]
- Moore TL, Gibson LJ. Fatigue of bovine trabecular bone. J Biomech Eng. 2003;125(6):761–768. doi: 10.1115/1.1631583. [DOI] [PubMed] [Google Scholar]
- Moore TL, O'Brien FJ, et al. Creep does not contribute to fatigue in bovine trabecular bone. J Biomech Eng. 2004;126(3):321–329. doi: 10.1115/1.1762892. [DOI] [PubMed] [Google Scholar]
- Mosekilde L. Sex differences in age-related loss of vertebral trabecular bone mass and structure--biomechanical consequences. Bone. 1989;10(6):425–432. doi: 10.1016/8756-3282(89)90074-4. [DOI] [PubMed] [Google Scholar]
- Norman TL, Yeni YN, et al. Influence of microdamage on fracture toughness of the human femur and tibia. Bone. 1998;23(3):303–306. doi: 10.1016/s8756-3282(98)00103-3. [DOI] [PubMed] [Google Scholar]
- O'Brien FJ, Taylor D, et al. An improved labelling technique for monitoring microcrack growth in compact bone. J Biomech. 2002;35(4):523–526. doi: 10.1016/s0021-9290(01)00200-7. [DOI] [PubMed] [Google Scholar]
- O'Brien FJ, Taylor D, et al. Microcrack accumulation at different intervals during fatigue testing of compact bone. J Biomech. 2003;36(7):973–980. doi: 10.1016/s0021-9290(03)00066-6. [DOI] [PubMed] [Google Scholar]
- O'Neal JM, Diab T, et al. One year of alendronate treatment lowers microstructural stresses associated with trabecular microdamage initiation. Bone. 2010;47(2):241–247. doi: 10.1016/j.bone.2010.05.016. [DOI] [PMC free article] [PubMed] [Google Scholar]
- Pattin CA, Caler WE, et al. Cyclic mechanical property degradation during fatigue loading of cortical bone. J Biomech. 1996;29(1):69–79. doi: 10.1016/0021-9290(94)00156-1. [DOI] [PubMed] [Google Scholar]
- Schaffler MB, Choi K, et al. Aging and matrix microdamage accumulation in human compact bone. Bone. 1995;17(6):521–525. doi: 10.1016/8756-3282(95)00370-3. [DOI] [PubMed] [Google Scholar]
- Seeman E. Reduced bone formation and increased bone resorption: rational targets for the treatment of osteoporosis. Osteoporos Int. 2003;14 Suppl 3:S2–S8. doi: 10.1007/s00198-002-1340-9. [DOI] [PubMed] [Google Scholar]
- Shi X, Liu XS, et al. Effects of trabecular type and orientation on microdamage susceptibility in trabecular bone. Bone. 2010;46(5):1260–1266. doi: 10.1016/j.bone.2010.02.005. [DOI] [PMC free article] [PubMed] [Google Scholar]
- Sobelman OS, Gibeling JC, et al. Do microcracks decrease or increase fatigue resistance in cortical bone? J Biomech. 2004;37(9):1295–1303. doi: 10.1016/j.jbiomech.2003.12.034. [DOI] [PubMed] [Google Scholar]
- Stepan JJ, Burr DB, et al. Low bone mineral density is associated with bone microdamage accumulation in postmenopausal women with osteoporosis. Bone. 2007;41(3):378–385. doi: 10.1016/j.bone.2007.04.198. [DOI] [PubMed] [Google Scholar]
- Thomsen JS, Ebbesen EN, et al. A new method of comprehensive static histomorphometry applied on human lumbar vertebral cancellous bone. Bone. 2000;27(1):129–138. doi: 10.1016/s8756-3282(00)00285-4. [DOI] [PubMed] [Google Scholar]
- Vashishth D, Behiri JC, et al. Crack growth resistance in cortical bone: concept of microcrack toughening. J Biomech. 1997;30(8):763–769. doi: 10.1016/s0021-9290(97)00029-8. [DOI] [PubMed] [Google Scholar]
- Vashishth D, Tanner KE, et al. Contribution, development and morphology of microcracking in cortical bone during crack propagation. J Biomech. 2000;33(9):1169–1174. doi: 10.1016/s0021-9290(00)00010-5. [DOI] [PubMed] [Google Scholar]
- Wang X, Niebur GL. Microdamage propagation in trabecular bone due to changes in loading mode. J Biomech. 2006;39(5):781–790. doi: 10.1016/j.jbiomech.2005.02.007. [DOI] [PubMed] [Google Scholar]
- Wang X, Shen X, et al. Age-related changes in the collagen network and toughness of bone. Bone. 2002;31(1):1–7. doi: 10.1016/s8756-3282(01)00697-4. [DOI] [PubMed] [Google Scholar]
- Yang PF, Bruggemann GP, et al. What do we currently know from in vivo bone strain measurements in humans? J Musculoskelet Neuronal Interact. 2011;11(1):8–20. [PubMed] [Google Scholar]
- Zioupos P. Accumulation of in-vivo fatigue microdamage and its relation to biomechanical properties in ageing human cortical bone. J Microsc. 2001;201(Pt 2):270–278. [PubMed] [Google Scholar]
- Zioupos P. Ageing human bone: factors affecting its biomechanical properties and the role of collagen. J Biomater Appl. 2001;15(3):187–229. doi: 10.1106/5JUJ-TFJ3-JVVA-3RJ0. [DOI] [PubMed] [Google Scholar]


