Abstract
The PI3 kinase/Akt pathway is commonly deregulated in human cancers, functioning in such processes as proliferation, glucose metabolism, survival and motility. We have previously described a novel function for one of the Akt isoforms (Akt3) in primary endothelial cells: the control of VEGF-induced mitochondrial biogenesis. We sought to determine if Akt3 played a similar role in carcinoma cells. Since the PI3 kinase/Akt pathway has been strongly implicated as a key regulator in ovarian carcinoma, we tested the role of Akt3 in this tumor type. Silencing of Akt3 by shRNA did not cause an overt reduction in mitochondrial gene expression in a series of PTEN positive ovarian cancer cells. Rather, we find that blockade of Akt3, results in smaller, less vascularized tumors in a xenograft mouse model that is correlated with a reduction in VEGF expression. We find that blockade of Akt3, but not Akt1, results in a reduction in VEGF secretion and retention of VEGF protein in the endoplasmic reticulum (ER). The reduction in secretion under conditions of Akt3 blockade is, at least in part, due to the down regulation of the resident golgi protein and reported tumor cell marker, RCAS1. Conversely, over-expression of Akt3 results in an increase in RCAS1 expression and in VEGF secretion. Silencing of RCAS1 using siRNA inhibits VEGF secretion. These findings suggest an important role for Akt3 in the regulation of RCAS1 and VEGF secretion in ovarian cancer cells.
Keywords: Akt3, VEGF, secretion, ovarian cancer, xenograft model, angiogenesis
Introduction
Ovarian cancer continues to be a major cause of death in women worldwide, accounting for at least 4% of all diagnosed cancers in women. Most ovarian cancer patients present with advanced disease and even with aggressive treatment most patients relapse and develop drug-resistance. As survival rates are approximately 3 years, new therapies are required for the treatment of ovarian cancer. One promising avenue for ovarian cancer cell treatment is inhibition of angiogenesis. New vessel development is crucial for the reproductive cycle and normal ovarian function, and is implicated during ovarian cancer development1. Angiogenesis is thought to be a relatively early event in ovarian cancer. Although ovarian tumors spread via peritoneal dissemination, new vasculature is required for the growth of the primary tumor and the metastases are dependent on new vessels for their sustained growth2.
Angiogenesis is required for the growth, maintenance, and metastasis of tumors. Vascular endothelial growth factor (VEGF) is widely accepted to be a main inducer of vascularization and angiogenesis, both during development and during the growth of primary tumors. Tumors, under hypoxic conditions, induce the expression of VEGF via the hypoxia-inducible transcription factor Hif1α 3-5. VEGF then stimulates an angiogenic response via VEGF receptors (VEGFR1 and VEGFR2) expressed on endothelial cells. New vessels supply the growing tumor with appropriate nutrients and oxygen for further development and metastasis. Although VEGF receptors had been thought to be specific to endothelial cells, it has become clear that many tumors, including ovarian cancer cells, express these receptors and are responsive to VEGF, resulting in a paracrine loop 6. In addition, VEGF is found in fluid-filled cysts generated during ovarian cancer development which is required for ascites formation1. VEGF levels are a negative prognostic indicator: patients with high levels of VEGF have significantly lower survival rates. Anti-VEGF treatments such as bevacizumab, a monoclonal antibody directed against VEGF, has shown some promise for the treatment of drug resistant ovarian cancer 7, however, new targets for inhibition of this signaling pathway need to be developed.
PI3K is up-regulated in approximately 40% of all ovarian cancers and its downstream effectors, Akt1 and Akt2, are also activated and/or over-expressed in a variety of tumors including ovarian cancers8. Akt3 is up-regulated in over 20% of primary ovarian tumors and has been shown to be involved in the regulation of the G2/M transition9. Although the Akt family members share approximately 80% homology at the amino acid level, have similar domain structure including pleckstrin homology (PH), kinase and regulatory domains and are PI3 kinase (PI3K) dependent 10, 11, there is emerging evidence that each family member has differential function depending on the cell type. For example, Akt1 is required for breast cancer development in MMTV-Her2/neu driven cancers, whereas ablation of Akt2 results in increased carcinogenesis12. Akt2 is amplified and over-expressed in a large fraction of pancreatic cancers 13, 14 and has recently been shown to be critical for the metastasis of colorectal cancers 15. Akt3 activity is increased in over 70% of melanoma acting as an important cell survival factor in this type of cancer 9, 16. In some tumor cells Akt1 can increase the stability and/or translation of the hypoxia inducible factor Hif1α thus acting upstream of VEGF production 17-20.
Akt3 is important for maintenance of brain homeostasis 21, 22. We have previously shown that Akt3 is an important regulator of mitochondrial biogenesis in primary endothelial cells and that this function is specifically regulated by Akt3, not by Akt1. Indeed, Akt3 null animals display a mitochondrial phenotype in brain tissue 23. We sought to test whether inhibition of Akt3 leads to changes in mitochondrial function in tumors derived from carcinoma cells similarly to that described in endothelial cells. Silencing of Akt3 by shRNA did not result in an overt reduction in mitochondrial function in PTEN positive cancer cells, assessed either by changes in mitochondrial-specific expression or by changes in the rate of O2 consumption. Using a xenograft mouse model, we show that Akt3 knockdown results in smaller tumor size and in decreased VEGF secretion and vascularization. Blockade of Akt3, not Akt1, results in a reduction in VEGF secretion by ovarian cancer cells. This reduction is not due to inhibition of VEGF expression but is instead due to retention of VEGF protein in the endoplasmic reticulum. The reduction in secretion is, at least in part, due to the reduced expression of the RCAS-1 tumor cell marker. Indeed, knockdown of RCAS-1 expression using RNAi also results in a decreased secretion of VEGF. Over-expression of Akt3 results in increased RCAS1 expression and in VEGF secretion. These findings suggest an important role for Akt3 in the regulation of VEGF secretion in ovarian cancer cells.
Materials and Methods
Cell Culture and Lentiviral Transduction
786-O cells were obtained from ATTC and maintained in DMEM supplemented as below. ES2, SKOV3, and A2789 ovarian cancer cells and PANC1 pancreatic cancer cells (gifts from S. Eblen and C. Schweinfest, Medical University of South Carolina) were maintained at 37°C with 5% CO2 in McCoy's 5A (ES2) or DMEM (SKOV3, A2789 and PANC-1) (Lonza, Basal, Switzerland) supplemented with L-glutamine, 10% fetal bovine serum (FBS, Valley Biomedical Inc, Winchester, VA, USA) and 1% penicillin/streptomycin (Invitrogen, Carlsbad, CA). Serum starved medium was supplemented with 0.1% FBS and 1% penicillin/streptomycin.
Mission shRNA lentiviral constructs directed against Akt1 and Akt3 were purchased from Sigma/Aldrich. A scrambled pLKO.1 shRNA vector was purchased from Addgene. Lentiviruses were propagated in 293T cells, maintained in DMEM supplemented as above. Lentiviral production was performed using psPAX2 and pMD2.G packaging vectors purchased from Addgene using the protocol for producing lentiviral particles from Addgene. For transduction of target cells, 7.5 × 10⁵ cells were plated on 100 mm2 plates and allowed to incubate overnight. The next day cells were transduceded using a final concentration of 1 μg/ml polybrene and either scrambled control, Akt1 or Akt3 shRNA lentiviruses. All transductions were monitored for appropriate knockdown by RT-PCR.
RNAi directed against RCAS1 (Santa Cruz, Santa Cruz, CA) or against Akt3 (Upstate-Smart Pool, Lake Placid, NY) were transiently transfected using Lipofectamine (Invitrogen) by procedures outlined by the manufacturer. Cells were assessed 48 hours post transfection. A full length Akt3 expression vector was purchased from Genecopoeia, Inc. (Rockville, MD).
All primer pairs are listed as follows: Akt3: forward 5′ TGGACAAAGATGGCCACATA 3′, reverse 5′ ATCAAGAGCCCTGAAAGCAA 3′; CoxII: forward 5′ TCCATGATCACGCCCTCATA 3′, reverse 5′ TAAAGGATGCGTAGGGATGG 3′; HPRT: forward 5′ CTTGCTCGAGATGTGATGA 3′, reverse 5′ GTCTGCATTGTTTTGCCAGTG 3′; RCAS1: forward 5′ GAGTGGACTTCCTGGGATGA 3′, reverse 5′ CCCATGCATTGGTATTTTCC 3′; VEGF: forward 5′ CGAAACCATGAACTTTCTGC 3′, reverse 5′ CCTCAGTGGGCACACACTCC 3′; S26: forward 5′ CTCCGGTCCGTGCCTCCAAG 3′,reverse 5′ CAGAGAATAGCCTGTCTTCAG 3′.
Gene Array Analyses
To assess Akt3 specific target genes, Atlas nylon based gene arrays (Clontech, Mountain View, CA, USA) were used for microarray analyses in procedures described by the manufacturer. Briefly, total RNA isolated from ES2 cells transduced with scrambled or Akt3 shRNA was used to create 32P-radiolabeled for hybridization to the Atlas Select Human Oncogene array. This array contained approximately 600 genes that were differentially expressed between MCF7 breast carcinoma cells and MCF7-ErbB2, a breast carcinoma over-expressing the tyrosine kinase receptor, ErbB2. Akt3-specific changes in gene expression were assessed by autoradiography followed by analysis using AtlasImage software in procedures provided by the manufacturer (Clontech).
Western Blot Analyses, Antibodies and Immunoprecipitation
The antibodies used for Western blot analysis are as follows: anti-p85 subunit of PI3K (Upstate Biotechnology, Lake Placid, New York), anti-actin (Sigma-Aldrich, St. Louis, MO, USA), anti-Akt1/2 (Santa Cruz, Santa Cruz, CA, USA), anti-Akt3 (UpState Biotechnology), anti-phospho-specific Akt (Cell Signaling, Danvers, MA, USA, UpState Biotechnology), and anti-VEGF (Santa Cruz). Appropriate HRP-conjugated secondary antibodies were purchased from Caltag (Invitrogen, Carlsbad, CA, USA).
For Western blot analyses of conditioned media, media of transduced cells was changed to serum starvation media for 6 hours, collected and concentrated by Centricon centrifugal concentrators MW 3000 (Millipore, Billerica, MA, USA) to 400μl. For total cell lysate, treated cells were washed once with 1X PBS and lysed in 1× NP40 Lysis Buffer (50mM Tris-HCl, pH7.4, 150mM NaCl, 40mM NaF, 0.5mM Na3PO4, 1% NP40) supplemented with Complete Protease Inhibitors without EDTA (Roche, Palo Alto, CA, USA) and 200 μM Na3PO4. Protein concentrations were determined by a BCA protein assay (Pierce, Rockford, IL, USA). Equal volumes of supernatant or amounts of protein were resolved by either 10% or 12% SDS-PAGE and transferred onto Immobilon-P PVDF membranes (Millipore). Blots were blocked in Blotto (5% nonfat dry milk in TBS (150mM NaCl, 10mM Tris pH7.4) plus 0.1% Tween-20) for 30 min and then probed with appropriate antibodies overnight at 4°C. Proteins were visualized using Luminol Reagent (Santa Cruz).
For immunoprecipitations, equal amounts of protein were incubated overnight with antibody at 4°C. The appropriate amount of antibody was empirically determined to insure antibody excess. Protein A and G Sepharose (Amersham Biosciences, Piscataway, NJ, USA) was added for an additional 45 min. Immunoprecipitates were pelleted, washed with 1 ml 1× NP40 Lysis Buffer, resolved on SDS-PAGE and subjected to Western blot analysis.
Measurements of O2 consumption
A Seahorse Bioscience XF24 instrument was used to measure the rate of change of dissolved O2 and pH in medium immediately surrounding ES2 cells transduced with scrambled or Akt3 shRNA lentiviruses. Measurements were performed using a cartridge where 24 optical fluorescent O2 and pH sensors are configured as individual well “plungers.” For measurements of rates, the plungers gently descended into the wells, forming a chamber that entraps the cells in ∼7 μl volume. O2 concentration and pH were measured over 1 min, a period of time that this is insufficient for >5–10% change in gross O2 levels. The rates of O2 consumption were obtained from the slopes of concentration changes vs. time. For preparation of the cell plate for assay with the XF24 instrument, 1 ml of Krebs-Henseleit buffer lacking bicarbonate (111 mM NaCl, 4.7 mM KCl, 2.0 mM MgSO4, 1.2 mM Na2HPO4, 0.24 mM MgCl2, 2.5 mM glucose, 0.5 mM carnitine, and 100 nM insulin) warmed to 37°C was added to each well containing 0.5 × 10⁶ ES2 cells. These assays were performed in at least triplicate three independent times.
RT-PCR
For RT-PCR, RNA was extracted with Qiagen RNeasy Mini Kit (Hilden, Germany) following manufacturer's instructions. cDNA was synthesized from 2μg total RNA with a Superscript First Strand Synthesis Kit (Invitrogen), using Oligo(dT) following the manufacturer's instructions. PCR reactions contained equal amounts of cDNA and 1.25 μM of the appropriate primer pair (Sigma-Proligo, St. Louis, MO, USA) as listed in Table 1. Cycling conditions were: 94°C for 5 min; 30-35 cycles of 94°C for 1 min, 55-65°C (based on primer Tm) for 1 min, 72°C for 1min; 72°C for 7 min and cooled to 4°C. Cycle number was empirically determined to be within the linear range of the assay for each primer pair used. All semi-quantitative RT-PCR was performed in tandem with hypoxanthine-guanine phosphoribosyltransferase (HPRT) or the ribosomal protein subunit S26 primers as internal controls. Products were run on 1-1.5% (based on product size) agarose gels and visualized on a BioRad Molecular Imaging System (Hercules, CA, USA).
Table 1. Akt3 Dependent Genes.
| Genes Down-Regulated | Accession Number | Fold Change |
|---|---|---|
| RCAS1 (EBAG9) | NM_198120.1 | >4 |
| Casein kinase 1 gamma 2 | U89896 | >3 |
| Ras-related Rab5a | NM_004162.4 | >3 |
| Genes Up-Regulated | Accession Number | Fold Change |
| Prostate apoptosis response protein (Par-4) | U63809 | >2 |
| NM23-H2 | L16785 | >2 |
| HMG-17 | M12623 | >2 |
| Thymosin B10 | M92381 | >2 |
| 60S ribosomal protein L7 | NM_000971.3 | >2 |
| Eukaryotic initiation factor 4B | X55733 | >2 |
| Polyadenylate binding protein | Y00345 | >2 |
| ATP synthase, mitochondrial F1 complex O subunit | X83218 | >2 |
List of genes either down or up-regulated in ES2 cells expressing Akt3 shRNA as compared to cells expressing a scrambled control shRNA.
Real time PCR was performed using a Brilliant CYBR green QPCR kit in combination with an Mx3000P Real-Time PCR system both purchased from Stratagene. Internal control primers that detect S26 were used. Real time PCR was performed at least three independent times and at least in triplicate.
Xenograft Model
ES2 cells transduced with scrambled control or Akt3 shRNA lentivirus were selected for two weeks with puromycin at 500ng/ml. Adult female SCID mice were injected subcutaneously (dorsal flank) at 107 cells of either the scrambled control (left) or Akt3 shRNA expressing ES2 cells (right). After 7 days, tumors were dissected, fixed, weighed, and standard paraffin embedding, sectioning, and staining with hematoxylin and eosin (H&E) were performed for microscopic examination.
Statistical analysis was performed using a Sign Test, a nonparametric test of whether there is a difference in the weights of tumors from the two types of cells injected.
Cellular Fractionation
Endoplasmic reticulum isolation was performed by procedures described in Current Protocols 24. Briefly, ES2 cells either transduced with scrambled or Akt3 shRNA lentiviruses for 48 hours. Cells were scraped into PBS and homogenized using a dounce homogenizer. Homogenized cell lysates were adjusted to 1.4M sucrose and layered under a discontinuous sucrose gradient of 1.2 and 0.8M and over a gradient of 1.6M. During centrifugation in a Beckman SW41 at 110×g for 2hr, the ER membranes (heavier) are separated from the Golgi membranes and resolve between the 1.4 and 1.6M layers. Protein concentrations are measured and ER fractions were resolved by SDS PAGE followed by Western blot analysis.
Confocal Microscopy
Transduced cells were seeded onto poly-L-lysine (Sigma) coated cover slips (Fisher, Pittsburgh, PA, USA) and incubated to allow for attachment overnight. Cells were fixed in 3.7% formaldehyde in 1X PBS pH 7.4 for 20 min, washed in PBS and permeabilized in 0.1% Triton X-100 for 20min. After washing in PBS fixed cells were blocked with 5% bovine serum albumin (BSA) in 1X PBS for 30 min with gentle agitation. Cells were incubated with the primary antibody KDEL (gift from Vincent Dammai, Medical University of South Carolina), RCAS1 or VEGF (Santa Cruz) (concentrations of which were empirically determined) for 1 hr, washed in PBS and incubated with the appropriate secondary antibody for 1 hr. Washed cover slips were mounted in Gel/Mount (Biomeda Corporation Foster City, CA, USA) for visualization. Confocal microscopy was performed using the Olympus IX70 microscope equipped with the Fluoview confocal system. Z-stacks were performed with a step size of 0.4 μm and a 60× oil immersion objective.
Tumor tissue samples were dissected from xenograft models and immediately fixed in 4% paraformaldehyde in 1X PBS for 24 hr. Samples were paraffin imbedded and sectioned at 5 μm. Samples were blocked in 5% BSA in 1X PBS for 10 min and rinsed briefly in 1X PBS. Samples were incubated at room temperature with either 1X PBS for control, VEGF primary antibody (AbCam, Cambridge, MA) or anti-α smooth muscle actin (Dako, Denmark) in 1X PBS for 1 hr, then briefly rinsed in 1X PBS. Secondary rabbit-488 or goat-546 AlexaFluor antibody (Invitrogen) was diluted 1:100 in 5% BSA in 1X PBS and applied to samples for 30 min room temperature. Secondary antibody was quenched with distilled water. Samples were then rehydrated through graded alcohols and cleared in xylene twice for 5 min. Samples were mounted in Gel/Mount and cover slipped for visualization using confocal microscopy.
Confocal microscopy was performed using the Olympus IX70 microscope equipped with the Fluoview confocal system. Z-stacks were performed with a step size of 0.4 μm and a 60× oil immersion objective.
Results
Akt3 silencing does not affect mitochondrial function in PTEN positive cell lines
Our previous studies have shown a role for the serine threonine kinase Akt3 (PKBγ) in the regulation of mitochondrial biogenesis in response to VEGF in primary endothelial cells. We sought to test whether this Akt3-specific function was retained in carcinoma cell lines. Using a series of carcinoma cell lines which are all PTEN positive we compared the level of Akt1/2 and Akt3 to a PTEN negative renal cell carcinoma cell line, 786/0. As shown in Figure 1A, the ovarian cancer cell lines ES2, SKOV3 and A2789 and PANC1, a pancreatic cancer cell line, express high levels of Akt3 as compared to the PTEN negative renal cell carcinoma cell line, 786/O. Since ES2 cells had the highest levels of Akt3 expression, we tested the role of Akt3 in mitochondrial gene expression in this cell line using a lentiviral shRNA expression system. Figure 1B shows knockdown of Akt3 protein expression after 48 hours of transduction using a shRNA directed against Akt3 as compared to a scrambled control. Under conditions of Akt3 knockdown, there is little effect on Akt1 levels in this cell line. However, as shown in Figure 1C there is no concurrent repression of mitochondrial coxII gene expression under conditions of Akt3 knockdown nor was there an overt change in mitochondrial DNA content (data not shown). Knockdown of Akt3 expression in ES2 cells did not cause a statistically significant reduction in O2 consumption rates (Fig. 1D). Similar results were obtained using the PANC1 cell line (data not shown). These findings are in direct contrast to those obtained in endothelial cells where mitochondrial DNA content, expression and oxygen consumption are down-regulated in response to Akt3 knockdown 23. These findings suggest that Akt3 does not function directly to regulate mitochondrial biogenesis in carcinoma cell lines as it does in primary endothelial cells.
Fig. 1. Akt3 inhibition does not affect mitochondrial function.
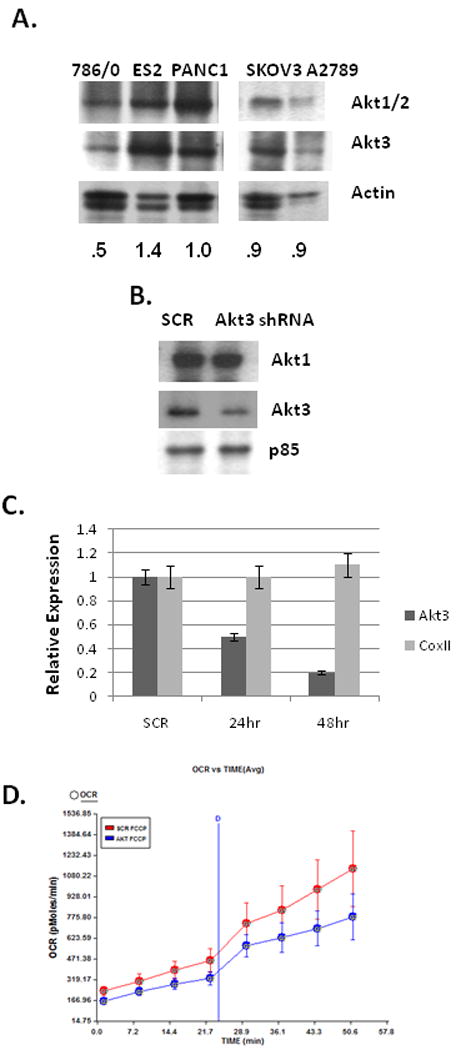
(A) Western blot analysis of Akt1/2 and Akt3 in 786/0 (PTEN-) renal carcinoma, and four PTEN positive cell lines ES2, PANC-1, SKOV3 and A2789. Actin is shown as a loading control. Relative ratios of Akt3 expression as compared to actin are shown. (B) Western blot analysis of Akt1 and Akt3 expression in ES2 cells treated with shRNA scrambled control (SCR) or Akt3 shRNA. The p85 PI3 kinase subunit is used as an internal control. (C) Quantitative RT-PCR of total RNA isolated from ES2 cells treated with an shRNA scrambled control (SCR) or Akt3 shRNA for the times indicated using primers directed against Akt3, mitochondrial coxII and HPRT as an internal control. Relative quantities are shown. (D) Graphical representation of O2 consumption rates obtained in real time of ES2 cells transduced with either a scrambled control (SCR) or Akt3 shRNA lentivirus.
Akt3 knockdown inhibits tumor growth in a xenograft mouse model
Since Akt3 is over-expressed in at least 20% of primary ovarian tumors and some ovarian cell lines possess duplications of the Akt3 gene, we decided to focus on the ovarian carcinoma cell line, ES2, for further study. To test whether Akt3 silencing would result in changes in tumors grown in vivo a xenograft SCID mouse model was used. ES2 cells were stably transduced with lentiviruses expressing either a scrambled control or Akt3 shRNA. Equal amounts of cells were injected subcutaneously into the flank of female SCID mice; each mouse was subjected to two injections, scrambled control and Akt3 shRNA, one on each flank. Tumors were isolated after seven days, weighed and fixed for further analysis. Tumors derived from scrambled control were markedly larger than those derived from ES2 cells expressing Akt3 shRNA. There was a greater than 2-fold size difference in all 12 matched tumors samples (Fig. 2A). These differences were found to be statistically significant (p =0.0386). As shown in Figure 2B, there is little difference in tumor cell proliferation as measured by direct cell counts between Akt3 and scrambled control cells.
Fig. 2. Blockade of Akt3 expression results in reduced tumor growth in a xenograft mouse model.
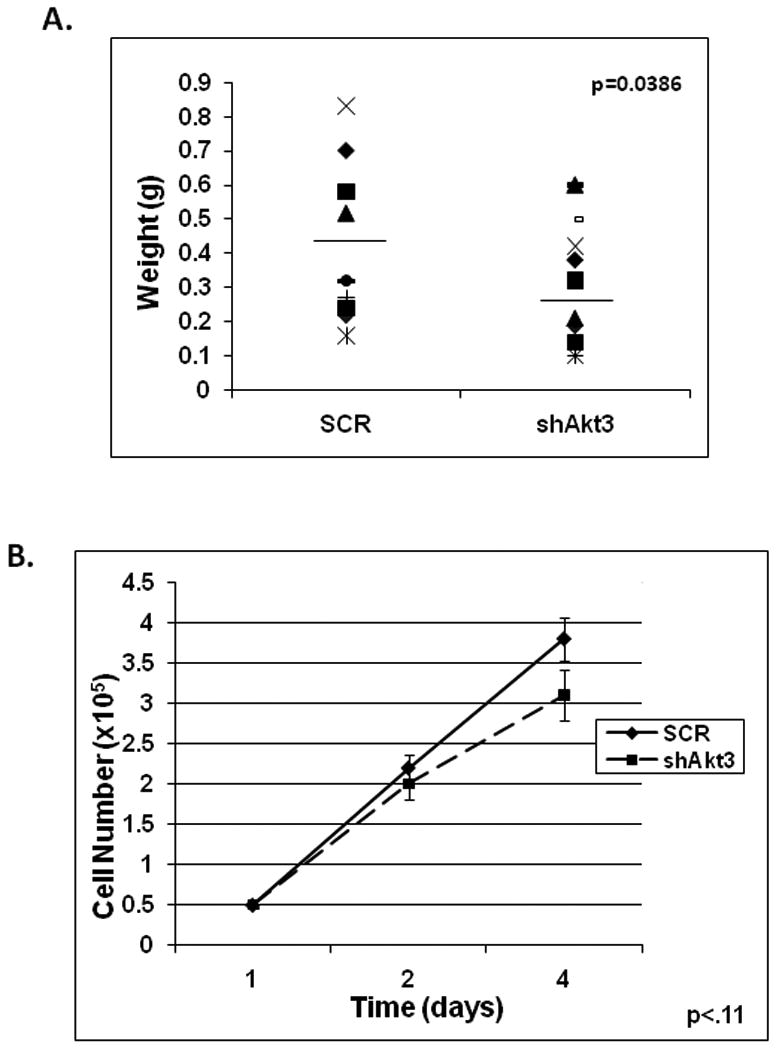
(A) ES2 cells were stably transduced with either a shRNA scrambled control (SCR) or Akt3 shRNA, injected subcutaneously into SCID mice and allowed to develop for 7 days. Tumors were dissected, fixed and weighed. A graph showing weight of 12 matched tumors are shown. The bar indicates the average weight of each tumor type. (B) Equal numbers of ES2 cells transduced with either a shRNA scrambled control (SCR) or Akt3 shRNA were plated and directly counted for the times indicated. The p value is indicated.
Akt3 controls VEGF expression and tumor vascularization
Tumors obtained above were sectioned and subjected to H&E staining. Figure 3A shows a comparison of H&E staining between tumors derived from scrambled control or Akt3 shRNA expressing ES2 cells. This staining shows a reduction in red blood cell infiltration (bright red staining) in tumors derived from ES2 cells expressing the shRNA directed against Akt3. Indeed, tumors derived from these cells appeared to have fewer vessels than the scrambled control tumors. Additionally, areas of early stage and late stage necrosis were observed in both tumor types. High levels of necrosis in the Akt3 shRNA expressing tumors could be due to a lack of vascular involvement. To test whether Akt3 silencing resulted in reductions in vessel density, tumor sections were stained using an antibody directed against α-smooth muscle actin. Figure 3B shows the results of these experiments. Tumors derived from ES2 cells expressing a scrambled control shRNA have a much higher vessel number per field than those tumor samples derived from ES2 cells expressing an Akt3 shRNA. Quantitation of tumor vasculature is shown in Figure 3C.
Fig. 3. Akt3 silencing in tumors results in smaller, less vascularized tumors.
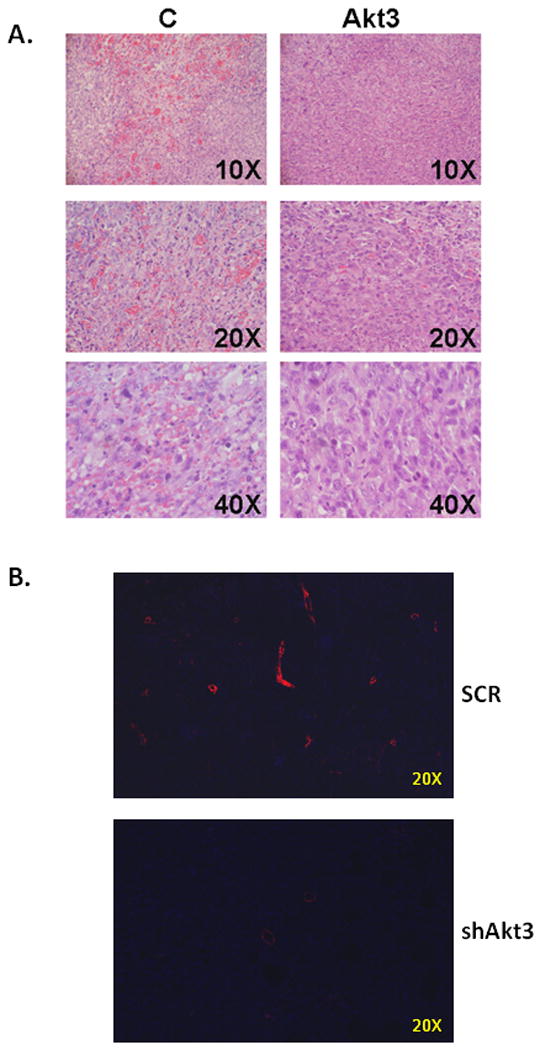
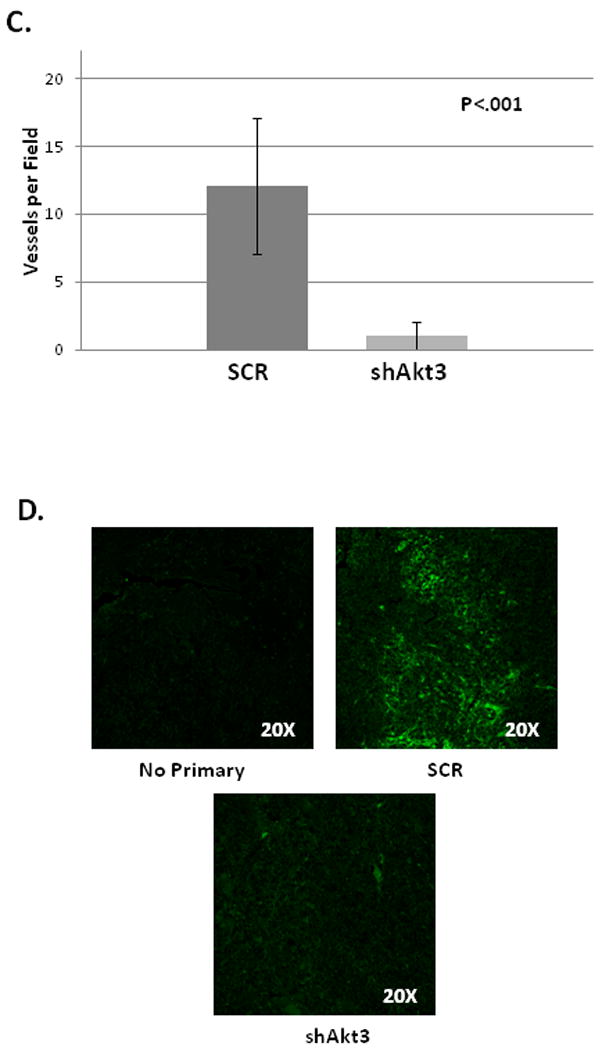
(A) H&E staining of paraffin sections within the tumors grown in SCID mice. Different magnifications are shown. (B) Fluorescent images of paraffin sections of tumors derived from cells either expressing scrambled (SCR) or Akt3 shRNA stained using an antibody against α-smooth muscle actin to visualize blood vessels. (C) Quantitation of number of vessels per field of scrambled control (SCR) and shAKT3 expressing tumors. Six fields per section of three independent tumor sections were counted. (D) Fluorescent images of paraffin sections of tumors derived from cells either expressing scrambled (SCR) or Akt3 shRNA stained using an antibody against VEGF. A no primary control is shown using scrambled control sections. Each fluorescent image was obtained using identical parameters.
Since VEGF is a primary inducer of an angiogenic phenotype, VEGF expression was assessed in the tumor samples using an antibody directed against VEGF. As shown in Figure 3D, in scramble control tumors VEGF staining in the extracellular matrix is clearly shown whereas tumors derived from cells expressing Akt3 shRNA show marked decrease in VEGF staining. Images are shown using identical parameters. Quantitation shows at least a 2-fold decrease in the expression of VEGF in Akt3 knockdown tumors in this model. Taken together our results suggest that Akt3 is required for the secretion VEGF thus promoting growth and vascularization of ovarian cancer cells.
Akt3 is required for VEGF secretion
To test whether Akt3 silencing resulted in an effect on VEGF expression in ES2 cells, VEGF expression was tested by RT-PCR and Western blot analysis of both total and secreted protein after 48 hours of shRNA treatment. Akt3 silencing does not markedly affect the expression of VEGF on the mRNA level (Fig. 4A and 4B). However, Akt3 silencing results in increased protein expression, as shown by Western blot analysis of total protein (Fig. 4C). This increased protein expression is correlated with a decrease in the secretion of VEGF, as shown by the Western blot of VEGF contained within conditioned media (Fig. 4C). As shown by ELISA, VEGF concentrations in conditioned media show a 3- to 4-fold reduction under conditions of Akt3 silencing (Fig. 4D). These results were confirmed in two additional ovarian cancer cell lines, SKOV3 and A2789 (data not shown) and suggest that Akt3 silencing may interfere with VEGF secretion resulting in accumulation within the cells.
Fig. 4. Silencing of Akt3 inhibits VEGF secretion.
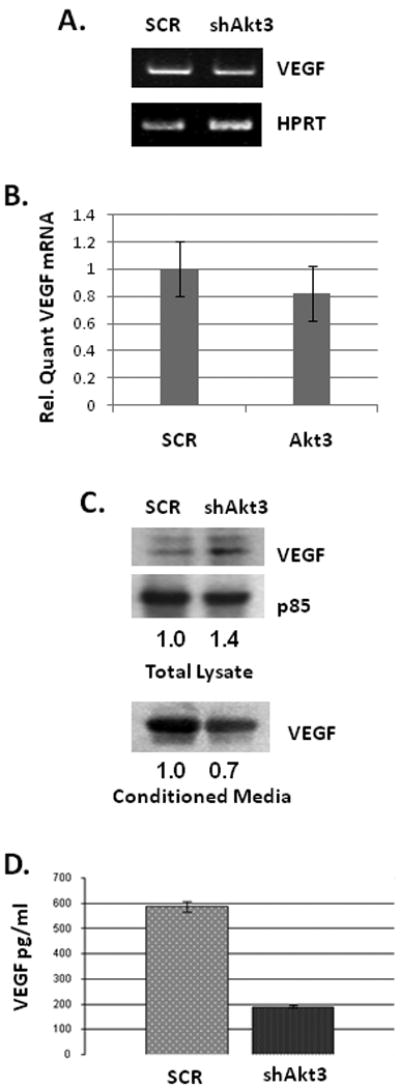
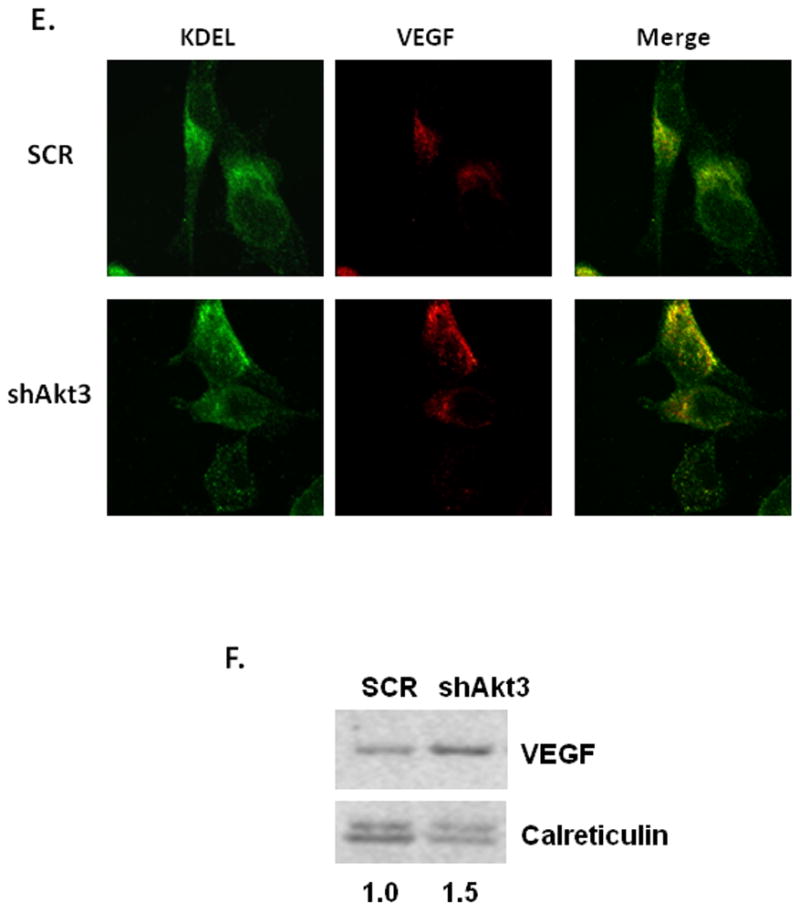
(A) PCR of total RNA isolated from ES2 cells treated with a shRNA scrambled control (SCR) or Akt3 shRNA (shAkt3) using primers directed against VEGF and HPRT as an internal control. (B) Quantitation of VEGF expression by real time PCR in ES2 cells as treated in A. (C) Western blot analysis of VEGF expression in ES2 cells treated as in A using either total lysate or conditioned media, from the same cells. The PI3K subunit p85 is used as a loading control and relative ratios of VEGF expression is shown. (D) Quantitation of VEGF within conditioned media of cells treated as above performed by ELISA. (E) Visualization of VEGF (red) and KDEL (green) by confocal analyses of ES2 cells treated with scrambled or Akt3 shRNA lentiviruses. Merged images are also shown. (F) Western blot analysis of an ER fraction derived from sucrose gradient centrifugation of either scrambled control (SCR) or Akt3 shRNA transduced cells were assessed for expression of VEGF and the ER marker, Calreticulin. Relative ratios of VEGF expression compared to Calreticulin are shown.
To test whether knockdown of Akt3 resulted in an accumulation of VEGF, ES2 cells were transduced with lentiviruses expressing shRNA directed against Akt3 or scrambled control for 48 hours and subjected to immunofluorescence using antibodies directed against VEGF and the endoplasmic reticulum (ER) marker KDEL. As shown by the confocal imaging in Figure 4E, Akt3 silencing results in an increased co-localization of VEGF and KDEL, indicating a potential accumulation of VEGF in the ER. To confirm the accumulation of VEGF in the ER, cellular fractionation was performed using sucrose gradient centrifugation. As shown by the Western blot in Figure 4F, Akt3 silencing results in a VEGF accumulation in the ER fraction as demonstrated using the ER marker Calreticulin.
To insure that the reduction in VEGF secretion was not due to off-target effects of the shRNA, these analyses were repeated using transient transfection of an RNAi directed against Akt3 that is a different sequence than the shRNA lentiviruses. Quantitation of the resultant Akt3 knock down using this RNAi is shown in Figure 5A. This RNAi similarly reduces the secretion of VEGF (Fig. 5B). To show specificity of this pathway to Akt3, Akt1 was similarly silenced using an RNAi directly against Akt1 in ES2 cells. As shown in Figure 5C, knockdown of Akt1, does not affect the expression of VEGF nor does it down regulate VEGF secretion into conditioned media. These findings suggest that VEGF secretion is specifically regulated by Akt3, not by Akt1.
Fig. 5. Akt1 is not required for VEGF secretion.
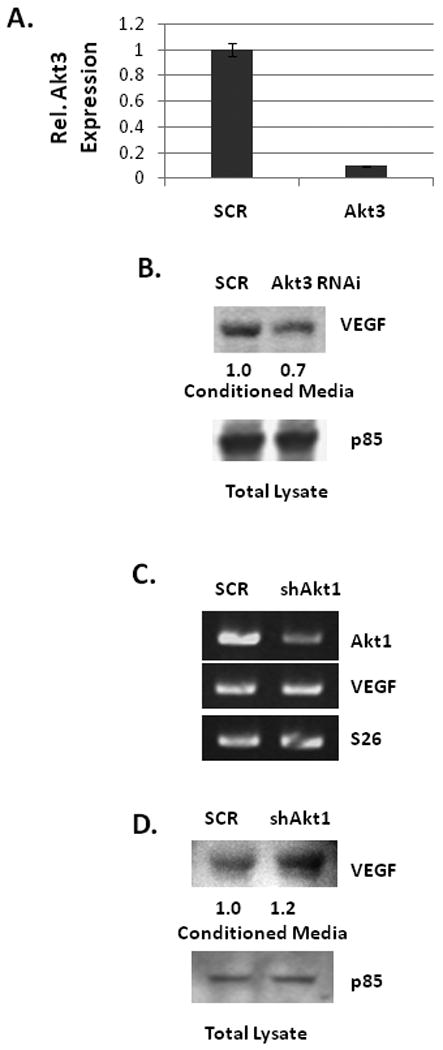
(A) Real time PCR analysis of total RNA isolated from ES2 cells transiently transfected with an Akt3 RNAi unrelated to the Akt3 shRNA. (B) Western blot analysis of VEGF in conditioned media from cells similarly transfected. Relative ratios of VEGF compared to the internal control are shown. (C) PCR analysis of RNA isolated from ES2 cells treated with a shRNA scrambled control (SCR) or Akt1 shRNA lentivirus using primers directed against Akt1, VEGF and S26 as an internal control. (D) Western blot analysis of VEGF expression in conditioned media from ES2 cells treated as in B. Relative ratios of VEGF compared to the internal control are shown.
Akt3 is required for the expression of the RCAS1 ovarian tumor cell marker
To begin to assess potential targets regulated by Akt3, ES2 cells treated either with Akt3 shRNA or a scrambled control shRNA were assessed for changes in gene expression using a nylon based gene array that contains 600 genes found to be differentially expressed between wild type MCF7 breast cancer cells and MCF7 cells expressing high levels of Her2/neu. Only a small subset of genes was Akt3 dependent (Table 1, suppl.), however, RCAS1 (Receptor binding Cancer Antigen expressed on SiSo cells), an ovarian tumor cell marker whose expression correlates with VEGF expression, was markedly reduced. Confirmation of the gene array is shown by real time PCR of RCAS1 in the presence of Akt3 shRNA as compared to the levels expressed in a scrambled control shRNA (Fig. 6A). This reduction in mRNA expression is also correlated with a decreased RCAS1 protein expression by both shAkt3 and Akt3 RNAi (Fig. 6B) suggesting that Akt3 is required for the expression of RCAS1.
Fig. 6. RCAS1 is localized to the ER and is required for VEGF secretion.
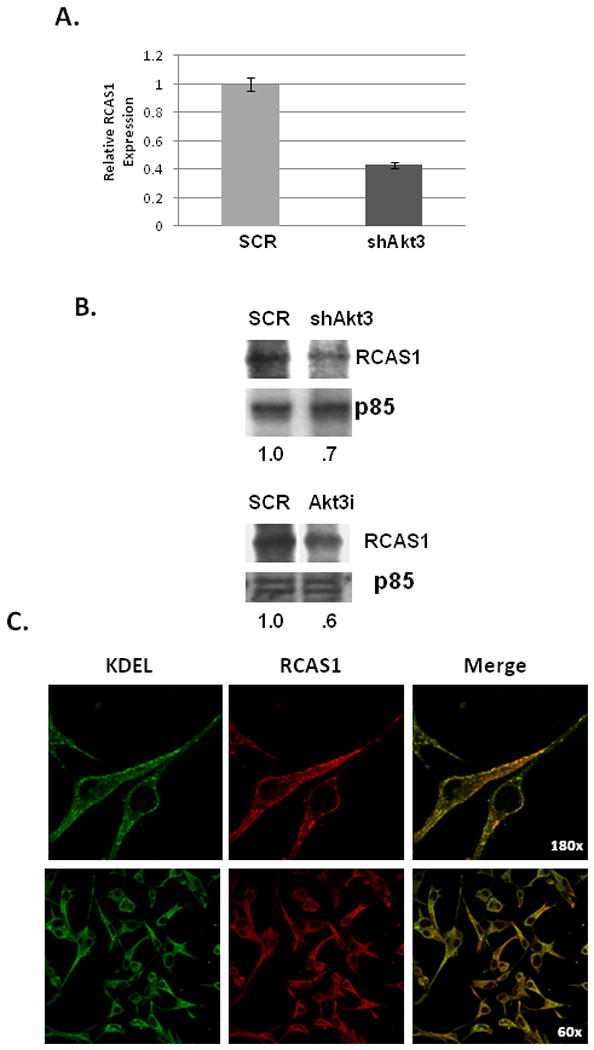
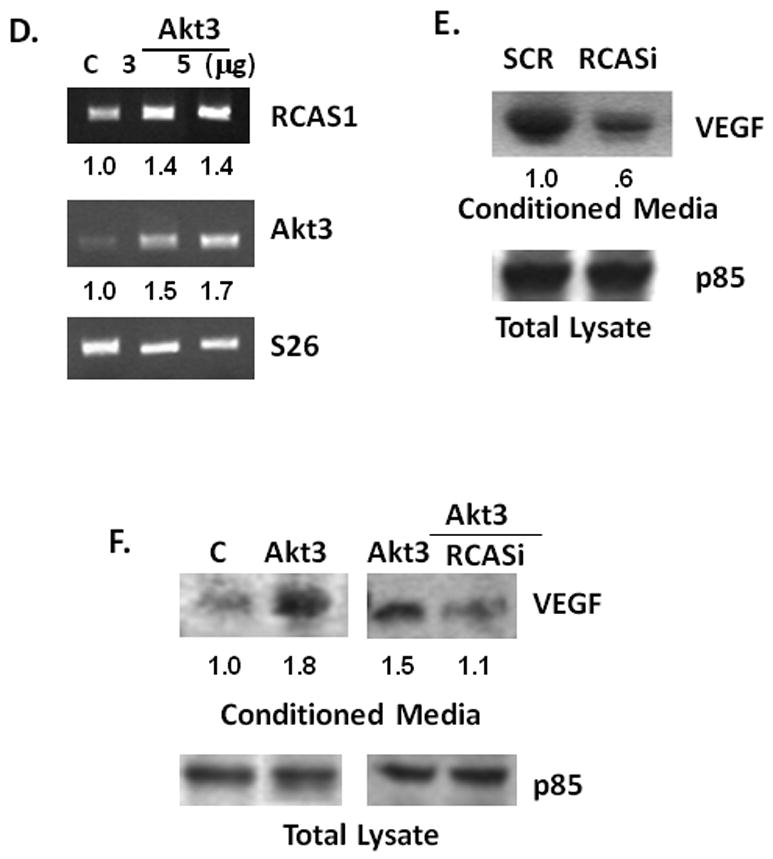
(A) Real time PCR analysis of RCAS1 expression in total RNA isolated from ES2 cells transduced with an Akt3 shRNA or scrambled control. Expression is shown relative to S26 as an internal control. (B) Western blot analysis of RCAS1 expression in cells treated either with shAkt3 (top) or with Akt3 RNAi (bottom). Relative ratios are shown. (C) Fluorescent images of ES2 cells stained using antibodies against KDEL (green) and RCAS1 (red) and the resultant merged images. (D) RTPCR of RCAS1 and Akt3 expression in cells transfected with either an empty vector control or two different amounts of an Akt3 expression vector. Relative ratios of both RCAS1 and Akt3 are shown. (D) Western blot analysis of VEGF from conditioned media derived from cells ES2 cells transfected with an RNAi directed against RCAS1 or a scrambled control. p85 is shown as a loading control and relative ratios are shown. (E) Western blot analysis of VEGF in conditioned media from ES2 cells transfected with an Akt3 expression vector with or without co-transfection of an RCAS1 RNAi. p85 is shown as an internal control and relative ratios are shown.
Inhibition of the Akt3/RCAS1 pathway results in VEGF accumulation in the endoplasmic reticulum
RCAS1 expression is associated with advanced disease of a number of different cancer types, including ovarian cancer, and is correlated with increased VEGF expression and tumor vasculature in human tumor samples 25. The subcellular location of RCAS1 seems to vary depending on tumor type and particular tumor stage but has been shown, at least in MCF7 breast cancer cells, to localize to the Golgi 26. Since we find that VEGF accumulates in the ER we asked whether RCAS1 was also located in this cellular compartment. ES2 cells were subjected to immunofluorescence using antibodies against RCAS1 and KDEL. As shown in Figure 6C, fluorescent imaging suggests that RCAS1 is also localized to the ER in this ovarian cell line.
These findings suggested a linear pathway whereby Akt3 leads to the expression of RCAS1 and to VEGF secretion. To test whether over-expression of Akt3 would lead to increased RCAS1 expression, ES2 cells were transfected with a construct driving Akt3 expression. Under conditions of Akt3 over-expression, RCAS1 levels are also increased (Fig. 6D). To confirm a role of RCAS1 in the regulation of VEGF secretion similar to that observed under conditions of Akt3 silencing, ES2 cells were transiently transfected either with scrambled control RNAi or with RNAi directed against RCAS1. As shown in Figure 6E knockdown of RCAS1 expression results in a decrease in VEGF in conditioned media. Indeed, over-expression of Akt3 also results in an increased secretion of VEGF which is blocked by co-transfection of RCAS1 RNAi (Fig. 6F). These results suggest that Akt3 controls the expression of RCAS1 with in turn affects growth factor secretion.
Discussion
Here we report a novel function for Akt3 in ovarian cancer: control of growth factor secretion. Blockade of Akt3, not Akt1, results in a marked reduction in the expression of RCAS1 (EBAG9), a tumor cell marker 27-29 whose expression tightly correlates with VEGF expression in ovarian and uterine tumor samples 25, 30. In line with this observation, we show that Akt3 knockdown results in reduced levels of VEGF in conditioned media, accumulation of VEGF in the endoplasmic reticulum and increased VEGF protein levels in total cell lysates. Since there are little, if any changes in VEGF mRNA in response to Akt3 knockdown, these findings suggest a role for Akt3 in the secretion of VEGF. This activity is apparently not completely specific to VEGF since connective tissue growth factor (CTGF) another highly angiogenic growth factor, is also reduced in conditioned media (data not shown). Importantly, this function is not compensated by other Akt family members as Akt1 knockdown does not have a similar effect.
Using a xenograft SCID mouse model, we show that Akt3 silencing results in a statistically significant reduction in tumor growth. This can be attributed, at least in part, to a reduction in cellular proliferation (Fig. 2). Akt3 silencing can lead to a slowing of the G2 to M transition within the cell cycle in some ovarian cancer cell lines 9, although we do not see a similar effect in ES2 cells. Instead, the reduction in tumor mass is accompanied by a marked down-regulation of VEGF secretion.
In this in vivo situation, inhibition of growth factor secretion could be affecting autocrine signals. For example, many ovarian cancer cell lines express receptors for VEGF and are thought to be responsive to this growth factor in an autocrine fashion 6. A similar scenario could be envisioned for other Akt3-dependent secreted factors such as CTGF. These findings suggest that blockade of Akt3 may result not only in an effect on neoangiogenesis but also on tumor cell growth per se.
The tumor antigen RCAS1 also plays a role in the Akt3 secretory pathway. Its expression levels are reduced by Akt3 silencing while inhibition of RCAS1 expression using RNAi results in decreased VEGF secretion. Indeed, down regulation of RCAS1 blocks an Akt3-dependent increase in VEGF secretion. We have been unsuccessful in the rescue of VEGF secretion by RCAS1 over-expression. Over-expression of RCAS1 results in a marked reduction in VEGF secretion that is only slightly increased in the absence of Akt3. Taken together, these findings suggest that perturbations in physiological levels of RCAS1 may disturb normal cellular secretion and that RCAS1 is necessary but not sufficient for VEGF secretion.
Exactly how RCAS1 influences cellular secretion is unclear. Its expression is elevated in some uterine and ovarian cancers and its level of expression correlated with poor prognosis. Originally RCAS1 was defined as a tumor cell surface antigen as recognized by the 22-1-1 monoclonal antibody derived against SiSo cells 31. There is recent data, however, that suggests that RCAS1 is not the tumor surface antigen itself but is a resident Golgi protein that promotes the secretion of the TN glycan antigen found on the surface of tumor cells 32. The 22-1-1 monoclonal antibody therefore recognizes the TN glycan antigen and not RCAS1 26. Indeed, RCAS1 can associate with certain SNARE complexes which reside in secretory vesicles and can act to modulate cellular secretion 33. We show RCAS1 is also localized to the ER; interestingly its subcellular localization seems to vary depending on tumor stage and cell type. Our studies are consistent with a role for RCAS1 in the Akt3-dependent regulation of VEGF secretion. The exact mechanism by with Akt3 regulates RCAS1 is presently under investigation.
It is interesting that the Akt3-dependent mitochondrial phenotype observed in endothelial cells is not similarly recapitulated in the carcinoma cell lines. Although our initial gene array analyses blocking the expression of Akt3 had evidence for small changes in the expression (<2-fold) of some nuclear encoded mitochondrial genes, overt changes in mitochondrial function or in mitochondrial DNA copy number was not evident in carcinoma cells. The lack of Akt3 in these cells could be compensated by other family members expressed in epithelial cells such as Akt2. Akt2 expression is not detected in primary endothelial cells 34. Whether blockade of Akt2 and Akt3 simultaneously will allow for detectable reductions in mitochondrial function will have to be determined. However, the lack of an Akt3 effect on mitochondrial function in the epithelial cell lines could also be due to high mutation rates of mitochondrial DNA in tumor cells or due to changes in glycolytic capacities (Warburg effect) also known to occur during tumorigenesis 35-37.
In summary, the findings presented above show an important role for Akt3 in the ovarian tumorigenesis; via the regulation of growth factor secretion. Since Akt3 is pivotal for mitochondrial function and endothelial cell energetics 23, it is interesting to speculate that blockade of Akt3 in an in vivo model may also result in a reduction in the activation of endothelial cells toward an angiogenic phenotype. Inhibition of Akt3 then could have dual targets, both tumor cells and their secretion of angiogenic factors and the ability to launch an angiogenic response. Taken together, these findings suggest that Akt3 may present as an important target for therapeutic intervention for the treatment of ovarian cancer.
Acknowledgments
This work was supported in part by R01HL084565-02 to RMH and RO1CA109860 to TH. We wish to thank the Hollings Cancer Center Biostatistics Shared Resource for performing statistical analyses and Drs. Bryan Toole and Vincent Dammai for their helpful suggestions.
References
- 1.Bamberger ES, Perrett CW. Angiogenesis in epithelian ovarian cancer. Mol Pathol. 2002;55:348–59. doi: 10.1136/mp.55.6.348. [DOI] [PMC free article] [PubMed] [Google Scholar]
- 2.Kumaran GC, Jayson GC, Clamp AR. Antiangiogenic drugs in ovarian cancer. British journal of cancer. 2009;100:1–7. doi: 10.1038/sj.bjc.6604767. [DOI] [PMC free article] [PubMed] [Google Scholar]
- 3.Berra E, Milanini J, Richard DE, Le Gall M, Vinals F, Gothie E, Roux D, Pages G, Pouyssegur J. Signaling angiogenesis via p42/p44 MAP kinase and hypoxia. Biochem Pharmacol. 2000;60:1171–8. doi: 10.1016/s0006-2952(00)00423-8. [DOI] [PubMed] [Google Scholar]
- 4.Pages G, Milanini J, Richard DE, Berra E, Gothie E, Vinals F, Pouyssegur J. Signaling angiogenesis via p42/p44 MAP kinase cascade. Ann N Y Acad Sci. 2000;902:187–200. doi: 10.1111/j.1749-6632.2000.tb06313.x. [DOI] [PubMed] [Google Scholar]
- 5.Semenza GL, Agani F, Feldser D, Iyer N, Kotch L, Laughner E, Yu A. Hypoxia, HIF-1, and the pathophysiology of common human diseases. Advances in experimental medicine and biology. 2000;475:123–30. doi: 10.1007/0-306-46825-5_12. [DOI] [PubMed] [Google Scholar]
- 6.Chen H, Ye D, Xie X, Chen B, Lu W. VEGF, VEGFRs expressions and activated STATs in ovarian epithelial carcinoma. Gynecologic oncology. 2004;94:630–5. doi: 10.1016/j.ygyno.2004.05.056. [DOI] [PubMed] [Google Scholar]
- 7.Han ES, Lin P, Wakabayashi M. Current Status on Biologic Therapies in the Treatment of Epithelial Ovarian Cancer. Current treatment options in oncology. 2009 doi: 10.1007/s11864-009-0100-x. [DOI] [PubMed] [Google Scholar]
- 8.Shayesteh L, Lu Y, Kuo WL, Baldocchi R, Godfrey T, Collins C, Pinkel D, Powell B, Mills GB, Gray JW. PIK3CA is implicated as an oncogene in ovarian cancer. Nat Genet. 1999;21:99–102. doi: 10.1038/5042. [DOI] [PubMed] [Google Scholar]
- 9.Cristiano BE, Chan JC, Hannan KM, Lundie NA, Marmy-Conus NJ, Campbell IG, Phillips WA, Robbie M, Hannan RD, Pearson RB. A specific role for AKT3 in the genesis of ovarian cancer through modulation of G(2)-M phase transition. Cancer Res. 2006;66:11718–25. doi: 10.1158/0008-5472.CAN-06-1968. [DOI] [PubMed] [Google Scholar]
- 10.Marte BM, Downward J. PKB/Akt: connecting phosphoinositide 3-kinase to cell survival and beyond. Trends Biochem Sci. 1997;22:355–8. doi: 10.1016/s0968-0004(97)01097-9. [DOI] [PubMed] [Google Scholar]
- 11.Bos JL. A target for phosphoinositide 3-kinase: Akt/PKB. Trends Biochem Sci. 1995;20:441–2. doi: 10.1016/s0968-0004(00)89097-0. [DOI] [PubMed] [Google Scholar]
- 12.Maroulakou IG, Oemler W, Naber SP, Tsichlis PN. Akt1 ablation inhibits, whereas Akt2 ablation accelerates, the development of mammary adenocarcinomas in mouse mammary tumor virus (MMTV)-ErbB2/neu and MMTV-polyoma middle T transgenic mice. Cancer Res. 2007;67:167–77. doi: 10.1158/0008-5472.CAN-06-3782. [DOI] [PubMed] [Google Scholar]
- 13.Altomare DA, Tanno S, De Rienzo A, Klein-Szanto AJ, Tanno S, Skele KL, Hoffman JP, Testa JR. Frequent activation of AKT2 kinase in human pancreatic carcinomas. Journal of cellular biochemistry. 2002;87:470–6. doi: 10.1002/jcb.10287. [DOI] [PubMed] [Google Scholar]
- 14.Cheng JQ, Ruggeri B, Klein WM, Sonoda G, Altomare DA, Watson DK, Testa JR. Amplification of AKT2 in human pancreatic cells and inhibition of AKT2 expression and tumorigenicity by antisense RNA. Proceedings of the National Academy of Sciences of the United States of America. 1996;93:3636–41. doi: 10.1073/pnas.93.8.3636. [DOI] [PMC free article] [PubMed] [Google Scholar]
- 15.Rychahou PG, Kang J, Gulhati P, Doan HQ, Chen LA, Xiao SY, Chung DH, Evers BM. Akt2 overexpression plays a critical role in the establishment of colorectal cancer metastasis. Proc Natl Acad Sci U S A. 2008;105:20315–20. doi: 10.1073/pnas.0810715105. [DOI] [PMC free article] [PubMed] [Google Scholar]
- 16.Davies MA, Stemke-Hale K, Tellez C, Calderone TL, Deng W, Prieto VG, Lazar AJ, Gershenwald JE, Mills GB. A novel AKT3 mutation in melanoma tumours and cell lines. British journal of cancer. 2008;99:1265–8. doi: 10.1038/sj.bjc.6604637. [DOI] [PMC free article] [PubMed] [Google Scholar]
- 17.Sandau KB, Faus HG, Brune B. Induction of hypoxia-inducible-factor 1 by nitric oxide is mediated via the PI 3K pathway. Biochem Biophys Res Commun. 2000;278:263–7. doi: 10.1006/bbrc.2000.3789. [DOI] [PubMed] [Google Scholar]
- 18.Mazure NM, Chen EY, Laderoute KR, Giaccia AJ. Induction of vascular endothelial growth factor by hypoxia is modulated by a phosphatidylinositol 3-kinase/Akt signaling pathway in Ha-ras-transformed cells through a hypoxia inducible factor-1 transcriptional element. Blood. 1997;90:3322–31. [PubMed] [Google Scholar]
- 19.Dimmeler S, Fleming I, Fisslthaler B, Hermann C, Busse R, Zeiher AM. Activation of nitric oxide synthase in endothelial cells by Akt-dependent phosphorylation. Nature. 1999;399:601–5. doi: 10.1038/21224. [DOI] [PubMed] [Google Scholar]
- 20.Papapetropoulos A, Garcia-Cardena G, Madri JA, Sessa WC. Nitric oxide production contributes to the angiogenic properties of vascular endothelial growth factor in human endothelial cells. J Clin Invest. 1997;100:3131–9. doi: 10.1172/JCI119868. [DOI] [PMC free article] [PubMed] [Google Scholar]
- 21.Easton RM, Cho H, Roovers K, Shineman DW, Mizrahi M, Forman MS, Lee VM, Szabolcs M, de Jong R, Oltersdorf T, Ludwig T, Efstratiadis A, et al. Role for Akt3/protein kinase Bgamma in attainment of normal brain size. Mol Cell Biol. 2005;25:1869–78. doi: 10.1128/MCB.25.5.1869-1878.2005. [DOI] [PMC free article] [PubMed] [Google Scholar]
- 22.Tschopp O, Yang ZZ, Brodbeck D, Dummler BA, Hemmings-Mieszczak M, Watanabe T, Michaelis T, Frahm J, Hemmings BA. Essential role of protein kinase B gamma (PKB gamma/Akt3) in postnatal brain development but not in glucose homeostasis. Development. 2005;132:2943–54. doi: 10.1242/dev.01864. [DOI] [PubMed] [Google Scholar]
- 23.Wright GL, Maroulakou IG, Eldridge J, Liby TL, Sridharan V, Tsichlis PN, Muise-Helmericks RC. VEGF stimulation of mitochondrial biogenesis: requirement of AKT3 kinase. Faseb J. 2008 doi: 10.1096/fj.08-106468. [DOI] [PMC free article] [PubMed] [Google Scholar]
- 24.Bonifacino JS. Current protocols in cell biologyed. New York: John Wiley; 2001. [Google Scholar]
- 25.Sonoda K, Miyamoto S, Yamazaki A, Kobayashi H, Nakashima M, Mekada E, Wake N. Biologic significance of receptor-binding cancer antigen expressed on SiSo cells (RCAS1) as a pivotal regulator of tumor growth through angiogenesis in human uterine cancer. Cancer. 2007;110:1979–90. doi: 10.1002/cncr.23015. [DOI] [PubMed] [Google Scholar]
- 26.Reimer TA, Anagnostopoulos I, Erdmann B, Lehmann I, Stein H, Daniel P, Dorken B, Rehm A. Reevaluation of the 22-1-1 antibody and its putative antigen, EBAG9/RCAS1, as a tumor marker. BMC cancer. 2005;5:47. doi: 10.1186/1471-2407-5-47. [DOI] [PMC free article] [PubMed] [Google Scholar]
- 27.Chatterjee M, Mohapatra S, Ionan A, Bawa G, Ali-Fehmi R, Wang X, Nowak J, Ye B, Nahhas FA, Lu K, Witkin SS, Fishman D, et al. Diagnostic markers of ovarian cancer by high-throughput antigen cloning and detection on arrays. Cancer Res. 2006;66:1181–90. doi: 10.1158/0008-5472.CAN-04-2962. [DOI] [PMC free article] [PubMed] [Google Scholar]
- 28.Rousseau J, Tetu B, Caron D, Malenfant P, Cattaruzzi P, Audette M, Doillon C, Tremblay JP, Guerette B. RCAS1 is associated with ductal breast cancer progression. Biochem Biophys Res Commun. 2002;293:1544–9. doi: 10.1016/S0006-291X(02)00401-1. [DOI] [PubMed] [Google Scholar]
- 29.Noguchi K, Enjoji M, Nakamuta M, Nakashima M, Nishi H, Choi I, Taguchi K, Kotoh K, Shimada M, Sugimachi K, Tsuneyoshi M, Nawata H, et al. Expression of a tumor-associated antigen RCAS1 in hepatocellular carcinoma. Cancer Lett. 2001;168:197–202. doi: 10.1016/s0304-3835(01)00541-9. [DOI] [PubMed] [Google Scholar]
- 30.Akahira JI, Aoki M, Suzuki T, Moriya T, Niikura H, Ito K, Inoue S, Okamura K, Sasano H, Yaegashi N. Expression of EBAG9/RCAS1 is associated with advanced disease in human epithelial ovarian cancer. British journal of cancer. 2004;90:2197–202. doi: 10.1038/sj.bjc.6601832. [DOI] [PMC free article] [PubMed] [Google Scholar]
- 31.Nakashima M, Sonoda K, Watanabe T. Inhibition of cell growth and induction of apoptotic cell death by the human tumor-associated antigen RCAS1. Nat Med. 1999;5:938–42. doi: 10.1038/11383. [DOI] [PubMed] [Google Scholar]
- 32.Engelsberg A, Hermosilla R, Karsten U, Schulein R, Dorken B, Rehm A. The Golgi protein RCAS1 controls cell surface expression of tumor-associated O-linked glycan antigens. J Biol Chem. 2003;278:22998–3007. doi: 10.1074/jbc.M301361200. [DOI] [PubMed] [Google Scholar]
- 33.Ruder C, Reimer T, Delgado-Martinez I, Hermosilla R, Engelsberg A, Nehring R, Dorken B, Rehm A. EBAG9 adds a new layer of control on large dense-core vesicle exocytosis via interaction with Snapin. Mol Biol Cell. 2005;16:1245–57. doi: 10.1091/mbc.E04-09-0817. [DOI] [PMC free article] [PubMed] [Google Scholar]
- 34.Fieber CB, Eldridge J, Taha TA, Obeid LM, Muise-Helmericks RC. Modulation of total Akt kinase by increased expression of a single isoform: Requirement of the sphingosine-1-phosphate receptor, Edg3/S1P3, for the VEGF-dependent expression of Akt3 in primary endothelial cells. Exp Cell Res. 2006;312:1164–73. doi: 10.1016/j.yexcr.2006.01.022. [DOI] [PubMed] [Google Scholar]
- 35.Lee HC, Wei YH. Mitochondrial DNA instability and metabolic shift in human cancers. International journal of molecular sciences. 2009;10:674–701. doi: 10.3390/ijms10020674. [DOI] [PMC free article] [PubMed] [Google Scholar]
- 36.Nadege B, Patrick L, Rodrigue R. Mitochondria: from bioenergetics to the metabolic regulation of carcinogenesis. Front Biosci. 2009;14:4015–34. doi: 10.2741/3509. [DOI] [PubMed] [Google Scholar]
- 37.Santos C, Martinez M, Lima M, Hao YJ, Simoes N, Montiel R. Mitochondrial DNA mutations in cancer: a review. Current topics in medicinal chemistry. 2008;8:1351–66. doi: 10.2174/156802608786141151. [DOI] [PubMed] [Google Scholar]


