Abstract
Molecular dynamics simulations were carried out on a system of eight independent caffeine molecules in a periodic box of water at 300 K, representing a solution near the solubility limit for caffeine at room temperature, using a newly-developed CHARMM-type force field for caffeine in water. Simulations were also conducted for single caffeine molecules in water using two different water models (TIP3P and TIP4P). Water was found to structure in a complex fashion around the planar caffeine molecules, which was not sensitive to the water model used. As expected, extensive aggregation of the caffeine molecules was observed, with the molecules stacking their flat faces against one another like coins, with their methylene groups staggered to avoid steric clashes. A dynamic equilibrum was observed between large n-mers, including stacks with all eight solute molecules, and smaller clusters, with the calculated osmotic coefficient being in acceptable agreement with the experimental value. The insensitivity of the results to water model and the congruence with experimental thermodynamic data suggest that the observed stacking interactions are a realistic representation of the actual association mechanism in aqueous caffeine solutions.
Keywords: caffeine, molecular dynamics simulations, aqueous solution, water hydration, self-association
Introduction
As a key component of coffee, tea, and so-called energy drinks, the mild stimulant caffeine has long been a source of excitement, both in its use and in the study of its solution properties. The metabolic fate and physiological effects1 of caffeine, both beneficial and potentially harmful, continue to attract considerable attention.2-4 Caffeine, shown in Figure 1, is synthesized by successive action of the enzyme caffeine synthetase from 7-methyl xanthine, with theobromine as the doubly-methylated intermediate.5 It is a prototypical example of a planar, heteroatomic bicyclic, aromatic ring compound which, although somewhat polar, exhibits limited aqueous solubility. It carries a permanent electric dipole of ∼3.6 - 3.7 D.6 The flat faces of caffeine are sufficiently weakly hydrated such that it will easily separate out of water into non-polar liquids. In this sense the molecule could be considered hydrophobic, and its high O/W partition coefficient is exploited as a principal means of removal of caffeine from coffee and tea, employing its preferential partitioning into non-polar solvents like dichloromethane.7 In an aqueous environment, caffeine is known to undergo considerable self-association, as found experimentally by the concentration dependence of its osmotic coefficient, measured in parallel with heats of dilution and density data.8 No matter what model is used to fit the experimental results, the analysis of the calorimetric data always yields an enthalpy contribution that could solely account for the association, without the entropy change typical of entropically-driven hydrophobic interactions.8,9
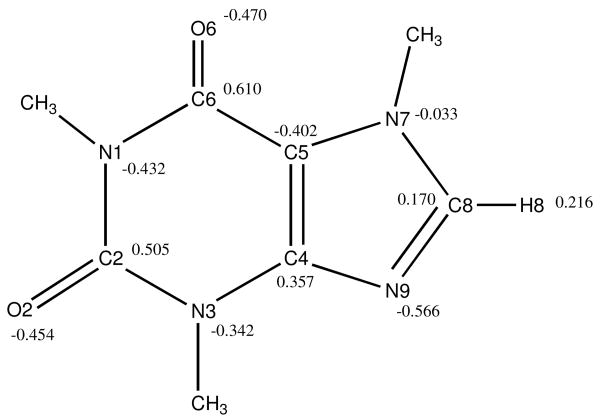
Figure 1.
The covalent structure and atomic numbering of caffeine (1,3,7-trimethyl xanthine). The atomic partial charges for all atoms except those of the methyl groups (see Table 1) are also indicated.
While the overall structure of caffeine can be characterized as that of two fused, planar rings, because of its methyl groups, the molecule is not completely planar. With three of its four nitrogen atoms methylated, caffeine can only serve as a hydrogen bond acceptor, not as a conventional hydrogen bond donor (Figure 1). The interaction of water molecules with caffeine has been thought to be largely dominated by the two oxygen atoms and the nitrogen atom at position 9, because of the full methylation of the secondary amino groups, and because in the monohydrate crystal structure,10 the incorporated water molecule is only hydrogen bonded to N9 (Figure 2). However, it has been noted that protons in nucleic acid purines with covalent environments similar to the caffeine H8 atom can make interactions with hydrogen bond acceptors that in fact resemble hydrogen bonding.11
Figure 2.
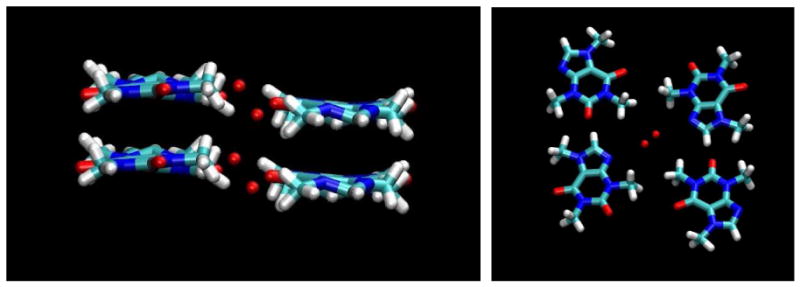
Two views of the monohydrate crystal structure of caffeine, illustrating the position of the water molecule (shown as red spheres on the oxygen atom), hydrogen bonded to the N9 atom of the caffeine molecule and making a second bond to another symmetry-related water molecule.
Molecular modeling and NMR studies suggest that caffeine dimerization in solution may occur through stacking, with many possible distinct caffeine-caffeine orientations.12 Previous work by the same authors13 also pointed out, using FT-IR studies, the tendency of caffeine to associate to form dimers and higher order clusters, but, however, could not quantitate the average size of the aggregates, generically indicated as “polymers”. In a recent set of MD simulations of caffeine in water and in a concentrated urea solution, the simulations began with the caffeine molecules placed in a long stack, which subsequently dissociated in both solutions into much smaller aggregates, but the geometries and size distributions of these aggregates were not reported, so that the results cannot be compared with osmotic data.14 Relevant changes in hydration properties have been claimed in earlier Monte Carlo simulations of stacked caffeine dimers in vacuo and in water compared to the results obtained with the monomeric isolated form.12,15 The effects of several co-solutes on the association properties of caffeine have also been studied in some detail, such as in the recent report of the change of the self-association constant in some salts of the Hofmeister series, increasing from NaClO4 to NaSCN to Na2SO4 to NaCl.16 These data add to the previously reported effects on the solubility of caffeine in the presence of sucrose,17 alcohol,18 urea,14,19 guanidinium chloride,19 and KCl,19 with substantial agreement on the change in the solvent properties affecting the homotactic caffeine aggregation.
While only limited experimental information is available about the structure of caffeine aggregates in solution, it is possible to gain further insight into caffeine interactions from its crystal structures, which are well-known, and also provide some indication of how it behaves in the condensed phase. The best known crystalline form of caffeine is the mono-hydrated crystalline polymorph, with a characteristic needle-like shape,10,20-22 in which the caffeine molecules are indeed stacked like coins (Figure 2), with the water molecules hydrogen bonding to the N9 atoms of adjacent caffeine molecules. A decidedly hydrogen bond-like interaction between the H8 and O2 atoms of adjacent molecules in the same crystal plane can also be seen in Figure 2. A high-temperature, polymorphic, anhydrous crystalline powder form is known which, when cured at temperatures below 87°C transforms into a low temperature polymorph with a trigonal crystal structure,10,20 and this polymorph reverts to the crystal form at 141°C, with an enthalpy change, ΔHtr, of 3.9 kJ/mol. Recently, it has been found that the high temperature crystalline phase is in a state of dynamic orientational disorder of the stacked rings, referred to by Descamps et al. as a “plastic or glassy crystal”.23 The original observation that a pseudo-hexagonal symmetry originates from orientational disorder in the molecular stacking24 has been confirmed by more recent findings.22,23,25 Thus, in the absence of the water molecules bridging the N9 atoms of adjacent rings, which keep the rings in register, caffeine molecules in the crystal are still stacked, but their orientation can be easily scrambled with little energy cost. This disordered solid phase strongly suggests that stacked dimers in solution might similarly exhibit multiple orientations with respect to one another, as suggested by the solution NMR data.12
In the absence of more direct experimental information about the structure of caffeine solutions, MD simulations can be of use in characterizing their behavior. Furthermore, simulation studies of caffeine offer the possibility of testing various models for aqueous solvation using a biological system for which reliable experimental data are available. Recent theories of the hydration of hydrophobic surfaces have found that extended planar surfaces should hydrate differently than smaller hydrophobic species.26-29 For solutes with a small spatial extent and a high curvature, such as methane or methylene, water molecules in the first “hydration shell” can straddle the solute to make hydrogen bonds to other water molecules, with neither of its protons or lone pairs directly pointing at the solute, which would involve the loss of a hydrogen bond.30 The cost of this structuring is entropic, since the rotational freedom of the water molecules is restricted. As a result, such species are driven to aggregate in aqueous solutions, which liberates water molecules to regain their rotational freedom. The calorimetric signature of this type of hydrophobic aggregation at room temperature is that it is entropy-driven, with a heat capacity change that is negative, since the initial solvation of such hydrophobic species is accompanied by an increase in the heat capacity. This hydration is considered a wetting interaction, since there is a maximum in the radial distribution function for the water molecule oxygen atoms from the central carbon atom of the hydrophobic group at the van der Waals contact distance around 3.4 Å (in a truly wetting interaction involving hydrogen bonding, this distance would be even less, around 2.8 Å). However, as the spatial dimensions of hydrophobic species grow larger, it becomes impossible for water molecules to straddle the hydrophobic surface and still make hydrogen bonds to other water molecules off to its sides.29 Under these conditions, the water molecules point one hydrogen atom or lone pair directly at the non-hydrogen-bonding surface, since the resulting loss of one hydrogen bond is nevertheless energetically better than the loss of the three hydrogen bonds that would result if it adopted the orientation of waters adjacent to a methane molecule.28,31,32 The aggregation of such extended surfaces in aqueous solution would then be enthalpically-driven, since the pairing of two such surfaces would allow the liberated water molecules to regain their lost hydrogen bonds. Orientational structuring of this type has been observed in simulation studies of extended featureless surfaces as well as of benzene.29,31,33,34 Chandler has demonstrated that there is a gradual transition from entropic domination of the solvation free energy to enthalpic as a function of size for the case of a spherical cavity, with a characteristic length scale for the transition of ∼1 nm.27,28 This type of hydration also results in a depletion of water molecule density close to the hydrophobic surface, unlike the case for the small spherical solutes such as methane, where there is a peak in water density at approximately the contact distance, so that the hydration of these surfaces is characterized by a dewetting, with an extended zone from which water is excluded.28,29
Caffeine offers the interesting possibility of further testing these ideas experimentally, since, while it is planar with hydrophobic faces, unlike benzene, it is sparingly soluble in water, due to its several hydrogen bonding functional groups. As a result, there are more experimental calorimetric data available for caffeine molecules in water. As already noted, such data have shown that it associates in water, that this association is enthalpically-driven, and that its solubility increases with temperature, contrary to the behavior characteristic for entropy-driven association.8,9 The present studies are designed to examine the molecular details of caffeine hydration and association, which can then be compared with both the theoretical models and experimental data. Thus, as part of a larger project to characterize the interactions of sugars with caffeine, we report molecular dynamics simulations of caffeine in aqueous solution, to provide a description of how water interacts with and is structured by caffeine, and also how caffeine molecules associate in aqueous solution. The purposes of the study included providing a qualitative test for the procedures used to model caffeine solutions, examining the structural features of caffeine solutions that have not thus far been available using other methods, and comparing the details of caffeine hydration and association with expectations from general theories of hydrophobic hydration.
Procedures
Caffeine Force Field Development
Parameter values for the bonds, angles, dihedrals, and improper dihedrals of caffeine were based on the existing CHARMM27 nucleic acid parameter sets for guanine and uracil.35,36 Several charge sets for caffeine can be found in the literature. The set reported by Shestopalova37 was used to investigate the interaction of caffeine with actinocin derivatives. By initially adopting the charge set for the simulation of stacking glucose against caffeine, it was found that the low partial charge values of this set promoted a strong hydrophobic behavior, underestimating the polar interactions. On the other hand, the unscaled charge set of Sanjeewa and Weeasinghe,14 with high partial charges for O and N, was inappropriate for use with the chosen TIP3P and TIP4P water models. In this work, B3LYP and MP2 level quantum mechanical calculations were used to estimate electronic densities. The geometry for caffeine was optimized at the MP2/6-311++G** and B3LYP/6-311++G** level of theory using the programs Gaussian09 and NWCHEM 6.0.38,39 In general, the geometries calculated via the B3LYP/6-311++G** level of theory are very reliable. On the other hand, properties and energies can differ significantly between the two methods. For example, in the present case the vacuum dipole moment for caffeine at the MP2/6-311++G** level of theory is 4.55D, while for B3LYP/6-311++G** the vacuum dipole is 3.90D. Experimentally, the reported dipole moment for caffeine in benzene is 3.70(+/- 0.05)D.40 A starting ESP and Mullikan charge set was calculated and adjusted/scaled to the CHARMM27 all-hydrogen nucleic acid force field. This included adjusting the proton charge at the methyl groups to 0.09 (a standard CHARMM force field requirement). Further, the heavy atom charges (N, O, and C) were adjusted to a range of charges commonly used in the CHARMM27 force field for similar valence situations. For this crude charge adjustment the dipole moment and its orientation were used40 as criteria to be preserved.
However, the vacuum dipole moment alone is an insufficient criterion for charge set development. It is also necessary to account for the effect of the aqueous environment. To refine the charges further, the force field development strategy outlined by McKerell et al. was used.35,36 This procedure for charge adjustment requires that water molecules be strategically placed around the molecule, with the charges then adjusted to match the HF/6-31G* interaction energy (scaled by 1.16) between the molecule and water. The HF/6-31G* interaction energy was optimized only as a function of distance between the donor/acceptor pair, meaning that the water and caffeine geometries remain fixed in the HF and CHARMM minimizations. Seven interaction points were selected: O2CFF---HOH, O6CFF---HOH, N9CFF---HOH, H8CFF---OHH, H7xCFF---OHH, H3xCFF ---OHH, and H1xCFF ---OHH. The specific water locations used are shown in Figure S1 (Supplementary Material). The focus was on matching the interaction energies and preserving the dipole moment and its orientation. In this case, this constitutes an 8-dimensional minimization problem in which an attempt is made to minimize the root mean square deviation (RSMD) in the interaction difference between the HF/6-31G* and CHARMM results for all of the individual water/caffeine interaction points, while maintaining the dipole moment by adjusting the charge set. For the final charge set (Table 1) the RSMD in the energy difference between the HF/6-31G* and CHARMM results for the seven interaction set was 0.138 kJ/mol, the average difference 0.0374 kJ/mol, and the absolute error 0.0988 kJ/mol, respectively. The final vacuum dipole moment was calculated at 4.3D, which is somewhat higher than the experimentally measured value in benzene (3.7D)40 but still falls in between the QM vacuum dipole moments of 3.9D for B3LYP/6-311++G** and 4.55D for MP2/6-311++G**. The overall orientation of the dipole moment was maintained.
Table 1.
The atomic partial charges developed for the present MD simulations (see Figure 1 for the atomic naming conventions).
| Atom | Partial charge |
|---|---|
| N1 | -0.432 |
| C1M | -0.008 |
| C2 | 0.505 |
| O2 | -0.454 |
| N3 | -0.342 |
| C3M | 0.093 |
| C4 | 0.357 |
| C5 | -0.402 |
| C6 | 0.610 |
| O6 | -0.470 |
| N7 | -0.033 |
| C7M | -0.054 |
| C8 | 0.170 |
| H8 | 0.216 |
| N9 | -0.566 |
| all methyl protons | 0.090 |
It should be noted that during the optimization of the charge set no attempted was made to include caffeine/caffeine stacking behavior or interaction of water perpendicular to the ring plane. Although the charges on C4 and C5 are relatively high and of opposite signs, such a situation is not uncommon for similar molecules in the CHARMM27 topology set except for the somewhat high negative charge on C5, which compensates or balances the small charge on N7.
Simulation Protocols
MD simulations were performed for both a single caffeine molecule in a box of water, and for a much larger system of eight independent caffeine molecules in water. The simulations were carried out in the microcanonical ensemble (NVE) using the CHARMM molecular mechanics program,41,42 with the energy parameters developed for this purpose. Atomic partial charges for the caffeine molecule were developed using the standard CHARMM procedure, as described above.35,36 Starting atomic coordinates for the caffeine molecules were taken from the reported monohydrate crystal structure.10
In the study of the interactions of water with an individual caffeine molecule, two simulations of a 0.083 molal caffeine solution were performed using two different water models, TIP3P and TIP4P.43,44 In both cases, the system studied was a periodic cubic box containing 1 caffeine molecule and 667 water molecules. The lengths of the covalent bonds involving hydrogen atoms were kept fixed using the SHAKE algorithm.45,46 The Newtonian equations of motions were integrated using a time step of 1 fs. van der Waals interactions were smoothly truncated on an atom-by-atom basis using switching functions from 10.5 to 11.5 Å. Initial configurations were first minimized with 500 steps of steepest descent minimization to remove bad local contacts, after which the system was heated from 0 to 300 K over 10 ps. The size of the box was adjusted to 27.3 Å to yield the density of water at 27°C. The trajectory data were collected for 10 ns, which was deemed sufficient considering the fast relaxation rates and diffusion coefficients for water and the rapid rate of structural convergence in similar aqueous solutions of rigid solutes.
The construction of the box containing 8 caffeine molecules was made as before by using as a starting box one generated by replicating along the three axes a box of 518 water molecules. Then, starting coordinates were generated by randomly placing and orienting 8 caffeine molecules in the resulting equilibrated cubic box of 4144 water molecules, with sides of 50.2464 Å, and removing those water molecules whose oxygen atoms were closer than 2.4 Å to any solute heavy atom. The resulting system consisted of 8 caffeine molecules and 4067 water molecules. The concentration of caffeine was thus 0.109 m, the solubility limit at 298 K.24 The water model used was TIP4P. The size of the cubic box was then rescaled to 49.9453 Å to achieve the density of water (0.996 g/cm3) at 27°C. The simulation was run for 63.2 ns, and the final 50 ns were used for analysis. This simulation ran for a total of about 50 days on an 8-processor Linux cluster. Atomic density analyses of the trajectory were carried out using the Visual Molecular Dynamics (VMD) graphics program.47
Results and Discussion
Caffeine hydration
The interactions of caffeine with solvent water are highly complex, as has been observed for many other large, polyatomic solute molecules.48-50 Caffeine contains several types of functional groups that will have different individual hydration patterns, as well as flat hydrophobic faces. The carbonyl oxygen atoms O2 and O6, as well the ring atom N9 (see Figure 1), can all serve as hydrogen bond acceptors, and in the simulations were found to make the expected well-behaved hydrogen bonds to water molecules. Figure 3 shows the radial distribution functions for water oxygen atoms calculated around each of these atoms, as well as a similar function for the H8 proton and the non-polar C8 carbon atom to which it is bound. As can be seen, the water molecules make typical hydrogen bonds to the O2, O6, and N9 atoms, with integrals to the first minima giving approximately two such hydrogen-bonded neighbors for each case (Table 2). The H8 proton also interacts with the water in a manner somewhat resembling hydrogen bonding, with a g(r) intermediate between that of an aliphatic group and a hydrogen bonding one, due to its higher than normal partial charge (Figure 1 and Table 1). Such hydrogen bonding behavior has also been observed previously for the topologically and chemically similar protons of nucleic acid purines,11 and is evident in the crystal structure of the monohydrate as well (Figure 2). However, the first peak of this distribution function is still much broader than would be the case for a true hydrogen bond donor proton.
Figure 3.
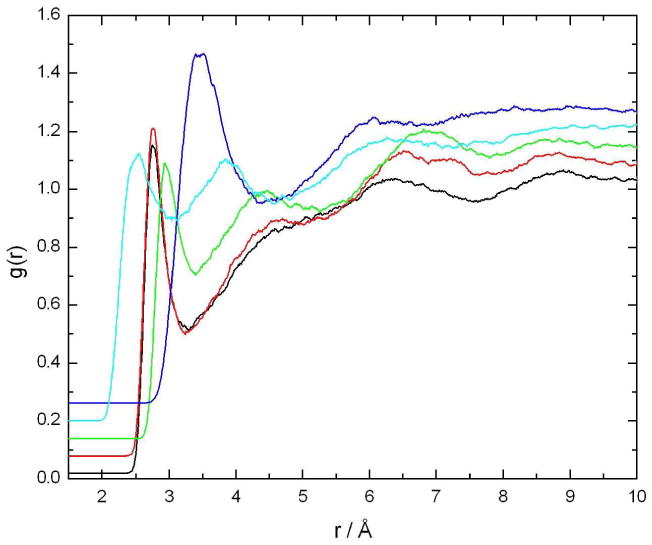
Radial distribution functions for water oxygen atoms around five specific atoms in the caffeine molecule, as calculated from the simulation of a single caffeine molecule in solution. Black: O2; red: O6; light blue: H8; green: N9; dark blue: C8. Each successive curve is displaced upwards by 0.03 for clarity.
Table 2.
The number of water molecule neighbors for selected caffeine atoms.
| atom | distance of first minimum in gxow(r) (Å) | number of neighbors out to first minimum |
|---|---|---|
| O2 | 3.29 | 1.88 |
| O6 | 3.25 | 1.71 |
| N9 | 3.39 | 1.83 |
| C8 | 4.56 | 8.11 |
| H8 | 3.13 | 2.11 |
Since the hydration of one atom in a complex solute like caffeine necessarily also contributes to the hydration of its neighboring atoms in the solute, it is perhaps more informative to look at the full three-dimensional anisotropic distribution of solvent molecules around the caffeine as calculated in a reference frame fixed with respect to the solute molecule.49 Figure 4 displays the density of water oxygen atoms as calculated relative to the center of mass of the caffeine, contoured at densities of 1.3 times bulk density and 1.4 times bulk. As can be seen from these figures, water molecules are not uniformly distributed around the caffeine solute. Although polar, caffeine is relatively hydrophobic due to its weakly hydrating faces, and the water molecules around it are not as strongly localized as in previous simulation studies of other complex solutes such as xylose,49 guanidinium,50 or pyridine.51 Nevertheless, it can be seen that there are clearly preferred positions for the solvent molecules relative to the solute, as has been seen in all such previous cases as well. Two small clouds of density at roughly the tetrahedral angle can be seen around both of the carbonyl oxygen atoms, as would be expected for two water molecules hydrogen bonding as donors to these atoms. There are also caps of density above and below the ring planes for those water molecules hydrating these hydrophobic faces, at a greater distance (∼ 0.5 Å further away).28 These density caps merge at this density contour level with a long, narrow band of density wrapping around the N9 atom, primarily arising from approximately two water molecules that are interacting as hydrogen bond donors to this atom, but less strongly localized than those hydrogen bonded to the carbonyl oxygen atoms. At the slightly higher density contour level displayed in Figure 4b, it can be seen that there is a significant density in the plane of the caffeine ring due to a water molecule making a linear, in-plane hydrogen bond to this nitrogen atom (note that the caffeine molecule in Figure 4b is oriented with N9 facing the observer, unlike in Figure 4a). This position roughly corresponds to that of the water molecules that bridge between caffeines in the monohydrated crystal form (see Figure 2),10 consistent with a previous hypothesis that this crystallographic interaction already exists in solution before crystallization.52 As can be seen by the disappearance of the hydrogen bond clouds for the carbonyl oxygen atoms at this higher density level, this water molecule position is somewhat more localized than water molecules interacting with O2 and O6.
Figure 4.
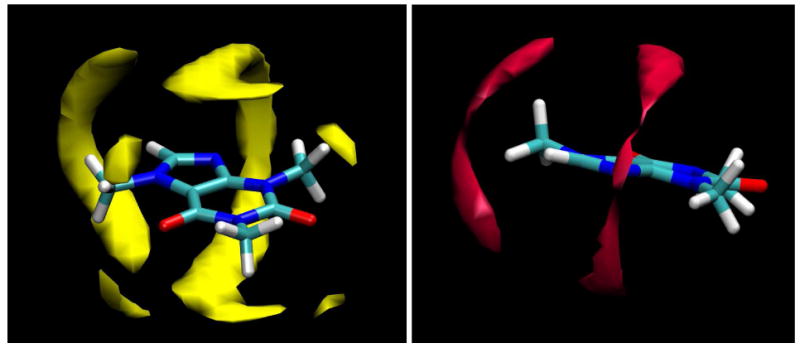
Contours of TIP4P solvent density calculated in a frame fixed with respect to the center of mass of the solute. The contour surface encloses those regions with a water oxygen atom density 1.3 times bulk density (a, left) and 1.4 times bulk (b, right).
Interestingly, there is also a band of high solvent density wrapping around the solute roughly equidistant from the van der Waals surface of H8. It is not clear to what the origin of this band of density is due. In previous studies, such solvent localization has generally been seen to arise from direct interactions with specific hydrogen-bonding functional groups in the solute.49-51 In this case, however, it is less clear what interactions have given rise to this localization of water density. The proton H8 is not a typical aliphatic hydrogen atom, since the carbon atom to which it is bound is not sp3 hybridized. A reflection of this difference is the atomic partial charge of 0.216 vs. the typical 0.09 (see Figure 1 and Table 1), and thus this C-H could be thought of as a weak hydrogen-bonding-like moiety, also consistent with its unusual radial distribution function in Figure 3. These molecules are oriented as hydrogen bond acceptors, and there are three occupied positions, one in the plane of the solute and one each above and below the plane, at approximately tetrahedral angles, as can be seen in Figure 4b. Such hydrogen-bonding-like interactions have been previously observed experimentally for the similar proton in nucleic acid purines.11 Of course, if this proton were truly functioning as a hydrogen bond donor, only one highly localized peak would be expected in the plane of the molecule.
Table 2 lists the number of first neighbors for selected atoms as calculated from the integral of the radial distribution functions. The hydrogen bond acceptors O2, O6, and N9 each make somewhat less that two hydrogen bonds to water molecules by this criterion. The non-polar C8 atom has approximately 8 neighbors, as might be expected for such an atom. H8, however, also makes approximately two hydrogen-bond-like interactions with neighboring water molecules, again consistent with the picture of this proton being a weak, hydrogen-bond-like donor (as already noted, if it was truly functioning as a hydrogen-bond donor, it would make only one such hydrogen-bond-like interaction, and at a shorter separation distance).
The TIP4P water model was used in the present simulation, even though TIP3P was used in a related previous series of studies,51,53,54 since the TIP3P model is known to give a somewhat less tetrahedrally-structured condensed phase than the four center model,43,55 also resulting in a water self-diffusion coefficient that is too large by almost a factor of two. However, the details of the solvent structuring observed here are unlikely to be an artifact of the water model employed, since the single caffeine molecule simulation was carried out using both the TIP3P and TIP4P water models, with very similar results (see Figure 5). The two simulations were not identical, however; note the absence of the two tetrahedral clouds around O2 for the TIP3P case at the selected contour level (these clouds do appear at a lower contour level, however). While the TIP4P model is necessarily more computationally “expensive” to use due to the larger number of interactions, it has the twin advantages of being in slightly better agreement with structural data for pure water and, as a result, giving much more quantitatively accurate diffusional behavior.
Figure 5.
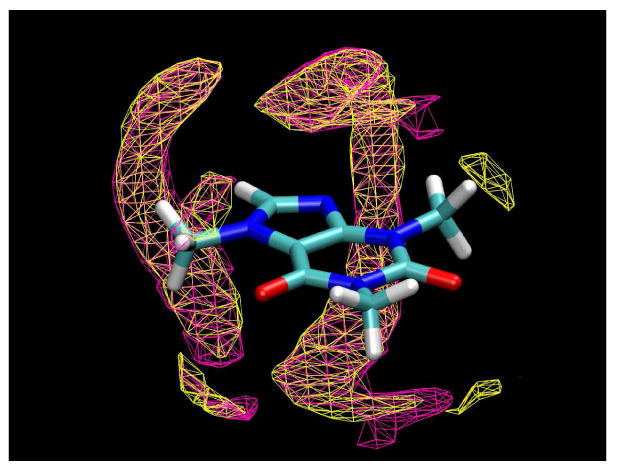
Clouds of water oxygen atom density as calculated from MD simulations of a single caffeine molecule in TIP3P (magenta) and TIP4P (yellow) water. The contour surfaces enclose regions with a density 1.3 times higher than the bulk value.
Caffeine Association
As expected from previous experimental studies, considerable aggregation of the caffeine molecules was observed in the larger simulation of eight independent solute molecules. The overwhelmingly predominant mode of this association was by stacking like coins of the planar faces (Figures 6 and S2, Supplementary Material). Figure 6 shows an example of such a cluster of size three. This stacking led to aggregates of various sizes, dynamically exchanging as monomers or larger aggregates added to existing clusters, while other clusters broke up into smaller stacks or monomers. Figure 6 also displays the contours of caffeine density calculated relative to a frame fixed with respect to each individual solute molecule, in a manner analogous to the contouring in Figures 4 and 5. The series of density clouds above and below the reference molecule clearly indicate the stacked nature of the interactions and the tendency to form extended clusters (the small deviations from perfect symmetry in these clouds is a reflection of a lack of complete thermodynamic convergence in the trajectories). The contouring in Figure 6 tends to overemphasize the appearance of rigidity in these clusters, which had some latitude for individual members of the stacks to displace with respect to the stack axis, as can also be seen in both Figures 6 and S2.
Figure 6.
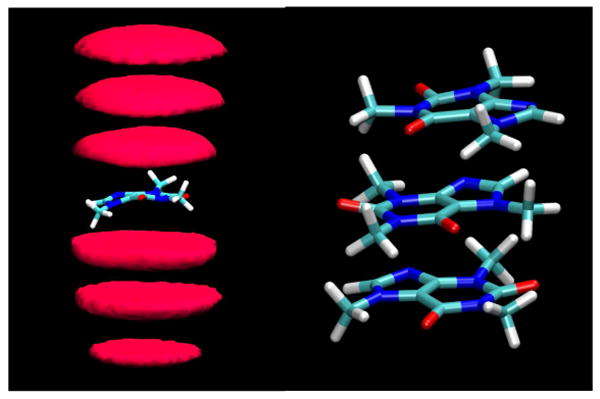
Caffeine stacking. Left: contours of caffeine density calculated relative to each caffeine molecule as calculated from the MD simulations. The contours enclose regions with a caffeine atom density of 10 times bulk density or higher for the last 20 ns of the simulation. Right: an example of a stacked cluster of size three, shown in atomic detail.
It can also be seen from Figure 6 that steric clashes between the methyl groups in stacked molecules cause certain relative orientations of the molecules, as characterized by the angles between their dipole vectors, to be preferred, so as to avoid such clashes. Figure 7 shows that the potential steric clashes of the methyl groups for stacked pairs of caffeine molecules leads to a disordered three-fold symmetry with three probable relative positions for the solute oxygen atoms. As might be expected, the stacking also perturbs the solvent structuring around the collective stack somewhat, since for the central caffeine molecules in the stacks, the water primarily can only be in the approximate plane of each ring, because the presence of the neighboring caffeine molecules interferes with the development of the “banana-shaped“ water density clouds that are possible for caffeine monomers or for the terminal solute molecule of a stack (as in Figure 4).
Figure 7.
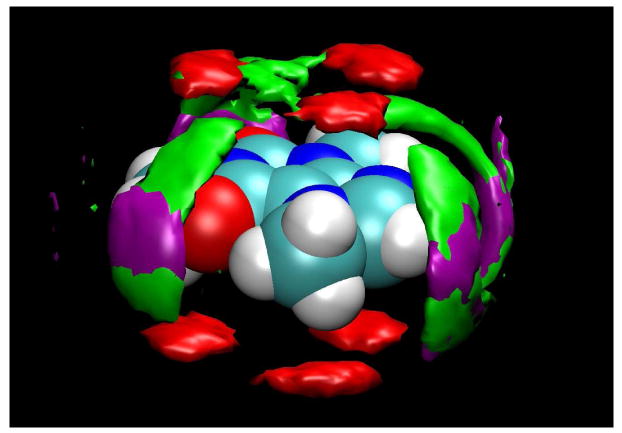
Contours of caffeine oxygen atom density, shown in red, contoured relative to each caffeine molecule, averaged over a 1 ns period during which all 8 caffeine molecules were in a single aggregate. The three preferred positions resulting from the tendency of adjacent molecules to stack with orientations that avoid steric clashes of their methyl groups can clearly be seen. Water density is contoured at 2.4 times bulk density in green and purple; purple indicates water molecules adjacent to caffeine molecules in the interior of the aggregate stack, and green contours are calculated for the terminal caffeine molecules of the stack.
The simulation began with the caffeine molecules randomly distributed in the cubic box, and it took considerable time for the larger clusters to begin to form, due to the slow diffusion rate of the caffeine molecules. Initially, two dimers formed, one of which then grew to a trimer and then a tetramer by monomer capture. This tetramer subsequently broke in two, giving a system of three dimers and two monomers. The system continued exchanging monomers in this fashion until a trimer and a pentamer combined to give a stacked octamer. The first appearance of this octamer aggregate occurred around 9 ns into the simulation. Once formed, there were also numerous scission events in which larger aggregates broke up into smaller stacks or monomers. The longest uninterrupted lifetime observed for an octamer was ∼ 1 ns (this particular sequence was used to construct Figure 7).
Figure 8 displays the probability distribution for clusters of various sizes as calculated from the final 50 ns of the simulation, since the gradual evolution away from the highly artificial starting structure took approximately 12 ns. Unfortunately, even though the present simulation was quite lengthy, the calculated probability distribution is not fully converged. However, from such a distribution, it is possible to estimate the osmotic coefficient, which can be compared to the experimental value. For the distribution in Figure 8, the osmotic coefficient was calculated to be 0.49, as compared with the experimental value of 0.60 (measured at the slightly different temperature of 25°C). Note also that the size distribution agrees qualitatively with that expected from the isodesmic model, also illustrated in Figure 8. In this model,56,57 which has also been used to interpret the data for other purine-like molecules,58,59 the binding energy for the addition of a monomer to an aggregate is the same regardless of the size of the aggregate. Thus, the model is characterized by a unique nearest-neighbor interaction strength that is independent of the length of the cluster (equal molar equilibrium constants). The simplicity of this model is that it is exactly solvable, like the one-dimensional Ising model (in this case non-cooperative), although other authors have used a discrete association model of dimers and tetramers, including polymers of stacked caffeine molecules.13,60
Figure 8.
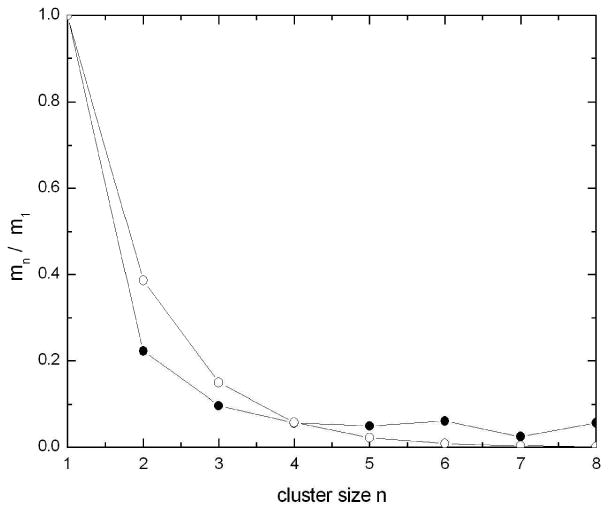
The distribution of cluster sizes as calculated from the final 50 ns of the simulation (black circles), compared to the calculated distribution of cluster sizes at 0.109 m for the isodesmic model (open circles) with all equal equilibrium constants K = 9.4 for the association from the osmotic data.8 The lines are not fitted curves, but simply connect successive points in each series as a visual guide.
The computed distribution exhibits higher probabilities for the largest size clusters than would be expected from the isodesmic model of the experimental data. From examination of the details of cluster formation and break-up, it seems that this effect is due to the coupling of the energetics of paring with the increasingly slow kinetics for escape of large aggregates as the size increases. For example, if a cluster of size 8 breaks into two smaller clusters of size 4, or 5 and 3, with the same energy change in either case, as predicted by the isodesmic model, the slow diffusion rates for these large aggregates means that they are more likely to reform in a given time than would be the case for two monomers (in this circumstance, use of the TIP3P water model, with its higher diffusion coefficient, might have facilitated convergence). This effect would be balanced at the ends of the stack by the escape of monomers and dimers, which would still occur with more rapid kinetics. The balance of these effects would lead to the formation of clusters of some intermediate large average size, but would not cause the solution to proceed to complete aggregation and phase separation, which is consistent with experiment since it is of course known that at this concentration and temperature, the caffeine molecules do remain in solution.
It is also of some interest to further characterize how individual caffeine molecules stack against each other to form an n-mer in solution, to determine whether there is any influence from dipole vector interactions. One way to characterize the relative orientation of two caffeine molecules in van der Waals contact is to determine the angle θ̣ between their individual dipole vectors. The dipole moment of caffeine in the simulations is 4.3 D, which is significantly larger than that of water, as well as the experimental value of ∼3.6 - 3.7 D in benzene6 (although comparable to the 4.6 D in dioxane6), and the clusters might structure so as to reduce the overall dipole moment of the an n-mers by orienting the caffeine molecules. If so, orientations other than a parallel alignment of the individual dipole moments in the stack should be found (as already seen, perfect parallel alignment is not allowed by steric clashes of the methyl groups; (Figure 7)).
Figure 9 shows two caffeine molecules in van der Waals contact for which the individual dipole moments are aligned parallel to one another. There are two possible parallel alignments of these individual dipoles, as shown in the figure: “non-flipped” and “flipped”. Figure 10 displays the distribution of the angle θ between the two dipoles as computed from the last 50 ns of the trajectory, as for the clustering analysis of Figure 8. It can be seen from this figure that the dipole moments preferentially align anti-parallel (cosθ = −1), whether the caffeine molecules are flipped (dotted line) against each other or not (dashed line). However, the perpendicular and parallel alignments are not much less probable, consistent with the NMR analysis.12 This suggests that the stacking interaction energies for different caffeine-caffeine arrangements are similar. From the probability distributions it can be estimated that the relative ΔG range is < 8.4 kJ/mol for the distribution shown in the figure. Poltev et al. investigated caffeine association using the MP2/6-31G(d,p) level of theory and reported stacking minima in the range of −46.46 kJ/mol to −49.39 kJ/mol, with an almost anti-parallel orientation being of lowest energy.61 This reported small energy range for the different energy minima supports the present finding that the distribution probabilities for the different orientations are similar. The structuring in the probability distribution shown in Figure 10 is caused by steric avoidance of the methyl and carbonyl groups during the n-mer formation.
Figure 9.
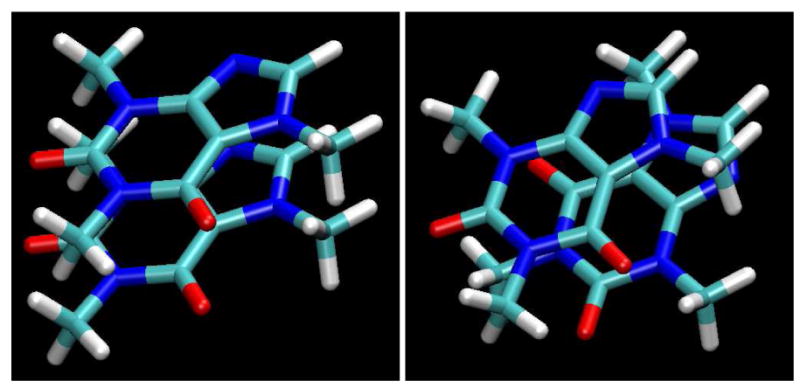
The two possible parallel alignments of the dipole moment vectors for two stacked caffeine molecules; left: non-flipped, right: flipped (see text). Note the steric clashes in the example on the left.
Figure 10.
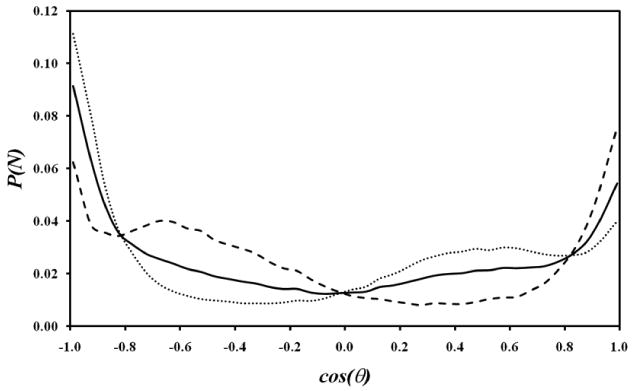
The cosine of the average angle θ between two consecutive stacked caffeine dipole vectors as calculated from the simulations. The dotted line is for flipped orientations (the second caffeine is “flipped” by rotation of 180° around the dipole axis); the dashed line is for non-flipped orientations; and the solid line is for all orientations.
In Figure 11 the probability distribution of the cosine of the angle between the dipole vectors of two caffeine molecules in van der Waals contact is shown for the caffeine molecules in a flipped arrangement for all the molecules in an n-mer (solid line) compared to the caffeine molecules at the terminal (dotted line) and inner part (dashed line) of the n-mer. This figure illustrates that there is no preference in how the individual dipole moments orient against each other, regardless of the position of the caffeine in the n-mer. Due to the planar symmetry of the caffeine, it is necessary to consider the two arrangements of the caffeine molecules shown in Figure 9 and ask if there is a preferred pattern of flipped and non-flipped arrangement within the n-mer stack. The observed ratio of flipped to non-flipped arrangements is 40:60, which suggests that there is no preferred arrangement in the make-up of an individual n-mer stack.
Figure 11.
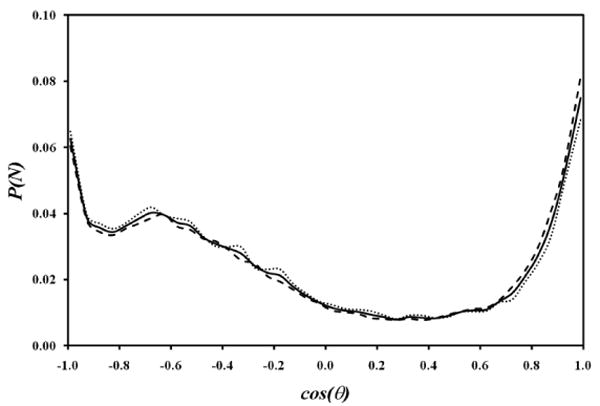
The cosine of the angle θ between two consecutive stacked caffeine dipole vectors for the terminal (dotted)/center (dashed)/all (solid) caffeine molecules; it can be seen that there is no orientational preference between the terminal and center molecules in a stack.
The Role of Hydration in Caffeine Association
As has been seen, the various polar functional groups of caffeine hydrate as might be expected, with the oxygen atoms and the N9 nitrogen atom making conventional hydrogen bonds to water molecules, collectively accounting for an average of 5.42 hydrogen bonded water neighbors (Table 2). Somewhat less expectedly, the unconventional H8 atom also makes well-localized interactions that resemble hydrogen bonds with, on average, 2.11 neighboring water molecules. The band of water density occupied by these water molecules wraps around the caffeine molecule and merges at the top and bottom with density, at a somewhat greater distance from the solute, occupied by water molecules hydrating the flat faces of the solute. These molecules, however, exhibit the type of structuring expected for extended hydrophobic surfaces, as can be seen in Figure 12, which illustrates the instantaneous orientations, from a “snapshot” of the trajectory, of two water molecules contributing to those density clouds above and below the flat faces. Directly over the center of the molecule, in a cylindrical volume centered on the C4-C5 bond, water molecules point either a proton or lone pair directly at the non-hydrogen-bonding surface. Figure 13 displays the probability of observing an angle of cosθ, P(cosθ), between the normal to the surface and the vector from the water oxygen atom to the proton positions. As can be seen, there is a prominent peak at -1, indicating a high probability for a proton to point directly at the surface. The second broad maximum centered around the tetrahedral angle is a consequence of the quasi-tetrahedral structure of the water molecule; if one proton is pointing at the surface, the other must be making the tetrahedral angle with respect to it.
Figure 12.
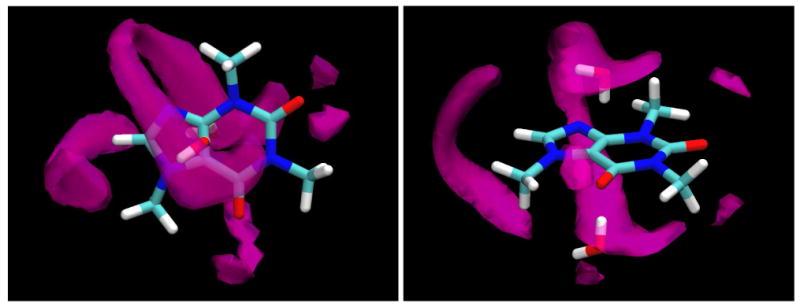
Top (a, left) and side (b, right) views of an instantaneous configuration of two of the water molecules that contribute to the water oxygen density clouds shown in purple. Note that these water molecules are positioned approximately above the C4-C5 bond, and that both are both pointing a hydrogen atom directly at this non-hydrogen-bonding surface.
Figure 13.
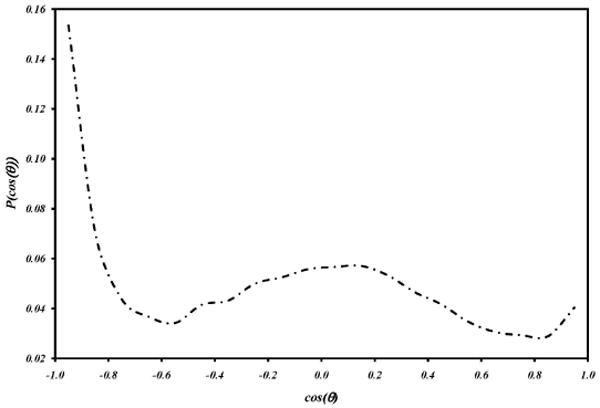
The probability of observing an angle cosθ between the water bond vectors and the normal to the caffeine surface plane, for water molecules in a cylinder of radius 0.675 Å centered on the midpoint of the C4-C5 bond of the caffeine, and within 4.5 Å of the surface.
These structured water molecules explain the experimentally-observed dominance of the enthalpic contribution to the free energy of aggregation. If two caffeine molecules aggregate by face-to-face stacking, these water molecules are liberated, with a gain in entropy, but with a much larger gain in enthalpy, due to the recovery of the freedom of these molecules to make hydrogen bonds to other water molecules. It should be noted, however, that the volume of this region is small, and thus the number of water molecules structured in this way is also small, approximately 0.29 per caffeine averaged over the trajectory, which explains the relatively small magnitude of the enthalpy change, even though it comes from recovered water-water hydrogen bonding.
Unlike the hydration of more extended hydrophobic surfaces, there was no significant dewetting observed in the caffeine hydration, with the density maximum for those water molecules contributing to Figure 13 coming at approximately the same distance from the surface as would be seen for methane. However, this is not particularly surprising given the size and character of the solute. As noted, the spatial extent of the planar surface of caffeine is considerably less than the 1 nm dimension calculated by Huang and Chandler for the transition to dewetting behavior.27,28 Also, the close proximity of the polar, hydrogen bonding functionalities on the caffeine molecule impose additional constraints on the positions and orientations of these water molecules, through interactions with the water molecules hydrogen bonded to those groups, that would not exist for an extended, featureless hydrophobic surface.
Conclusions
The present simulations find that caffeine in aqueous solution imposes a complex organization on its adjacent solvent molecules, as has previously been seen for other molecular solutes. As with these other biological species, the exact details of this structuring are a complicated function of the molecular architecture of the solute. In addition, a pronounced tendency for the caffeine molecules to aggregate was observed, with the mechanism of aggregation being stacking of the hydrophobic planar faces. This stacking resembles hydrophobic association, with the face-to-face stacking liberating structured water molecules, although the entropic change upon association could not be determined from these simulations.
The observed association is consistent with experimental osmotic data and previous theoretical results for caffeine in aqueous solution, which serves to validate the various approximations of the computational model used here, including the ad hoc force field parameters. Thus, these models can be assumed to be adequate for the simulation of caffeine interacting with other species such as sugars in aqueous solutions. However, future free energy calculations for further comparison with thermodynamic data would be desirable, since it is clear that these simulations, lengthy though they were, are still incompletely converged and can give only qualitative agreement with these measurements. In addition to timescale, system size may also have been a limiting factor,62 although in our previous simulations of guanidinium aggregation, which studied aggregation as a function of system size and concentration, no such effects were found.50
The degree of association observed here should be detectable using small-angle X-ray scattering (SAXS) experiments, provided the contrast is sufficient, and such experiments might serve as a further test of the present results. Finally, while the association energy for the aggregation observed here cannot be dissected from the present results to determine the accompanying entropy change, it would appear to be driven by the pairing of hydrophobic faces. Although caffeine is shorter than 1 nm, the structuring of water molecules directly above the faces is consistent with that predicted for flat hydrophobic faces, and explains how the association can be both hydrophobic in character and enthalpically-driven.8,9 It would be quite interesting to use free energy calculations in future studies to calculate a potential of mean force for caffeine pairing, and to determine the entropic and enthalpic contributions to the free energy for such pairing.
Supplementary Material
Acknowledgments
The authors thank Luciano Navarini for helpful discussions, and Hitomi Miyamoto for preparing Figure 2. This project was supported by a grant from the National Institutes of Health (GM63018).
Footnotes
Supporting Material Available: A figure showing the water orientations used for the force field setup and a figure showing a representative snapshot of different cluster sizes during the dynamics simulation. This information is available free of charge via the Internet at http://pubs.acs.org/.
References
- 1.Mohanpuria P, Kumar V, Yadav SK. Food Sci Biotechnol. 2010;19:275–287. [Google Scholar]
- 2.Ranheim T, Halvorsen B. Mol Nutr Food Res. 2005;49:274–284. doi: 10.1002/mnfr.200400109. [DOI] [PubMed] [Google Scholar]
- 3.Westerterp-Plantenga M, Diepvens K, Joosen AMCP, Bérubé-Parent S, Tremblay A. Physiol Behav. 2006;89:85–91. doi: 10.1016/j.physbeh.2006.01.027. [DOI] [PubMed] [Google Scholar]
- 4.van Dam RM. Appl Physiol Nutr Metab. 2008;33:1269–1283. doi: 10.1139/H08-120. [DOI] [PubMed] [Google Scholar]
- 5.Kato M, Mizuno K, Crozier A, Fujimura T, Ashihara H. Nature. 2000;406:956–957. doi: 10.1038/35023072. [DOI] [PubMed] [Google Scholar]
- 6.Párkányi C, Boniface C, Aaron JJ, Bulaceanu-MacNair M, Dakkouri M. Collect Czech Chem Commun. 2002;67:1109–1124. [Google Scholar]
- 7.Ramalakshmi K, Raghavan B. Crit Rev Food Sci Nutr. 1999;39:441–456. doi: 10.1080/10408699991279231. [DOI] [PubMed] [Google Scholar]
- 8.Cesàro A, Russo E, Crescenzi V. J Phys Chem. 1976;80:335–339. [Google Scholar]
- 9.Stoesser PR, Gill SJ. J Phys Chem. 1967;71:564–567. doi: 10.1021/j100862a016. [DOI] [PubMed] [Google Scholar]
- 10.Sutor DJ. Acta Cryst. 1958;11:453–458. [Google Scholar]
- 11.Teng MK, Usman N, Frederick CA, Wang AHJ. Nucleic Acid Research. 1988;16:2671–2690. doi: 10.1093/nar/16.6.2671. [DOI] [PMC free article] [PubMed] [Google Scholar]
- 12.Falk M, Chew W, Walter JA, Kwiatkowski W, Barclay KD, Klassen GA. Can J Chem. 1998;76:48–56. [Google Scholar]
- 13.Falk M, Gil M, Iza N. Can J Chem. 1990;68:1293–1299. [Google Scholar]
- 14.Sanjeewa R, Weerasinghe S. J Mol Struct-Theochem. 2010;944:116–123. [Google Scholar]
- 15.Danilov VI, Shestopalova AV. Int J Quantum Chem. 1989;XXXV:103–112. [Google Scholar]
- 16.Al-Maaieh A, Flanagan DR. J Pharm Sci. 2002;91:1000–1008. doi: 10.1002/jps.10046. [DOI] [PubMed] [Google Scholar]
- 17.Lilley TH, Linsdell H, Maestre A. J Chem Soc Faraday Trans. 1992;88:2865–2870. [Google Scholar]
- 18.Stern JH, Lowe E. J Chem Eng Data. 1978;23:341–342. [Google Scholar]
- 19.Cesàro A, Russo E, Tessarotto D. J Solution Chem. 1980;9:221–235. [Google Scholar]
- 20.Edwards HGM, Lawson E, de Matas M, Shields L, York P. J Chem Soc, Perkin Trans II. 1997:1985–1990. [Google Scholar]
- 21.Derollez P, Correia NT, Danede F, Capet F, Affouard F, Lefebvre J, Descamps M. Acta Crystallogr B. 2005;61:329–334. doi: 10.1107/S010876810500546X. [DOI] [PubMed] [Google Scholar]
- 22.Enright GD, Terskikh VV, Brouwer DH, Ripmeester JA. Crystal Growth and Design. 2007;7:1406–1410. [Google Scholar]
- 23.Descamps M, Correia NT, Derollez P, Danede F, Capet F. J Phys Chem B. 2005;109:16092–16098. doi: 10.1021/jp040494c. [DOI] [PubMed] [Google Scholar]
- 24.Cesàro A, Starec G. J Phys Chem. 1980;84:1345–1346. [Google Scholar]
- 25.Lehmann CW, Stowasser F. Chem – Eur J. 2007;13:2908–2911. doi: 10.1002/chem.200600973. [DOI] [PubMed] [Google Scholar]
- 26.Ashbaugh HS, Paulaitis ME. J Am Chem Soc. 2001;123:10721–10728. doi: 10.1021/ja016324k. [DOI] [PubMed] [Google Scholar]
- 27.Huang DM, Chandler D. J Phys Chem B. 2002;106:2047–2053. [Google Scholar]
- 28.Chandler D. Nature. 2005;437:640–647. doi: 10.1038/nature04162. [DOI] [PubMed] [Google Scholar]
- 29.Zangi R, Berne BJ. J Phys Chem B. 2008;112:8634–8644. doi: 10.1021/jp802135c. [DOI] [PubMed] [Google Scholar]
- 30.Stillinger FH. Science. 1980;209:451–457. doi: 10.1126/science.209.4455.451. [DOI] [PubMed] [Google Scholar]
- 31.Lee CY, McCammon JA, Rossky PJ. J Chem Phys. 1984;80:4448–4455. [Google Scholar]
- 32.Lee SH, Rossky PJ. J Chem Phys. 1994;100:3334–3345. [Google Scholar]
- 33.Raschke TM, Tsai J, Levitt M. Proc Natl Acad Sci USA. 2001;98:5965–5969. doi: 10.1073/pnas.111158498. [DOI] [PMC free article] [PubMed] [Google Scholar]
- 34.Schravendijk P, van der Vegt NFA. J Chem Theory Comput. 2005;1:643–652. doi: 10.1021/ct049841c. [DOI] [PubMed] [Google Scholar]
- 35.Foloppe N, MacKerell AD. J Comput Chem. 2000;21:86–104. [Google Scholar]
- 36.MacKerell AD, Banavali N. J Comput Chem. 2000;21:105–120. [Google Scholar]
- 37.Shestopalova AV. J Mol Liq. 2006;127:113–117. [Google Scholar]
- 38.Frisch MJ, Trucks GW, Schlegel HB, Scuseria GE, Robb MA, Cheeseman JR, Scalmani G, Barone V, Mennucci B, Petersson GA, et al. Gaussian09, Revision A. 1. Gaussian, Inc; Wallingford CT: 2009. [Google Scholar]
- 39.Bylaska EJ, de Jong WA, Govind N, Kowalski K, Straatsma TP, Valiev M, Wang D, Apra E, Windus TL, Hammond J, et al. NWCHEM 6.0. Pacific Northwest National Laboratory; Richland, Washington: 2008. [Google Scholar]
- 40.Weiler-Feilchenfeld H, Neiman Z. J Chem Soc B. 1970:596–598. [Google Scholar]
- 41.Brooks BR, Bruccoleri RE, Olafson BD, Swaminathan S, Karplus M. J Comput Chem. 1983;4:187–217. [Google Scholar]
- 42.Brooks BR, Brooks CL, MacKerell AD, J, Nilsson L, Petrella RJ, Roux B, Won Y, Archontis G, Bartels C, Boresch S, Caflisch A, Caves L, Cui Q, Dinner AR, Feig M, Fischer S, Gao J, Hodoscek M, Im W, Kuczera K, Lazaridis T, Ma J, Ovchinnikov V, Paci E, Pastor RW, Post CB, Pu JZ, Schaefer M, Tidor B, Venable RM, Woodcock HL, Wu X, Yang W, York DM, Karplus M. J Comput Chem. 2009;30:1545–1614. doi: 10.1002/jcc.21287. [DOI] [PMC free article] [PubMed] [Google Scholar]
- 43.Jorgensen WL, Chandrasekhar J, Madura JD, Impey RW, Klein ML. J Chem Phys. 1983;79:926–935. [Google Scholar]
- 44.Durell SR, Brooks BR, Ben-Naim A. J Phys Chem. 1994;98:2198–2202. [Google Scholar]
- 45.Miyamoto S, Kollman PA. J Comput Chem. 1992;13:952–962. [Google Scholar]
- 46.van Gunsteren WF, Berendsen HJC. Mol Phys. 1977;34:1311–1327. [Google Scholar]
- 47.Humphrey W, Dalke A, Schulten K. J Mol Graphics. 1996;14:33–38. doi: 10.1016/0263-7855(96)00018-5. [DOI] [PubMed] [Google Scholar]
- 48.Ha S, Gao J, Tidor B, Brady JW, Karplus M. J Am Chem Soc. 1991;113:1553–1557. [Google Scholar]
- 49.Liu Q, Brady JW. J Am Chem Soc. 1996;118:12276–12286. [Google Scholar]
- 50.Mason PE, Neilson GW, Enderby JE, Saboungi ML, Dempsey CE, MacKerell AD, Brady JW. J Am Chem Soc. 2004;126:11462–11470. doi: 10.1021/ja040034x. [DOI] [PubMed] [Google Scholar]
- 51.Mason PE, Neilson GW, Price DL, Saboungi ML, Brady JW. J Phys Chem B. 2010;114:5412–5419. doi: 10.1021/jp9097827. [DOI] [PMC free article] [PubMed] [Google Scholar]
- 52.Carlucci L, Gavezzotti A. Chem Eur J. 2005;11:271–279. doi: 10.1002/chem.200400499. [DOI] [PubMed] [Google Scholar]
- 53.Mason PE, Lerbret A, Saboungi ML, Neilson GW, Dempsey CE, Brady JW. Proteins. 2011;79:2224–2232. doi: 10.1002/prot.23047. [DOI] [PMC free article] [PubMed] [Google Scholar]
- 54.Wohlert J, Schnupf U, Brady JW. J Chem Phys. 2010;133:155103. doi: 10.1063/1.3496997. [DOI] [PMC free article] [PubMed] [Google Scholar]
- 55.Mason PE, Brady JW. J Phys Chem B. 2007;111:5669–5679. doi: 10.1021/jp068581n. [DOI] [PubMed] [Google Scholar]
- 56.Ts'o POP, Chan SI. J Am Chem Soc. 1964;86:4176–4181. [Google Scholar]
- 57.Van Holde KE, Rossetti GP, Dyson RD. Ann NY Acad Sci. 1969;164:279–293. doi: 10.1111/j.1749-6632.1969.tb14044.x. [DOI] [PubMed] [Google Scholar]
- 58.Gill SJ, Downing M, Sheats GF. Biochemistry. 1967;6:272–276. doi: 10.1021/bi00853a042. [DOI] [PubMed] [Google Scholar]
- 59.Broom AD, Schweizer MP, Ts'o POP. J Am Chem Soc. 1967;89:3612–3622. [Google Scholar]
- 60.Guttman D, Higuchi T. J Am Pharmaceut Assoc. 1957;46:4–10. doi: 10.1002/jps.3030460103. [DOI] [PubMed] [Google Scholar]
- 61.Poltev VI, Grokhlina TI, González E, Deriabina A, Cruz A, Gorb L, Leszczynski J, Djimant LN, Veselkov AN. J Mol Struct-Theochem. 2004;709:123–128. [Google Scholar]
- 62.Singh G, Brovchenko I, Oleinkova A, Winter R. Biophys J. 2008;95:3208–3221. doi: 10.1529/biophysj.108.136226. [DOI] [PMC free article] [PubMed] [Google Scholar]
Associated Data
This section collects any data citations, data availability statements, or supplementary materials included in this article.


