

Abstract
Background
Children treated for acute lymphoblastic leukemia (ALL) as High Risk patients may be more vulnerable to neurocognitive late effects because of the greater intensity of their therapy. We compared neuropsychological outcomes in children treated for Standard Risk (SR) or High Risk (HR) ALL on Dana-Farber Cancer Institute (DFCI) Consortium ALL Protocol 95-01. We also evaluated their performance relative to normative expectations.
Procedure
Between 1996 and 2000, 498 children with newly diagnosed ALL were treated on Protocol 95-01, 298 of whom were eligible for neuropsychological follow-up. A feature of this protocol was modification of risk group criteria to treat more children as SR rather than HR patients, intended to minimize toxicities. Testing was completed at a median of 5.3 years post diagnosis for 211 patients (70.8%; ages 6 to 25 years; 45.5% male; 40% High Risk), all of whom were in continuous complete remission.
Results
Test scores for both groups were generally at or above normative expectation, with the exception of verbal working memory, processing complex visual information, and parent ratings of metacognitive skills. After adjusting for covariates, the SR group performed better on measures of IQ and academic achievement, working memory and visual learning. Effect sizes, however, were only in the small to moderate range.
Conclusions
HR patients exhibited neuropsychological deficits relative to SR patients, though the differences were modest in degree. Modification of the risk group criteria to treat more children on the SR protocol therefore likely afforded some benefit in terms of neurocognitive late effects.
Keywords: acute lymphoblastic leukemia, neuropsychological, risk group, children
INTRODUCTION
With current treatment regimens, upwards of 80% of pediatric patients with acute lymphoblastic leukemia (ALL) are expected to be long-term, event-free survivors. Although toxicities have been significantly reduced in contemporary therapy protocols relative to those seen a decade or two ago, late effects remain a concern. Dana-Farber Cancer Institute (DFCI) Childhood ALL Consortium Protocol 95-01 was designed to minimize therapy-related toxicity without compromising efficacy[1]. It evaluated, in a randomized fashion, strategies to minimize toxicities related to doxorubicin, CNS-directed treatments, and L-asparaginase. Furthermore, risk group criteria were modified to incorporate National Cancer Institute (NCI) age and white blood count (WBC) criteria[2], as a result of which only 45% of patients were classified as high risk compared with 60% on previous protocols.
The 5-year event-free survival (EFS) on Protocol 95-01 was 82% ± 2%, comparable to that of the predecessor protocol (91-01), whose EFS rate was 83% ± 2% [1]. This rate also compared favorably with results for similar groups of unselected patients with ALL treated contemporaneously by other investigators [3-5].
A primary objective of Protocol 95-01 was to reduce neurocognitive sequelae in long-term survivors. For example, Standard Risk (SR) patients were randomized to receive 18 Gy whole brain radiation (CRT) (with two-drug intrathecal (IT) chemotherapy) versus more frequent dosing of IT chemotherapy without CRT as CNS-directed treatment, with the goal of comparing potential neurotoxic outcomes for patients treated on the two arms of the trial.
We have previously reported results from the CRT randomization. There were essentially no differences between patients treated on the two arms of the randomization, although those who received CRT did show some reduction in processing speed [6]. That report did not, however, include High Risk (HR) patients treated on Protocol 95-01. In particular, it did not address potential CNS-related morbidity experienced by these patients, who received more intensive therapy than the SR patients. If there were less neurocognitive morbidity in the SR group, treating more children as SR patients, where prudent, could result in greater sparing in terms of these late effects.
As a follow-up to our earlier report, the present report provides comprehensive data on neuropsychological outcomes for 211 patients treated on Protocol 95-01 at a median follow-up of 5.33 years (range 2.33 to 9.5). Aims of the study were (1) to describe overall outcomes referenced to normative expectations and (2) to compare outcomes for children treated as HR patients to those of SR patients. Because HR patients received more intensive systemic and CNS-directed treatments, we predicted that they would exhibit greater neuropsychological morbidity.
METHODS
Patients
Between January 1996 and September 2000, 498 children (ages 0 to18 years) with newly diagnosed ALL were enrolled on Protocol 95-01[1]. Of these, 7 discontinued protocol treatment, leaving 491 who were evaluable for results of treatment. Two hundred seventy-two patients (55%) were classified as SR. The remaining 219 patients were classified as HR and treated accordingly. Patients were enrolled from the following Consortium institutions: DFCI/Children's Hospital (Boston, MA), Hospital Sainte Justine (Montreal, Quebec), University of Rochester Medical Center (Rochester, NY), McMaster University Medical Center (Hamilton, Ontario), San Jorge Children's Hospital (San Juan, PR), Maine Children's Cancer Program (Portland, Maine), Mount Sinai Medical Center (New York, NY), Le Centre Hospitalier de L'Université Laval (Quebec City, Quebec) and Ochsner Clinic (New Orleans, LA).
Children who had been in continuous complete remission for at least 5 years post-diagnosis were targeted for long-term follow-up of their neuropsychological status, although several children who had been in remission for somewhat briefer periods were included. Two institutions, Mount Sinai Medical Center and Ochsner Clinic, did not participate in the neuropsychological follow-up. The institutional review boards of each participating institution approved the protocol prior to patient enrollment. Written informed consent was obtained from parents or guardians and assent from capable patients. Participants received a $25 gift certificate in recognition of their cooperation.
Figure 1 details reasons for exclusion or non-participation for the 498 patients enrolled on Protocol 95-01. Of the 298 patients who were eligible for this neuropsychological follow-up study, data were obtained for 211 (70.8%). Of these, 60% were treated as SR patients and 40% as HR, consistent with the distribution for the 491 children originally enrolled in Protocol 95-01. Thus, the sample can be viewed as representative.
Figure 1.
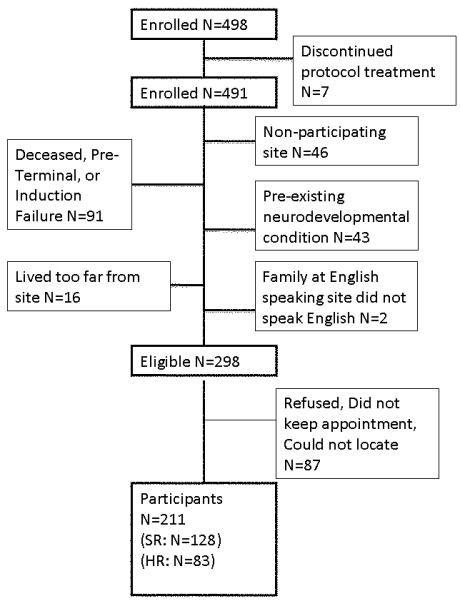
Study sample with reasons for exclusion from neuropsychology outcome study.
Risk Groups
Risk group assignment was determined at the time of diagnosis. Patients assigned to the HR group presented with one or more of the following pretreatment characteristics: 1) WBC > 50,000/microliter, 2) age < 1.00 years or ≥ 10.00 years, 3) presence of lymphoblasts in a cytocentrifuged cerebrospinal fluid (CSF) specimen regardless of CSF WBC count (i.e., CNS-2 or CNS-3), 4) radiographic evidence of a mediastinal mass, and 5) T-cell immunophenotype. Patients with a Philadelphia chromosome [t(9;22)(q34;q11)] were treated as HR patients and received an allogeneic bone marrow transplant during first remission. Such patients were not eligible for this neuropsychology follow-up study. All other patients were classified as SR.
Therapy
Details of the therapy protocol are shown in Table I. CNS therapy commenced during the first cycle of intensification. All patients received 4 doses of either two- or three-drug intrathecal chemotherapy over a 2-week period during CNS therapy. In addition, 1800 cGy CRT was administered to those SR patients randomized to receive radiation and to all HR patients. SR girls between 2 and 9 years of age or with presenting leukocyte counts less than 20,000/mm3 were directly assigned to intensive three-drug IT chemotherapy only because such patients had been treated successfully without CRT on a prior DFCI ALL Consortium protocol[7]. For infants, CRT was delayed until 12 months of age. Therapy was discontinued after 24 months of continuous complete remission for all patients.
Table I.
Therapy for Standard and High Risk patients on DFCI ALL Consortium Protocol 95-01
|
Induction (4 weeks) |
Vincristine 1.5 mg/m2 q week (maximum=2 mg) (days 0,7,14,21) Prednisone 40 mg/m2/day (days 0-28) Doxorubicin 30 mg/m2/dose (days 0 and 1) HR: randomized with/without dexrazoxane 300 mg/m2 days 0 and 1 Methotrexate 4 gm/m2 (8-24 hours after doxorubicin) with leucovorin rescue Asparaginase (randomized Erwinia or E.coli) 25,000 IU/m2 IM × 1 dose (day 4) IT cytarabinea × 1 dose (day 0) TIT* × 1 dose (day 16) |
|
CNS therapy (3 weeks) |
SR: Randomized methotrexate/cytarabine/hydrocortisone IT only or 18 Gy hyperfractionated cranial XRT with IT methotrexate/cytarabine; females between 2 and 9 years or whose highest pretreatment WBC<20,000 direct assigned to three drug IT therapy HR: 18-Gy cranial radiation (randomized hyperfractionated or daily fractions) with IT methotrexate/cytarabine |
|
Intensification (30 weeks) |
Every 3 week cycles: SR: Vincristine 2.0 mg/m2 IV day 1 (maximum=2 mg) Prednisone 40 mg/m2/day orally days 1-5 Methotrexate 30 mg/m2 IV or IM days 1, 8, 15 6MP 50 mg/m2/day orally days 1-15 Asparaginase (randomized): Erwinia 25,000 IU/m2 weekly × 20 weeks Or E.coli 25,000 IU/m2 weekly × 20 weeks HR: same as SR patients, except prednisone dose higher (120 mg/m2/d orally days 1-5), no methotrexate, doxorubicin 30 mg/m2 day 1 of each cycle (cumulative dose of 300 mg/m2), randomized to be given alone or with dexrazoxane 300 mg/m2/dose |
|
Continuation (until 24 months CCR) |
Every 3 week cycles: SR:Same as intensification, except no asparaginase HR: same as SR patients, except dose of prednisone (120 mg/m2/d, days 1-5) |
IT: intrathecal, TIT: triple intrathecal chemotherapy (methotrexate, cytarabine, hydrocortisone), 6MP: 6-mercaptopurine, IV: intravenous, IM: intramuscular, CCR=continuous complete remission
dosed according to age[1]
Features of the protocol that may be relevant to differences in late neurotoxicity between HR and SR patients included (1) high dose methotrexate therapy (4 gm/m2) during induction for HR patients; (2) 18 Gy CRT for all HR patients versus approximately one-third of SR patients; and (3) higher prednisone dose during intensification and continuation phases of therapy for HR patients (120 mg/m2/d) than SR patients (40 mg/m2/day).
Neuropsychological Battery
Neuropsychological testing was performed at a median of 5.3 years after diagnosis (range 2.33 to 9.5 years). Although the range was broad, most children were close to 5 years post-diagnosis at evaluation (10%ile = 4.5 years; 90%ile = 7.1 years). We used a relatively brief neuropsychological battery to enhance reliability and comparability of data across institutions and investigational protocols and to encourage compliance. This approach also facilitated testing for a study sample in which participants spoke English, Spanish or French, with sites in the United States, Puerto Rico, and Quebec.
The neuropsychological battery included five representative subtests of the age-appropriate Wechsler IQ test (WISC-III or WAIS-III) --- Information, Vocabulary, Digit Span, Picture Arrangement, and Block Design [8,9]. The Vocabulary and Block Design dyad can be used to estimate Full Scale IQ; correlation of this dyad with Full Scale IQ is 0.9 [10]. Although the WISC-IV is the current version of the test, it was published after the study was already in progress. Other measures included the Passage Comprehension and Calculation subtests from the Woodcock-Johnson Test of Psychoeducational Abilities, Third Edition (WJ-III)[11], the Verbal and Visual Learning Subtests from the Wide Range Assessment of Memory and Learning (WRAML)[12], and the Rey-Osterrieth Complex Figure (ROCF), scored with the Developmental Scoring System[13]. Two questionnaire measures were administered to parents: the Behavioral Assessment System for Children (BASC), a measure of psychosocial adjustment[14]; and the Behavioral Rating Inventory of Executive Function (BRIEF), a measure of executive functioning in daily life[15].
Adaptations to test materials and instructions were made for the children from Puerto Rico and Quebec, whose primary languages were Spanish and French, respectively. The most recent edition of the Wechsler Scale in their language was used, and the Verbal Learning subtest from the Wide Range Assessment of Memory and Learning (WRAML) was translated into Spanish or French. The Woodcock-Johnson Tests of Achievement Third Edition (WJ-III) Passage Comprehension was administered in the Spanish version or translated to French. The WJ-III Calculation subtest did not require translation, except for the instructions. The Behavioral Assessment System for Children (BASC) questionnaire was administered in the Spanish version and was translated and back-translated to French. The Behavior Rating Inventory of Executive Function (BRIEF) questionnaire was introduced mid-way through the study, shortly after it was first published. It was administered in English and in Spanish translation, but was not translated for the French speakers.
Statistical Methods
Comparisons of observed means to population means were carried out by one-way t-tests and binomial tests. The Rey-Osterrieth variables were treated categorically (less than or greater than 25%ile, except for Errors, which was classified at the 10%ile in keeping with test norms).
Differences between risk groups were evaluated by multiple regression analyses, with Risk Group expressed as a binary variable and adjusting for effects of age at diagnosis, sex, and mother's education. Analyses of the Rey-Osterrieth outcomes, where the scores are not standardized for age, include age at diagnosis as a predictor but not age at testing, since the two are nearly perfectly correlated (r=0.94). The significance of age at diagnosis as a predictor, however, cannot be interpreted for this test because it is not possible to distinguish between the typical relationship of the raw scores to age and potential effects of age at diagnosis. The group difference in prevalence of special education was evaluated by logistic regression with models parallel to the multiple regression models. Data analysis was carried out in PASW Statistics 18. Probability levels less than .05 were deemed significant and there was no correction for multiple comparisons.
RESULTS
Patient Characteristics
Table 2 summarizes characteristics of the participants according to risk group. SR and HR patients differed by age, as expected, because of the criteria for risk group assignment. HR patients were older at diagnosis and testing, and their age range was broader, as this risk group included both young children and adolescents. SR patients, by definition, were less than 10 years old at diagnosis. Sex, primary language, and mother's educational status did not differ by risk group. Approximately a quarter of participants were currently enrolled in special education or receiving tutoring by parent report. The risk groups did not differ in prevalence or intensity of services.
Table II.
Demographic characteristics of sample by risk group
| SR (N=128) |
HR (N=83) |
|
|---|---|---|
| Age (months) at Diagnosis*** Median (Range) |
43 (16-119) |
96 (2-215) |
| N (%) ≤ 36 Months at Diagnosis*** | 40 (31.2) | 17 (20.4) |
| Age (months) at Evaluation*** Median (Range) |
110 (75-208) | 150 (73-304) |
| N (%) Male | 62 (48.4) | 34 (40.9) |
| N (%) CRT*** | 47 (35.6) | 83 (100) |
| Language N (%) | ||
| English | 62 (48.4) | 52 (62.6) |
| Spanish | 11 (8.6) | 7 (8.4) |
| French | 55 (42.9) | 24 (28.9) |
| Mother's Education, N (%) | ||
| Less than high school | 10 (7.8) | 3 (3.6) |
| High school graduate or GED | 30 (23.4) | 26 (31.3) |
| Some college | 20 (15.6) | 11 (13.2) |
| Associates degree | 21 (16.4) | 9 (10.8) |
| College degree | 39 (30.4) | 27 (32.5) |
| Graduate degree | 8 (6.3) | 7 (8.4) |
| Special education, N (%)a | 36 (28.3) | 20 (25.0) |
| Tutoring, N(%)b | 1(2.8) | 0 (0.0) |
| General Education Placement with Some Support, N(%)b | 16 (44.4) | 11(55.0) |
| Special Education Services, N(%)b | 14 (39.0) | 7 (35.0) |
| Special Education Placement, N(%)b | 5 (13.9) | 2 (10.0) |
Total N=207
Percent based on those children who are receiving services
p<.0001
Neuropsychological Outcomes
Comparison to Norms
Table 3 displays neuropsychological test performance and behavioral questionnaire ratings for the two risk groups (not adjusted for covariates). Test scores generally approximated the expected population means. Scores were below normative expectation for the Digit Span subtest for both groups. Both groups also showed significant elevations in the number of individuals with poor performance (<25%ile for organization and accuracy and <10%ile for errors) on the Rey-Osterrieth Complex Figure Test (ROCF).
Table III.
Means (unadjusted) and standard deviations for neuropsychological tests and questionnaires by risk group with probability levels for one-way 2-tailed t-test comparisons relative to population mean
| SR (N=128) |
HR (N=83) |
|
|---|---|---|
| WISC-III (Expected = 10) | Mean (S.D.) | Mean (S.D.) |
| Information | 10.2 (3.3) | 9.9 (2.9) |
| Vocabulary | 10.5 (3.2) | 10.7 (2.7)* |
| Digit Span | 9.2 (3.1)** | 9.0 (3.2)** |
| Picture Arrangement | 10.1 (3.2) | 10.0 (3.5) |
| Block Design | 10.5 (3.2) | 10.1 (3.1) |
| Estimated IQ (Expected = 100) | 102.8 (16.2) | 102.3 (14.2) |
|
| ||
| WJ-III (Expected = 100) | ||
| Calculation | 99.4 (14.0) | 96.7 (19.3) |
| Passage Comprehension | 102.0 (12.9) | 100.3 (15.5) |
|
| ||
| WRAML (Expected = 10) | ||
| Verbal Learning | 12.0 (2.9)*** | 11.4 (2.8)*** |
| Visual Learning*** | 11.1 (2.8) | 9.6 (2.9) |
|
| ||
| ROCF (percent <25%ile) a | ||
| Copy Organization | 50.0*** | 46.9*** |
| Copy Structural Accuracy | 32.0*** | 20.4 |
| Copy Incidental Accuracy | 39.8*** | 39.7*** |
| Copy Errors b | 40.6*** | 50.6*** |
| Recall Organization | 47.6*** | 39.7*** |
| Recall Structural Accuracy | 53.1*** | 55.4*** |
| Recall Incidental Accuracy | 42.9*** | 33.7* |
| Recall Errors b | 32.1*** | 35.0*** |
|
| ||
|
Behavioral Assessment System for Children (BASC) c |
SR (N= 123) | HR (N= 61) |
| Behavioral Symptoms Index | 50.5 (13.0) | 49.6 (12.0) |
| Externalizing | 49.6 (11.5) | 46.9 (9.7)* |
| Internalizing | 50.6 (11.5) | 50.9 (13.4) |
| Attention Problems | 51.9 (11.4) | 51.5 (11.7) |
| Adaptive Skills | 50.9 (10.0) | 50.2 (10.8) |
|
| ||
|
Behavioral Rating Inventory of Executive Function (BRIEF) |
SR (N= 71) | HR (N= 45) |
| Behavioral Regulation Index | 50.3 (14.1) | 53.2 (12.4) |
| Metacognitive Index | 52.1 (14.2) | 53.8 (12.3)* |
| General Executive Composite | 51.6 (14.2) | 53.8 (11.8)* |
Bolded values indicate mean (statistically significant) poorer than expected relative to population norms
Probability levels for binomial test
Percent individuals with score below the 10%ile
Higher score denotes more problems except for Adaptive Skills scale
p < 0.05
p<0.01
p<0.001.
Mean scores for the behavioral questionnaires were very close to expected population means. HR children showed fewer externalizing symptoms (BASC) than normative expectation and more problems with executive functioning (BRIEF). Children in the SR group did not differ from normative expectation on any questionnaire scales.
Risk Group
Table 4 shows results of the multiple regression analyses, including standardized parameter estimates for all predictors, as well as unstandardized parameter estimates for Risk group. In the context of the multivariate models, Risk Group effects favoring the SR group emerged for most of the cognitive measures, with effect sizes that were consistently in the range of one-third standard deviation, small to moderate in magnitude. Children in the SR group had higher scores on estimated IQ, Information, Digit Span and Block Design as well as both academic measures. They also performed better on Visual Learning. There were no risk group-related differences on any of the behavioral rating scales and only one difference on the ROCF, potentially a chance finding. Logistic regression analyses of receipt of special education, adjusted for covariates, revealed no risk group differences.
Table IV.
Results of regression models showing standardized parameter estimates (ß) for all predictors. Unstandardized parameter estimates (B), t-test and probability levels are displayed for Risk, as well as adjusted R2 for full model.
| Age at Diagnosis (Month) |
Maternal Education (Category) |
Sex (Female Baseline) |
Risk (SR Baseline) |
Risk (SR Baseline) |
T | p | Model Adjusted R2 |
|
|---|---|---|---|---|---|---|---|---|
|
| ||||||||
| ß | ß | ß | ß | B | ||||
| WISC/WAIS | ||||||||
|
| ||||||||
| Estimated IQ | 0.261 | 0.343 | −0.032 | −0.149 | −4.684 | −1.992 | <0.05 | 0.119 |
| Information | 0.301 | 0.420 | −0.131 | −0.207 | −1.343 | −2.876 | <0.01 | 0.199 |
| Vocabulary | 0.198 | 0.309 | −0.073 | −0.063 | −0.388 | −0.829 | ns | 0.093 |
| Digit Span | 0.285 | 0.229 | 0.189 | 0.159 | −1.014 | −2.101 | <0.05 | 0.107 |
| Picture Arrangement | 0.202 | 0.244 | −0.044 | −0.133 | −0.894 | −1.711 | ns | 0.057 |
| Block Design | 0.242 | 0.267 | 0.012 | −0.189 | −1.235 | −2.469 | <0.05 | 0.095 |
|
| ||||||||
| WJ-III | ||||||||
|
| ||||||||
| Passage | ||||||||
| Comprehension | 0.270 | 0.128 | 0.142 | −0.18 | −5.145 | −2.337 | <0.05 | 0.065 |
| Calculation | 0.165 | 0.195 | −0.010 | −0.164 | −5.466 | −2.095 | <0.05 | 0.034 |
|
| ||||||||
| WRAML | ||||||||
|
| ||||||||
| Verbal Learning | 0.04 | 0.232 | −0.039 | −0.139 | −0.809 | −1.784 | ns | 0.048 |
| Visual Learning | −0.033 | 0.156 | 0.052 | −0.226 | −1.358 | −2.936 | <0.01 | 0.070 |
|
| ||||||||
| BRIEF (N=116) | ||||||||
|
| ||||||||
| Behavioral | ||||||||
| Regulation | −0.054 | −0.229 | −0.075 | 0.130 | 3.567 | 1.313 | ns | 0.030 |
| Metacognitive | −0.008 | −0.209 | −0.183 | 0.065 | 1.807 | 0.661 | ns | 0.068 |
| General Executive | −0.014 | −0.210 | −0.144 | 0.088 | 2.429 | 0.89 | ns | 0.027 |
|
| ||||||||
| BASC (N=184) | ||||||||
|
| ||||||||
| BSI | 0.005 | −0.232 | −0.080 | −0.012 | −0.333 | −0.159 | ns | 0.037 |
| Externalizing | −0.060 | −0.260 | −0.162 | −0.073 | −1.703 | −0.959 | ns | 0.099 |
| Internalizing | 0.133 | −0.070 | 0.067 | −0.022 | −0.556 | −0.273 | ns | 0.005 |
| Attention | 0.009 | −0.197 | −0.119 | −0.004 | −0.103 | −0.054 | ns | 0.028 |
| Adapt Skills | −0.097 | 0.175 | 0.123 | −0.014 | −0.311 | −0.184 | ns | 0.033 |
|
| ||||||||
| Rey-Osterrieth | ||||||||
|
| ||||||||
| Copy Org | 0.594 | 0.050 | 0.061 | 0.030 | 0.236 | 0.475 | ns | 0.354 |
| Copy Errors | −0.582 | 0.023 | −0.038 | 0.148 | 0.646 | 2.174 | <0.05 | 0.272 |
| Recall Org | 0.491 | 0.023 | 0.080 | 0.028 | 0.221 | 0.398 | ns | 0.243 |
| Recall Errors | −0.266 | −0.102 | −0.034 | 0.091 | 0.373 | 1.157 | ns | 0.038 |
Statistically significant estimates by t-test are italicized; Statistically significant estimates for Risk are also bolded for ease of review; N = 211 unless otherwise indicated.
The standardized parameter estimates provide an indication of the influence of risk group relative to other predictors. In general, the effects of age at diagnosis and maternal education were larger than that of risk group.
Females were more likely to be receiving special education within both risk groups (SR: 39% of females in special education, 16% of males; HR: 32% of females, 15% of males). Exploratory analyses indicated, however, that among those receiving special education, test scores were higher for females for both IQ and academic achievement [Estimated IQ: Mfemale=97.63, SD=16.08, N=41; Mmale=87.80, 12.44, N=15, t(54)=2.14, p<0.05; Reading: Mfemale=93.34, SD=12.96, N=41; Mmale=87.93, 13.76, N=15, t(51)=1.29, ns; Mathematics: Mfemale=91.34, SD=14.67, N=41; Mmale=85.27, 18.06, N=15, t(51)=1.36, ns]. Although the difference in achievement scores did not reach an acceptable level of statistical significance, these findings suggest that the sex difference in receipt of special education reflects bias in referral for services rather than severity of outcome.
DISCUSSION
This study reports neuropsychological outcomes for a large cohort of children treated for childhood acute lymphoblastic leukemia on DFCI ALL Consortium Protocol 95-01 as standard or high risk patients. The study had two main findings. First, performance on most, but not all, neuropsychological measures approximated normative expectations for the population at large for children in both risk groups. Decreased performance was documented only for measures of verbal working memory and the capacity to manage complex, novel visuospatial material (ROCF), and these were comparable across risk groups. Second, there were consistent and statistically significant differences between children treated as Standard and High Risk patients in performance on measures of cognitive functioning. The magnitude of these differences, however, was only in the small to moderate range. These effects, moreover, were generally smaller in magnitude than the effects of age at diagnosis and maternal education. Since there was no risk group difference in receipt of special education services, the differences we detected in cognitive outcomes may not be of great functional consequence.
Performance Relative to Norms
These findings are entirely consistent with findings from prior DFCI protocols, which similarly documented basic skill levels that approximated the expected population mean, with a relative weakness in verbal working memory, and a higher proportion with deficient performance on the complex figure task [16,17]. This consistency across protocols is striking; the pattern of deficits has been remarkably stable across protocols for the past 15 years, despite changes in therapy regimens. The same pattern of deficits emerged for children in both risk groups and were of comparable magnitude.
A report from St. Jude Children's Research Hospital, based on children treated without CRT, similarly indicated that overall skill levels approximated the population mean, with specific deficits in working memory [18]. Deficits on both the Digit Span and the ROCF tasks, as well as the BRIEF Metacognitive Index, are known to be associated with learning disorders in the general population [19-22]. Moreover, working memory is thought to be foundational to overall IQ level in both ALL survivors[23] and healthy children [24].
Our findings are notable as well because cranial irradiation has been more frequently used in the DFCI protocols than in those of other contemporary collaborative groups. Since so many studies have documented more significant impairment for children who receive CRT [25-27], with mean IQ scores generally approximating 90, the relatively milder effects observed for Protocol 95-01 and its predecessor protocols, for which the great majority of children received 18 Gy cranial radiation, is noteworthy. Indeed, as noted in the introduction, the randomized trial embedded in DFCI Protocol 95-01 revealed minimal neurocognitive differences between children randomized to CNS treatment with CRT or three-drug IT therapy [6]. The apparent neuropsychological sparing in the present sample, despite treatment with CRT, is encouraging.
We also obtained parent reports of behavioral outcomes. These parent reports documented no elevations in problems related to psychosocial adjustment. The HR group showed an elevation in problems in executive functioning, but there were no differences between the risk groups when the outcomes were adjusted for covariates.
About a quarter of the children were enrolled in special education, approximately double the estimated rate of 13.4% in the U.S.[28]. This elevation was largely accounted for by girls. Paradoxically, however, girls who were receiving special education services exhibited stronger IQ and to some extent academic achievement than boys receiving special education, suggesting that the observed difference reflects referral bias and not greater impairment among girls, consistent with the neuropsychological findings, which revealed few and inconsistent sex differences. The basis for such a potential referral bias, however, cannot be ascertained from our data.
Risk Group
Neuropsychological outcomes differed consistently but only moderately in terms of the magnitude of the differences between risk groups. A number of the differences that emerged appeared to involve memory, including working memory, contextualized memory for factual information, and visual learning. Performance on measures of academic achievement also differed between the groups, potentially related to the memory differences. We have reported elsewhere risk group related differences for the Digit Span subtest [29], a measure of verbal working memory, as did the study from St. Jude's Children's Research Hospital alluded to above [18]. The present findings constitute a further replication. We previously suggested that these differences could be related to different intensities of steroid therapy for Standard and High Risk patients [29], since glucocorticoid steroids have been associated with memory function[30], including working memory [31].
In any event, the magnitude of the differences that did emerge was only moderate. The unstandardized parameter estimates indicated differences in the neighborhood of one-third standard deviation, potentially clinically meaningful but by no means dramatic. Moreover, comparison of the standardized parameter estimates for risk with those for other predictors, in particular age at diagnosis and maternal education, indicated that the latter are more potent predictors than risk group.
Limitations
The most important potential limitation of this study is the inherent confounding of risk group with age at diagnosis in the design of the treatment protocol. Because of the criteria for risk group assignment, children in the High Risk group were on average older at diagnosis. Given this association and the association between age at diagnosis and outcome, it was not possible to account for independent effects of risk group and age at diagnosis with complete certainty. Nevertheless, older age at diagnosis consistently predicted better performance whereas membership in the High Risk group, who were on average older, predicted poorer performance, suggesting that the differences we detected do not reflect the confounding of risk group and age at diagnosis in the design.
Another concern is the validity of evaluating these outcomes against population norms rather than a control group. If our sample were biased toward higher socioeconomic status families, we could underestimate the impact of the disease and its therapy. The socioeconomic characteristics of our sample as indexed by maternal education, however, were well distributed across the range; 33% of mothers had a high school education or less and 38% had a college degree or higher. Thus, our sample is not likely to be substantially different socioeconomically from the norming samples.
In conclusion, children treated as standard risk patients achieved better neurocognitive outcomes than those in the high risk group, but the magnitude of the differences was only in the small to moderate range. Modification of the risk group criteria, which had the effect of decreasing the proportion of children on DFCI Protocol 95-01 who were treated on the more intensive HR regimen, thus would have resulted in some sparing in terms of neuropsychological outcomes. The impact would not have been dramatic, however, and outcomes among the HR group appear to be generally favorable, despite this risk group difference.
Recent evaluations of randomized controlled trials have yielded scant evidence of treatment-related effects. These include comparisons of CRT versus triple IT drug [6], standard fraction versus hyperfractionated CRT [17], IT-MTX versus triple IT drug [32] and prednisone versus dexamethasone as steroid therapy [33]. The risk group related effects reported here, while statistically and potentially functionally significant, were nevertheless of less consequence than those related to child characteristics, specifically age at diagnosis and mother's education. In the contemporary era of therapy, prevention strategies may need to focus on identification and potential amelioration of child-related risks for adverse outcomes as much as on the treatments themselves. Investigations of genetic factors that could heighten risk for neurotoxicity could also prove to be an important step in this direction [34,35].
Acknowledgements
Supported by Grant 2 P01 CA 68484 from the National Cancer Institute, the Michael J. Garil Fund for Leukemia Research and in part by Mental Retardation Center grant P30-HD18655.
Footnotes
Conflict of Interest Statement
There are no conflicts of interest to disclose.
REFERENCES
- 1.Moghrabi A, Levy DE, Asselin B, et al. Results of the Dana-Farber Cancer Institute ALL Consortium Protocol 95-01 for Children with Acute Lymphoblastic Leukemia. Blood. 2007;109(3):896–904. doi: 10.1182/blood-2006-06-027714. [DOI] [PMC free article] [PubMed] [Google Scholar]
- 2.Smith M, Bleyer A, Crist W, et al. Uniform criteria for childhood acute lymphoblastic leukemia risk classification. Journal Of Clinical Oncology. 1996;14(2):680–681. doi: 10.1200/JCO.1996.14.2.680. [DOI] [PubMed] [Google Scholar]
- 3.Kamps WA, Bökkerink JPM, Hakvoort-Cammel FGAJ, et al. BFM-oriented treatment for children with acute lymphoblastic leukemia without cranial irradiation and treatment reduction for standard risk patients: results of DCLSG protocol ALL-8 (1991-1996) Leukemia. 2002;16(6):1099–1111. doi: 10.1038/sj.leu.2402489. [DOI] [PubMed] [Google Scholar]
- 4.Schrappe M, Reiter A, Ludwig WD, et al. Improved outcome in childhood acute lymphoblastic leukemia despite reduced use of anthracyclines and cranial radiotherapy: results of trial ALL-BFM 90. German-Austrian-Swiss ALL-BFM Study Group. Blood. 2000;95(11):3310–3322. [PubMed] [Google Scholar]
- 5.Pui CH, Boyett JM, Rivera GK, et al. Long-term results of Total Therapy studies 11, 12 and 13A for childhood acute lymphoblastic leukemia at St Jude Children's Research Hospital. Leukemia. 2000;14(12):2286–2294. doi: 10.1038/sj.leu.2401938. [DOI] [PubMed] [Google Scholar]
- 6.Waber DP, Turek J, Catania L, et al. Neuropsychological outcomes from a randomized trial of triple intrathecal chemotherapy compared with 18 Gy cranial radiation as CNS treatment in acute lymphoblastic leukemia: findings from Dana-Farber Cancer Institute ALL Consortium Protocol 95-01. J Clin Oncol. 2007;25(31):4914–4921. doi: 10.1200/JCO.2007.10.8464. [DOI] [PubMed] [Google Scholar]
- 7.Silverman LB, Gelber RD, Dalton VK, et al. Improved outcome for children with acute lymphoblastic leukemia: results of Dana-Farber Consortium Protocol 91-01. Blood. 2001;97(5):1211–1218. doi: 10.1182/blood.v97.5.1211. [DOI] [PubMed] [Google Scholar]
- 8.Wechsler D. Wechsler Intelligence Scale for Children. Third Edition Psychological Corporation; New York: 1991. [Google Scholar]
- 9.Wechsler D. Wechsler Adult Intelligence Scale. Third Edition The Psychological Corporation; San Antonio, TX: 1997. [Google Scholar]
- 10.Sattler JM. Assessment of Children's Intelligence. WB Saunders; Philadelphia: 1974. [Google Scholar]
- 11.Woodcock RW, McGrew KS, Mather N. Woodcock-Johnson III. Riverside Publishing; Itasca, IL: 2001. [Google Scholar]
- 12.Sheslow D, W A. Wide Range Assessment of Memory and Learning. Wide Range Inc.; Wilmington, Delaware: 1990. [Google Scholar]
- 13.Bernstein JH, W D. Developmental Scoring System for the Rey-Osterrieth Complex Figure. Psychological Assessment Resources; Odessa, FL: 1996. [Google Scholar]
- 14.Reynolds C, Kamphaus R. BASC: Behavioral Assessment System for Children. American Guidance Service; Circle Pines, MN: 1992. [Google Scholar]
- 15.Gioia GA, Isquith PK, Guy SC, et al. Behavior Rating Inventory of Executive Function. Psychoogical Assessment Resources; Odessa, FL: 2000. [Google Scholar]
- 16.Waber DP, Shapiro BL, Carpentieri SC, et al. Excellent therapeutic efficacy and minimal late neurotoxicity in children treated with 18 grays of cranial radiation therapy for high-risk acute lymphoblastic leukemia: a 7-year follow-up study of the Dana-Farber Cancer Institute Consortium Protocol 87-01. Cancer. 2001;92(1):15–22. doi: 10.1002/1097-0142(20010701)92:1<15::aid-cncr1286>3.0.co;2-w. [DOI] [PubMed] [Google Scholar]
- 17.Waber DP, Silverman LB, Catania L, et al. Outcomes of a randomized trial of hyperfractonated cranial radiation therapy (18 Gy) for treatment of high-risk acute lymphoblastic leukemia: Therapeutic efficacy and neurotoxicity. Journal of Clinical Oncology. 2004;22(13):2701–2707. doi: 10.1200/JCO.2004.10.173. [DOI] [PubMed] [Google Scholar]
- 18.Ashford J, Schoffstall C, Reddick WE, et al. Attention and working memory abilities in children treated for acute lymphoblastic leukemia. Cancer. 2010;116(19):4638–4645. doi: 10.1002/cncr.25343. [DOI] [PMC free article] [PubMed] [Google Scholar]
- 19.Swanson HL, Jerman O. Math Disabilities: A Selective Meta-Analysis of the Literature. Review of Educational Research. 2006;76(2):249–274. [Google Scholar]
- 20.Vukovic RK, Siegel L, Alloway TP, et al. Working memory and neurodevelopmental disorders. Psychology Press; New York, NY US: 2006. The role of working memory in specific reading comprehension difficulties; pp. 89–112. [Google Scholar]
- 21.Willcutt EG, Pennington BF, Olson RK, et al. Neuropsychological Analyses of Comorbidity Between Reading Disability and Attention Deficit Hyperactivity Disorder: In Search of the Common Deficit. Developmental Neuropsychology. 2005;27(1):35–78. doi: 10.1207/s15326942dn2701_3. [DOI] [PubMed] [Google Scholar]
- 22.Waber DP, Bernstein JH. Performance of learning-disabled and non-learning-disabled children on the Rey-Osterrieth Complex Figure (ROCF): Validation of the developmental scoring system. Developmental Neuropsychology. 1995;11(2):237–252. [Google Scholar]
- 23.Schatz J, Kramer JH, Ablin A, et al. Processing speed, working memory, and IQ: a developmental model of cognitive deficits following cranial radiation therapy. Neuropsychology. 2000;14(2):189–200. doi: 10.1037//0894-4105.14.2.189. [DOI] [PubMed] [Google Scholar]
- 24.Fry AF, Hale S. Processing speed, working memory, and fluid intelligence: Evidence for a developmental cascade. Psychological Science. 1996;7(4):237–241. [Google Scholar]
- 25.Spiegler BJ, Kennedy K, Maze R, et al. Comparison of long-term neurocognitive outcomes in young children with acute lymphoblastic leukemia treated with cranial radiation or high-dose or very high-dose intravenous methotrexate. J Clin Oncol. 2006;24(24):3858–3864. doi: 10.1200/JCO.2006.05.9055. [DOI] [PubMed] [Google Scholar]
- 26.Raymond-Speden E, Tripp G, Lawrence B, et al. Intellectual, neuropsychological, and academic functioning in long-term survivors of leukemia. Journal of Pediatric Psychology. 2000;25(2):59–68. doi: 10.1093/jpepsy/25.2.59. [DOI] [PubMed] [Google Scholar]
- 27.Anderson VA, Godber T, Smibert E, et al. Cognitive and academic outcome following cranial irradiation and chemotherapy in children: a longitudinal study. British Journal of Cancer. 2000;82:255–262. doi: 10.1054/bjoc.1999.0912. [DOI] [PMC free article] [PubMed] [Google Scholar]
- 28.Institute of Educational Sciences . In: Digest of Educational Statistics: 2009. Education, editor. Washington, DC: 2009. [Google Scholar]
- 29.Waber DP, Tarbell NJ, Fairclough D, et al. Cognitive sequelae of treatment in childhood acute lymphoblastic leukemia: cranial radiation requires an accomplice. Journal of Clinical Oncology. 1995;13(10):2490–2496. doi: 10.1200/JCO.1995.13.10.2490. [DOI] [PubMed] [Google Scholar]
- 30.Newcomer JW, Craft S, Hershey T, et al. Glucocorticoid-induced impairment in declarative memory performance in adult humans. Journal of Neuroscience. 1994;14(4):2047–2053. doi: 10.1523/JNEUROSCI.14-04-02047.1994. [DOI] [PMC free article] [PubMed] [Google Scholar]
- 31.Lupien SJ, Gillin CJ, Hauger RL. Working memory is more sensitive than declarative memory to the acute effects of corticosteroids: A dose-response study in humans. Behavioral Neuroscience. 1999;113(3):420–430. doi: 10.1037//0735-7044.113.3.420. [DOI] [PubMed] [Google Scholar]
- 32.Kadan-Lottick NS, Brouwers P, Breiger D, et al. Comparison of neurocognitive functioning in children previously randomly assigned to intrathecal methotrexate compared with triple intrathecal therapy for the treatment of childhood acute lymphoblastic leukemia. Journal Of Clinical Oncology. 2009;27(35):5986–5992. doi: 10.1200/JCO.2009.23.5408. [DOI] [PMC free article] [PubMed] [Google Scholar]
- 33.Kadan-Lottick NS, Brouwers P, Breiger D, et al. A comparison of neurocognitive functioning in children previously randomized to dexamethasone or prednisone in the treatment of childhood acute lymphoblastic leukemia. Blood. 2009;114(9):1746–1752. doi: 10.1182/blood-2008-12-186502. [DOI] [PMC free article] [PubMed] [Google Scholar]
- 34.Krajinovic M, Robaey P, Chiasson S, et al. Polymorphisms of genes controlling homocysteine levels and IQ score following the treatment for childhood ALL. Pharmacogenomics. 2005;6(3):293–302. doi: 10.1517/14622416.6.3.293. [DOI] [PubMed] [Google Scholar]
- 35.Krull KR, Brouwers P, Jain N, et al. Folate pathway genetic polymorphisms are related to attention disorders in childhood leukemia survivors. Journal Of Pediatrics. 2008;152(1):101–105. doi: 10.1016/j.jpeds.2007.05.047. [DOI] [PubMed] [Google Scholar]