

Abstract
Objective
The present study investigated the neural mechanisms of voice pitch control for different levels of harmonic complexity in the auditory feedback.
Methods
Event-related potentials (ERPs) were recorded in response to +200 cents pitch perturbations in the auditory feedback of self-produced natural human vocalizations, complex and pure tone stimuli during active vocalization and passive listening conditions.
Results
During active vocal production, ERP amplitudes were largest in response to pitch shifts in the natural voice, moderately large for non-voice complex stimuli and smallest for the pure tones. However, during passive listening, neural responses were equally large for pitch shifts in voice and non-voice complex stimuli but still larger than that for pure tones.
Conclusions
These findings suggest that pitch change detection is facilitated for spectrally rich sounds such as natural human voice and non-voice complex stimuli compared with pure tones. Vocalization-induced increase in neural responses for voice feedback suggests that sensory processing of naturally-produced complex sounds such as human voice is enhanced by means of motor-driven mechanisms (e.g. efference copies) during vocal production.
Significance
This enhancement may enable the audio-vocal system to more effectively detect and correct for vocal errors in the feedback of natural human vocalizations to maintain an intended vocal output for speaking.
Keywords: Self-Vocalization, Internal Forward Model, Efference Copies, Acoustical Complexity, Pitch Shift Stimulus, Event-Related Potentials (ERPs)
Introduction
Auditory feedback is critically involved in learning and production of speech sounds, along with online monitoring and control of vocal output for maintaining verbal fluency during speaking. It has been well established by previous studies that perturbations in voice auditory feedback induce disruptive effects on the quality of produced speech. Auditory feedback deprivation in post-lingual deaf individuals has been reported to result in progressive deterioration of speech quality and intelligibility (Cowie and Douglas-Cowie, 1983). Moreover, introducing delays in online voice feedback disrupts speech articulation in normal individuals while considerably reducing stuttering in a population of developmental stutterers (Chase et al., 1961, Kalinowski et al., 1993). In addition, more recent studies have suggested that dysfunctions in production and processing of self-generated voices may lead to abnormal vocal reactions to perturbation in acoustical parameters of auditory feedback in patients with Parkinson’s disease (Kiran and Larson, 2001) and children with autism spectrum disorders (Russo et al., 2008).
A practical approach for studying the mechanisms of audio-vocal integration for voice production and control is to examine vocal and neural responses to artificially-generated perturbations in voice auditory feedback. Studies on vocal responses to shifts in the pitch of voice feedback have demonstrated that human subjects automatically change their voice fundamental frequency (F0, perceived as pitch) in the opposite direction of pitch-shift stimuli (Bauer et al., 2006, Burnett et al., 1998, Chen et al., 2007, Donath et al., 2002, Hain et al., 2000, Jones and Munhall, 2000, Kawahara and Aikawa, 1996, Larson et al., 2007, Natke et al., 2002, Xu et al., 2004). Similarly, shifting formant frequencies of feedback has been shown to elicit compensatory adjustments of voice formants during speech (Houde and Jordan, 1998, Munhall et al., 2009, Purcell and Munhall, 2006). The compensatory nature of these vocal reactions led to the suggestion that the audio-vocal mechanism operates like a negative feedback control system for maintaining the acoustical structure of an intended vocal output.
The first step toward understanding such a feedback-based controlling system is to study the neural mechanisms related to the processing of the auditory feedback perturbation during vocalization or speaking. One proposed mechanism for the detection of changes in auditory feedback is to compare forthcoming sounds with a predicted sensory representation based on rules that are automatically extracted from the recent auditory environment (Winkler et al., 2009). The mismatch negativity (MMN) component of the event-related potentials (ERPs) has been suggested as a neural index of change detection when an actual auditory stimulus does not match (e.g. in frequency, intensity, duration or other parameters) the predicted auditory input in a classical oddball paradigm (for a review see (Naatanen et al., 2010)).
Recent studies have shown that neural responses elicited by changes in the pitch frequency of self-produced voice (Behroozmand et al., 2009a, Eliades and Wang, 2008, Liu et al., 2010) and musical sounds (Maidhof et al., 2010a) are enhanced when subjects actively produced them compared with when they passively listened to their playback. These findings suggested that motor-driven mechanisms can enhance change detection by comparing the incoming auditory feedback with an internal representation of the predicted input established by efference copies (Sperry, 1950, von Helmholtz, 1867, von Holst, 1954) of motor commands. The internal forward model theory (Decety, 1996, Jeannerod, 1988, Wolpert, 1997, Wolpert et al., 1995) suggests that during active vocal production, the efference copies cue an internal forward model (predictor) to provide an internal representation of the expected sensory feedback in a top-down manner. By means of comparing the predicted (efference copies) and actual sensory input, change detection in the feedback of self-produced motor actions can be facilitated. The motor-driven predictions have been suggested to account for motor-induced suppression of auditory (Heinks-Maldonado et al., 2005, Heinks-Maldonado et al., 2006, Houde et al., 2002) and somatosensory (Blakemore et al., 1998a, Blakemore et al., 2000, Blakemore et al., 1998b) neural responses to unaltered feedback of self-produced motor actions.
An important factor in understanding the audio-vocal integration mechanisms is to investigate how changes in different spectral components of voice feedback are processed and used to compensate for vocal errors during speaking. Previous studies on the mechanisms of voice pitch control have examined neural and vocal responses to a pitch shift stimulus (PSS) that altered voice F0 and all harmonics in the auditory feedback. However, it is not known which specific frequency components of a complex acoustical stimulus such as human voice are most important for vocal motor control. Evidence from previous studies has suggested that detecting frequency variation in spectrally rich complex tones is enhanced compared with the same frequency variation in a pure sinusoidal tone. This effect has been explained by the fact that complex sounds carry more spectral cues for the auditory system compared with pure tone stimuli (Tervaniemi et al., 2000a, Tervaniemi et al., 2000b). Moreover, because humans develop speech and other vocal sounds in the constant environment of monitoring their own voice, we hypothesized that the auditory system would be most sensitive to the acoustical complexity of naturally-produced voice feedback compared with non-vocal complex or pure tone stimuli.
The present study tested this hypothesis by recording auditory neural responses to pitch perturbations in the feedback of naturally-produced human vocalizations, non-vocal complex and pure tone stimuli. During vocalization of the vowel sound /a/, subjects’ voice F0 was extracted by an online pitch tracker and used to generate an artificial pure tone (at voice F0) or a complex tone (F0 and its harmonics). This method insured that the generated complex and pure tones matched the pitch frequency of subject’s own voice. During vocalization, subjects were randomly presented with the feedback of their own naturally-produced voice or artificially-generated complex and pure tone stimuli and ERP and vocal responses were recorded to brief upward pitch perturbations (+200 cents magnitude, 200 ms duration) in voice, complex and pure tone feedback. In a control condition, subjects also passively listened to the playback of pitch-shifted voice, complex or pure tone feedback. The comparison of responses during active vocalization and passive listening conditions allowed us to investigate the sensory-motor mechanisms of auditory feedback processing for vocal pitch control.
Materials and Methods
Subjects
Twelve right-handed native speakers of American English (6 females and 6 males, 20–30 years of age, mean: 23 years std: 3.72) participated in this study. All subjects passed a bilateral pure-tone hearing screening test at 20 dB sound pressure level (SPL) (octave frequencies between 250–8000 Hz) and reported no history of neurological disorders, voice or musical training. All study procedures, including recruitment, data acquisition and informed consent were approved by the Northwestern University institutional review board, and subjects were monetarily compensated for their participation.
Experimental design
The experiment consisted of two blocks of active vocalization and two blocks of passive listening to the playback. Each active vocalization block was followed by one block of passive listening to the playback of the same pitch-shifted feedback during the previous vocalization. During active vocalization, subjects were asked to sustain the vowel sound /a/ for approximately 4–5 seconds at their conversational pitch and loudness. This vocal task was repeated 125 times during each vocalization block while subjects took short breaks (2–3 seconds) between successive utterances. During each vocalization trial, subjects were presented with one of the randomly chosen types of auditory feedback, including their own voice, a pure sinusoidal tone at the fundamental frequency of their own voice (sine wave at F0) or complex tones that consisted of sinusoids with F0 and its first harmonic frequency (F0 +H1), F0 with its first and second harmonic frequencies (F0 +H1+H2) or F0 with its first, second and third harmonic frequencies (F0 +H1+H2+H3) (see figure1). The F0 and its harmonics for the complex tones had equal amplitudes and the relative phase difference between them was zero. The intensities of voice, complex and pure tone feedback were calibrated at about 80 dB SPL. The test sounds along with their frequency spectra are presented in figure2. During each vocalization trial the voice or tone feedback was shifted in pitch (upward by +200 cents magnitude with 200 ms duration) three times with the first one occurring at 500–1000 ms after vocal onset and the next two with inter-stimulus intervals randomized between 1000–1500 ms. Each active vocalization block was immediately followed by a passive listening block during which subjects passively listened to the playback of the same pitch shifts in the auditory feedback of their own voice, complex or simple tones. The total duration of each block was approximately 10–15 minutes.
Figure 1.

Schematic of the experimental setup. ERPs were obtained in response to +200 cents pitch shift stimulus (PSS) in a randomly chosen auditory feedback including subject’s own voice, non-voice complex (F0+H1, F0+H1+H2, F0+H1+H2+H3) or pure tone (F0) stimuli. In order to generate the non-voice stimuli, subject’s voice signal was fed to a Kay Visipitch for online pitch extraction and the analog F0 output was used to drive four oscillators that generated sinusoidal tones at voice F0 and its first (H1), second (H2) and third (H3) harmonic frequencies. The voice signal was also fed to a voice onset detector (VOD) module that was used to cue the pitch shifter to deliver PSS after a randomly chosen time delay (Δt) between 500–1000 ms following vocal onset. The figure illustrates an example of a condition where a pure sinusoidal tone at F0 is randomly chosen as voice feedback during vocalization of the vowel sound /a/.
Figure 2.

The frequency spectra of voice, complex (F0+H1, F0+H1+H2, F0+H1+H2+H3) and pure tone (F0) auditory feedback during 1 second vocalization of the vowel sound /a/ in a subject with a conversational F0 at about 175 Hz. The onset and offset of pitch-shift stimulus (PSS) is marked and the frequency ranges are shown for up to 2 KHz in each plot. The duration of PSS was 200 ms. A sample waveform of the auditory feedback in different conditions is shown on the top of each plot for a 50 ms window ranging from 150 to 200 ms after vocalization onset (dashed area).
Instrumentation
Subjects were seated in a sound-treated room in which their voice was picked up with an AKG boomset microphone (model C420). A Mackie mixer (model 1202-VLZ3) was used to amplify and split the subjects’ voice signal between three separate channels (figure1). The first channel was fed to a Kay Visipitch module (Kay Elemetrics, Model 6095/6097) to track voice F0 online by generating a DC signal that was proportional to voice F0 (analog F0). We tested the analog F0 signal and confirmed that the Kay Visipitch output was linear (6 mV/Hz) over the range of human voice F0 (75–500 Hz). The analog F0 signal was read by the Max/Msp program (v.5.0, Cycling 74) and used to control the output frequency of four oscillators through voltage-controlled gates. Oscillators one to four were set to generate sinusoidal tones at F0, 2×F0 (H1), 3×F0 (H2) and 4×F0 (H3) frequencies, respectively. Prior to the onset of vocalizations, a random generator function was used to generate a random number between 1 and 5. For number 1, the Max/Msp program chose the subject’s own voice (Mackie’s second channel output) as the auditory feedback. For numbers 2 to 5, Max/Msp combined oscillator outputs and modified voice auditory feedback with a pure tone at F0 or complex tones The containing F0 +H1, F0 +H1+H2 and F0 +H1+H2+H3 frequencies, respectively. Max/Msp routine also used this randomly generated number to adjust the output gain of the Eventide harmonizer so that feedback loudness was nearly the same for voice, complex and pure tone stimuli. At conversational F0, subjects maintained their vocalizations at a loudness of about 70 dB SPL, and the feedback (voice, pure or complex tones) was delivered through Etymotic earphones (model ER1-14A) at about 80 dB SPL. The 10 dB gain between voice and feedback channels was used to partially mask air-born and bone-conducted voice feedback. A Brüel & Kjær sound level meter (model 2250) along with a Brüel & Kjær prepolarized free-field microphone (model 4189) and a Zwislocki coupler were used to calibrate the gain between voice and feedback channels.
The voice signal from the Mackie’s third output channel was fed to a voice onset detector (VOD) module implemented in Max/Msp to detect vocal onset (figure1). At the onset of each vocalization, one of the five randomly chosen stimuli (voice, F0, F0 +H1, F0 +H1+H2 or F0 +H1+H2+H3) was delivered to the subject and three pitch shift stimuli (200 cents magnitude and 200 ms duration) were delivered to the corresponding auditory feedback using an Eventide Eclipse Harmonizer. All parameters of the pitch shift stimulus such as time delay from vocal onset, inter-stimulus intervals (ISI), duration, direction and magnitude were controlled by the Max/MSP software. The Max/Msp software also generated a TTL (transistor-transistor logic) pulse to mark the onset of each PSS for synchronized averaging of the recorded brain activity and vocal responses. Voice, feedback and TTL pulses were sampled at 10 kHz using Power Lab A/D Converter (Model ML880, AD Instruments) and recorded on a laboratory computer utilizing Chart software (AD Instruments).
Following the active vocalization block, the recorded feedback channel was converted to a sound file to be played back during the passive listening condition. Two objective and one subjective method were used to calibrate the gain during the passive listening condition with respect to active vocalization. The objective methods included using the Brüel & Kjær sound level meter (model 2250) and a Zwislocki coupler to ensure the sound pressure level (dB-SPL) in the output of the insert earphones during passive listening was nearly identical to the earphone output level during vocalization. Furthermore, since the feedback channel was recorded on Chart recorder software during vocalization and listening, we verified that the voltage driving the earphones was identical during both conditions. Lastly, we asked subjects to verify that the sound intensity during vocalization and listening conditions was nearly identical.
ERP acquisition and analysis
The electroencephalogram (EEG) signals were recorded from 32 sites on the subject’s scalp using an Ag-AgCl electrode cap (EasyCap GmbH, Germany) following the extended international 10–20 system (Oostenveld and Praamstra, 2001) including left and right mastoids. Recordings were made using the average reference montage in which outputs of all of the amplifiers are summed and averaged, and this averaged signal is used as the common reference for each channel. Scalp-recorded brain potentials were low-pass filtered with a 400 Hz cut-off frequency (anti-aliasing filter) and then digitized at 2 KHz and recorded using a Brain Vision QuickAmp amplifier (Brain Products GmbH, Germany) on a computer utilizing BrainVision Recorder software (Brain Products GmbH, Germany). Electrode impedances were kept below 5 k• for all channels. The electro-oculogram (EOG) signals were recorded using two pairs of bipolar electrodes placed above and below the right eye and on the lateral can thus of each eye to monitor vertical and horizontal eye movements.
The BrainVision Analyzer 2 software was used to analyze recorded EEG signals in order to calculate ERPs in response to PSS for different feedback complexities (voice, simple tone or complex tones) during active vocalization and passive listening conditions. The recorded EEG was filtered offline using a band-pass filter with cut-off frequencies set to 1 and 30 Hz (−24dB/oct) and then segmented into epochs ranging from −100 ms before and 500 ms after the onset of the PSS. Following segmentation, artifact rejection was carried out by excluding epochs with EEG or EOG amplitudes exceeding +/−50 μV. Individual epochs were then subjected to baseline correction by removing the mean amplitude of the 100 ms-long pre-stimulus time window for each individual EEG channel. A minimum number of 100 epochs was averaged for each condition. The data were grand averaged over 12 subjects for each condition separately. For each subject, the latency and amplitude of the N1 and P2 ERP components were extracted by finding the most prominent negative and positive peaks in 50 ms-long time windows centered at 120 and 230 ms, respectively. These time windows were selected based upon visual inspection of the grand averaged responses.
Voice response analysis
The pitch frequency of the recorded voice signals was extracted in Praat (Boersma, 2001) using an autocorrelation method and then exported to MATLAB (Mathworks, Inc.) for further processing. The extracted pitch frequencies were then converted from Hertz to are the pre-Cents scale using the formula: Cents = 1200×Log2(F2/F1) in which F1 and F2 stimulus and post-stimulus pitch frequencies. The extracted pitch contours were segmented into epochs ranging from −100 ms pre- and +500 ms post-stimulus time intervals and averaged separately for different feedback complexities in each subject. The magnitude and latency of vocal responses were calculated by finding the most prominent peak in 150 ms-long time windows centered at 250 ms.
Results
Neural Responses
N1 component
SPSS software (v.16.0) was used to perform a three-way (5×2×5) repeated-measures analysis of variance (Rm-ANOVA) to examine the main effect of stimulus complexity (F0, F0+H1, F0+H1+H2, F0+H1+H2+H3 and Voice), condition (active vocalization and passive listening) and frontality factors along with their interactions on the amplitude and latency of the N1 components. The frontality factor was used to determine anterior-posterior distribution of ERPs across different conditions by grouping 15 electrodes into five groups of three electrodes each: frontal (F3-Fz-F4), fronto-central (FC3-FCz-FC4), central (C3-Cz-C4), centro-parietal (CP3-CPz-CP4) and parietal (P3-Pz-P4). Results of the analysis for N1 amplitude revealed a significant main effect of stimulus complexity (F(4,44)=5.98, p<0.05) and frontality (F(4,44)=7.44, p<0.001) along with stimulus complexity×condition (F(4,44)=5.42, p<0.05) and condition× frontality (F(4,44)=7.62, p<0.001) interactions.
To further investigate the stimulus complexity×condition interaction, N1 amplitudes were analyzed for active vocalization and passive listening conditions separately using one-way Rm-ANOVAs with the stimulus complexity factor. For active vocalization, results revealed significant main effects of stimulus complexity (F(4,44)=8.78, p<0.001). Post-hoc tests using Bonferroni’s adjustment revealed that during vocalization, the amplitude of N1 responses to mid-utterance pitch shifts was significantly larger (more negative) for voice compared with F0 (p<0.05), F0+H1 (p<0.001), F0+H1+H2 (p<0.05) and F0+H1+H2+H3 (p<0.05) feedback (see figure3). No significant effect of stimulus complexity was found for N1 responses during the passive listening condition. Furthermore, a one-way Rm-ANOVA for different stimulus complexities with the condition factor revealed a significant main effect of condition (F(1,11)=8.4, p<0.05) only for voice feedback, indicating that the amplitude of N1 responses to pitch shifts in voice feedback was larger (more negative) during active vocalization compared with passive listening (see lower bar plots in figure4).
Figure 3.
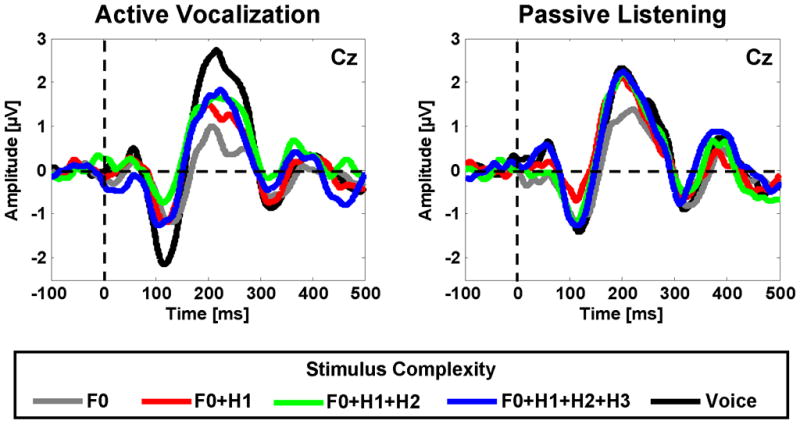
Time course of the neural responses to pitch shifts in voice and non voice complex (F0+H1, F0+H1+H2, F0+H1+H2+H3) and pure tone (F0) auditory stimuli during active vocalization and passive listening. For each condition, plots show grand averaged responses in 12 subjects for the Cz channel (vertex). Horizontal and vertical lines mark the baseline and the onset of the stimulus in each subplot, respectively.
Figure 4.

Separate comparison of the neural responses to pitch shifts in each stimulus (F0, F0+H1, F0+H1+H2, F0+H1+H2+H3 and voice) for active vocalization and passive listening conditions. The lower and upper bar plots demonstrate the peak amplitudes of N1 and P2 ERP components, respectively. The ‘*’ marks indicate significant increase (p<0.05) in amplitudes of neural responses during vocal production compared with passive listening.
The condition× frontality interaction was investigated using one-way Rm-ANOVAs separately for active vocalization and passive listening, with the frontality factor. Results revealed a significant main effect of frontality during both active vocalization (F(4,44)=3.84, p<0.05) and passive listening (F(4,44)=10.08, p<0.001) conditions. Post-hoc tests revealed that during active vocalization, N1 amplitudes were significantly larger (more negative) for fronto-central compared with frontal (p<0.05), centro-parietal (p<0.05) and parietal (p<0.05) and for central compared with frontal (p<0.05), centro-parietal (p<0.05) and parietal (p<0.05) electrodes, indicating that the N1 potentials had a central scalp distribution during active vocalization condition. The topographical maps of N1 scalp distribution are shown for different stimuli in figure5a. However, during passive listening, post-hoc tests indicated that the N1 potential had a fronto-central distribution (more anterior compared with N1 during vocalization) by revealing a significant difference between frontal compared with centro-parietal (p<0.05) and parietal (p<0.05), for fronto-central compared with centro-parietal (p<0.05) and parietal (p<0.05) and for central compared with centro-parietal (p<0.05) and parietal (p<0.05) electrodes (figure5a).
Figure 5.

Topographical scalp distributions of the a) N1 and b) P2 ERP components grand averaged in 12 subjects for voice, complex (F0+H1, F0+H1+H2 and F0+H1+H2+H3) and pure tone (F0) auditory stimuli during active vocalization and passive listening conditions. Each plot demonstrated the distribution maps for 32 EEG channels.
Results of the analysis for the latencies of the N1 component revealed no significant effect. The mean latency of the N1 responses was 123.15 ms (std: 13.04 ms).
P2 component
Three-way (5×2×5) Rm-ANOVAs were similarly performed to examine the main effect of the stimulus complexity, condition, and frontality factors along with their interactions on the amplitude and latency of the P2 component. Results of the analysis for P2 amplitude revealed a significant main effect of stimulus complexity (F(4,44)=8.57, p<0.05) and frontality (F(4,44)=15.46, p<0.001) along with complexity×condition (F(4,44)=2.63, p<0.05) and condition× frontality (F(4,44)=4.88, p<0.05) interactions.
To further investigate the stimulus complexity×condition interaction, P2 amplitudes were analyzed for active vocalization and passive listening conditions separately using one-way Rm-ANOVAs with stimulus complexity factor. For active vocalization, results revealed significant main effects of stimulus complexity (F(4,44)=13.44, p<0.001). Post-hoc tests using Bonferroni’s adjustment revealed that during vocalization, the amplitude of P2 responses to mid-utterance pitch shifts was significantly larger (more positive) for voice compared with F0 (p<0.001), F0+H1 (p<0.05), F0+H1+H2 (p<0.05) and F0+H1+H2+H3 (p<0.05) feedback (see figure3). The P2 amplitude was also significantly larger (more positive) for F0+H1+H2+H3 (p<0.001), F0+H1+H2 (p<0.05) and F0+H1 (p<0.05) compared with F0 feedback. For the passive listening condition, results revealed significant main effects of stimulus complexity (F(4,44)=10.80, p<0.05). Post-hoc tests revealed that during passive listening, the amplitude of P2 responses to mid-utterance pitch shifts was significantly larger (more positive) for voice (p<0.05), F0+H1+H2+H3 (p<0.05), F0+H1+H2 (p<0.05) and F0+H1 (p<0.05) compared with F0 feedback (figure3). Furthermore, a one-way Rm-ANOVA for different stimulus complexities with the condition factor revealed a significant main effect of condition (F(1,11)=5.89, p<0.05) only for voice feedback, indicating that the amplitude of P2 responses to pitch shifts in voice feedback was larger (more positive) during active vocalization compared with passive listening (see upper bar plots in figure4).
The condition× frontality interaction was investigated using one-way Rm-ANOVAs separately for active vocalization and passive listening, with the frontality factor. Results revealed that a significant main effect of frontality during both active vocalization (F(4,44)=15.4, p<0.001) and passive listening (F(4,44)=9.14, p<0.001) conditions. Post-hoc tests revelead that during active vocalization, P2 amplitudes were significantly larger (more positive) for frontal, fronto-central and central electrodes compared centro-parietal and parietal electrodes (p<0.05 for all pair-wise comparisons), indicating that P2 had a fronto-central scalp distribution during active vocalization condition. The topographical maps of P2 scalp distribution are shown for different stimuli in figure5b. However, during passive listening, post-hoc tests indicated that the P2 potential had a central distribution (more posterior compared with P2 during vocalization) by revealing a significant difference (p<0.05 for all pair-wise comparisons) between P2 amplitudes for fronto-central, central and centro-parietal electrodes compared with frontal and parietal electrodes (figure5b).
Results of the analysis for the latencies of the P2 component revealed no significant effect. The mean latency of the P2 responses was 230.29 ms (std: 17.67 ms).
Vocal Responses
A one-way (5) Rm-ANOVA was performed to examine the main effect of stimulus complexity (F0, F0+H1, F0+H1+H2, F0+H1+H2+H3 and Voice) on the magnitude and latency of vocal responses. Results of the analysis revealed a significant main effect only for stimulus complexity (F(4,44)=3.28, p=0.020) on response magnitudes. Post-hoc tests revealed that the vocal responses were significantly larger (more negative or opposing) for voice feedback compared with F0 (p=0.032), F0+H1 (p=0.044), F0+H1+H2 (p=0.038) and F0+H1+H2+H3 (p=0.039) stimuli (figure6). However, no significant difference was observed between response magnitudes to non-voice complex and pure tone stimuli. The mean magnitude and latency of vocal responses for F0, F0+H1, F0+H1+H2, F0+H1+H2+H3 and voice were (−3.94 cents, 265.36 ms), (−4.87 cents, 278.40 ms), (−5.33 cents, 271.47 ms), (−5.21 cents, 281.35 ms) and (−7.27 cents, 276.21 ms), respectively.
Figure 6.
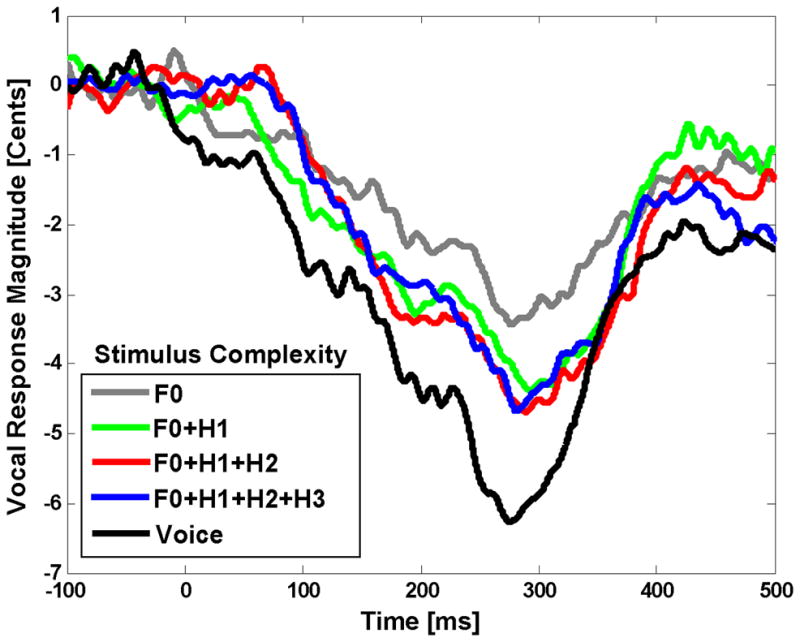
Time course of the vocal responses to pitch shifts (+200 cents) in voice feedback and non-voice complex (F0+H1, F0+H1+H2 or F0+H1+H2+H3) and pure tone (F0) auditory stimuli during vocal production.
Discussion
The present study investigated the relative importance of voice harmonic complexity for vocal control in response to pitch shifts in the feedback of pure tones, complex tones and naturally-produced human vocalizations during active vocal production and passive listening. Our results indicated that pitch changes elicit larger amplitude P2 ERP responses for voice feedback and complex tone stimuli (F0 +H1, F0 +H1+H2 or F0 +H1+H2+H3) compared with that for pure tones during passive listening (figure3). However, no difference was observed in ERP responses for voice and complex tones, indicating that increasing spectral complexity beyond two frequency components (i.e. F0 +H1) may not have a significant impact on the neural processing of pitch variation during passive listening. These findings are consistent with those of Tervaniemi et al. (Tervaniemi, Schroger, 2000b) in which it was shown that pitch changes in spectrally rich complex stimuli composed of the first three and five frequency components elicit equally large MMN responses that are larger than MMN responses for those in a pure sinusoidal tone. Despite this consistency in terms of modulation of neural responses as a function of stimulus complexity, one should note that P2 and MMN potentials may arise from different cortical generators that reflect distinctly different neural processes. The MMNs in Tervaniemi et al.’s studies (Tervaniemi, Ilvonen, 2000a, Tervaniemi, Schroger, 2000b) are in fact elicited in response to frequency differences between discretely presented deviant and standard stimuli (oddball paradigm), whereas the P2 component in the present study reflects mechanisms of detecting pitch changes within continuous sounds such as human vocalizations.
The facilitation of pitch processing for voice and complex tones with more than one frequency component compared with pure tones can possibly be explained by the fact that pitch may not be neurally encoded only by the fundamental frequency (F0) itself but rather by means of similar mechanisms that help identify a missing fundamental based on the harmonic ratios between multiple frequency components (Bendor and Wang, 2005, Winkler et al., 1997). With relevance to this discussion, a study in primates identified a population of neurons in the auditory cortex that were not responsive to pure tones but showed responses that were highly selective to a specific spectro-temporal combination of two tone pips in a complex auditory stimulus (Sadagopan and Wang, 2009). These neurons may be potential candidates for encoding pitch variations in sounds with complex acoustical structures.
During active vocal production, a similar effect to passive listening was observed for neural responses to changes in the pitch frequency of pure tone and complex stimuli, meaning that pitch change detection (indexed by the P2 component) was facilitated for complex stimuli compared with pure tones. However, there was no significant difference between responses when stimulus complexity was increased from two frequency components (F0 +H1) to three (F0 +H1+H2) or four (F0 +H1+H2+H3) (figure3). The comparison between active vocalization and passive listening conditions did not show any difference for neural responses to pitch shifts in complex or pure tone stimuli (figures3 and 4). This suggests that change detection in pitch frequency of complex and pure tone stimuli during vocal production may be mediated by similar sensory (i.e. auditory) mechanisms that contribute to pitch change detection during passive listening.
However, our results indicate that the neural processing of pitch change detection in naturally-produced voice auditory feedback is different from that in non-vocal complex tone stimuli. Results of our analysis have shown that the N1 and P2 components of ERPs have larger amplitudes in response to pitch perturbations in the subject’s voice feedback than to complex and pure tone stimuli during active vocalization (figure3). The comparison between active vocalization and passive listening conditions revealed significant enhancement of the N1 and P2 components during vocal production only for voice feedback (figures 3 and 4). Vocalization-induced enhancement of neural responses to pitch-shifted voice feedback in the present study is consistent with previous findings of similar studies in primates (Eliades and Wang, 2008) and humans (Behroozmand, Karvelis, 2009a, Liu, Behroozmand, 2010, Maidhof, Vavatzanidis, 2010a) and suggest that the motor act of vocal production may provide a mechanism that enhances sensory processing of feedback in order to more effectively detect and correct for pitch perturbations in voice feedback.
The enhanced processing of pitch perturbations in voice compared with complex tone feedback during vocalization can be accounted for by several factors in the present study. First, it might be that more complex natural sounds such as human voice provide more spectral cues for auditory processing of pitch perturbation compared with complex tone stimuli (see figure 2). This idea is supported by findings of an earlier study suggesting that the enhancement of neural responses during vocal production may result from motor-driven mechanisms (probably efference-based) that change the tuning properties of auditory neurons in such a way that their receptive fields shift toward frequency components of pitch-shifted feedback (Eliades and Wang, 2008). Therefore, pitch perturbations in spectrally rich sounds (e.g. human voice) provide more sensory cues, and consequently, excite a larger group of auditory neurons during active vocal production. Second, it might be that the motor-driven mechanisms enable the audio-vocal system to encode for more specific spectro-temporal aspects of natural voice stimuli, rather than just the total number of frequency components, in order to enhance the neural processing of auditory feedback. For example, the system may be sensitive to a relative phase difference (time shifts) between frequency components that exist in a natural human vocalization (temporal features). In addition, modulation of harmonic energy distributions in signal spectrum, by means of formant frequencies that characterize the resonant properties of an individual’s vocal tract, may lead to enhanced neural processing of voice feedback during active vocal production (spectral features). Third, higher level cognitive-related mechanisms may also be involved in enhancing the auditory processing of feedback pitch perturbations during self-vocalization. For instance, the recognition of self-voices by means of comparing the predicted (efference copies) and actual sensory feedback, and distinguishing them from externally-generated stimuli, may lead to an increase in neural sensitivity for detecting and correcting vocal pitch errors that occur in self-produced vocal output during speaking. Although it is not clearly understood to what extent each of the above factors may play a role in this enhancement process, findings of the present study indicate the motor act of vocalization enhances sensory processing of perturbation in voice compared with non-voice complex tone auditory feedback. This effect may be an important characteristic of the audio-vocal system that enables it to more effectively monitor and control for pitch errors in voice feedback during vocalization or speaking.
With relevance to this discussion, an earlier study by Sivasankar et al. (Sivasankar et al., 2005) showed that the magnitude of vocal responses to pitch shifts in voice feedback were larger than those for a triangular-shaped (complex stimulus including harmonics) or pure sinusoidal tones. Similarly, we also found significant differences between the magnitudes of vocal compensations for voice compared with complex and pure tone stimuli (figure6). However, the vocal responses to pitch shifts in pure tone and complex stimuli did not follow the trend predicted by their corresponding ERP measures. That is, we found that the amplitude of the P2 component was significantly larger for pitch shifts in complex compared with pure tone stimuli, but there was no such a difference in vocal responses to complex and pure tone feedback. This inconsistency between the measures of vocal and neural responses may arise because vocal responses are likely to be more variable across different subjects due to the fact that they can be affected by neural mechanisms in different areas (e.g. cortical, cerebellum, limbic system, brainstem) and varying biomechanical and muscular parameters of the laryngeal and respiratory systems (Davis et al., 1993, Jurgens, 2008, Larson, 1991, Ludlow, 2005, Titze, 1994).
One potential confound in comparing ERP responses during active vocal production and passive listening to the playback in the present study is the effect of bone-conducted voice feedback. Bone conduction may result in slight changes in feedback intensity during vocal production compared with passive listening and may interact with side-tone feedback in complex ways. It has been pointed out that bone conduction may increase feedback intensity as to become nearly two times larger in amplitude (3 dB louder) during vocal production compared with passive listening (Houde, Nagarajan, 2002). Previous reports have demonstrated that the magnitude of auditory neural responses monotonically increase with the increase in sound intensity level (Stufflebeam et al., 1998). Therefore, one would expect that the difference between feedback loudness during vocalization and listening due to bone conduction may have resulted in the enhancement of ERPs to pitch-shifted voice feedback during vocalization in the present study. However, due to the following reasons, it seems unlikely that this change in feedback intensity would have had a significant impact on neural responses for vocalization compared with passive listening: First, the monotonic increase in auditory neural responses as a function of sound intensity level (Stufflebeam, Poeppel, 1998) reaches a plateau at nearly 80 dB SPL that was used in the present study. Second, subjects were asked to produce vocalizations at a moderate level (~70 dB), and we attempted to minimize the effects of airborne and bone conduction by using insert earphones and also boosting the feedback gain by 10 dB over the voice. Third, the ERPs in the present study were elicited in response to the onset of a pitch shift that occurred only in the auditory feedback (earphone outputs) but not the bone-conducted feedback. Lastly, if ERP response enhancement during vocalization was resulting from louder sound intensities due to bone conduction, the enhancement effect should have been observed not only for voice, but also for complex and pure tone feedback. However, our results demonstrated that the vocalization-induced ERP enhancement is only present for voice feedback stimuli.
In addition to the arguments presented above, and despite the possibility of complex interactions between bone-conducted and auditory feedback, results of the present study are in agreement with several other studies that have shown that the activity of vocal motor system modulates (either enhances or suppresses) the sensory neural processing of auditory feedback. Early studies in primates have shown that electrically-induced activation of the vocal motor system modulates (suppresses) the activity of cortical auditory neurons (Müller-Preuss et al., 1980, Muller-Preuss and Ploog, 1981). The motor-induced suppression effect was also reported in the auditory system during voluntary vocalizations in humans and primates (Eliades and Wang, 2003, Heinks-Maldonado, Mathalon, 2005, Houde, Nagarajan, 2002). In the somatosensory system, a similar suppression effect was reported in response to self- vs. externally-generated tactile stimulations (Blakemore, Wolpert, 1998b). A more recent study in primates (Eliades and Wang, 2008) has shown that the suppressed auditory neurons become highly responsive to pitch-shifted feedback during vocal production, suggesting that the motor-driven mechanisms may modulate auditory feedback processing for online monitoring of vocal output during vocalization. Vocalization-induced enhancement to pitch shifted feedback was also demonstrated in humans during vocal production (Behroozmand et al., 2009b, Liu, Behroozmand, 2010) and playing musical sounds(Maidhof et al., 2010b). Eliades et al. (Eliades and Wang, 2008) suggested that the enhanced responses to pitch shifts during vocal production can not possibly be due to interactions between bone-conducted and auditory feedback because bone conducted feedback will be low-pass filtered at 2 KHz, whereas the F0 and other frequency components of monkeys’ vocalizations are often above 4 KHz. All together, there are several lines of evidence suggesting that the bone conducted feedback may have not had a significant effect on the ERP responses reported in the present study.
The analysis of scalp potential distributions revealed that there were significant interactions between the condition (vocalization vs. listening) and frontality factors for N1 and P2 components of ERPs. As depicted in figure5, the N1 component during vocal production had a broad distribution with prominent peaks over the central and fronto-central electrodes that became more frontal with prominent peaks over central, fronto-central and frontal channels during passive listening. The scalp distribution of the P2 component was narrower compared to N1 in both conditions and was more frontal during vocal production compared with passive listening. The primary neural generators of the N1 during passive listening have been identified within the primary (Burkard et al., 2006) and secondary (Hari et al., 1980) cortical auditory areas (for description of other N1 generators see: (Naatanen and Picton, 1987)) but little is known about the generators of the P2 component. The observed differences between scalp distributions of N1 and P2 during active vocalization and passive listening suggest that additional neuronal activities related to the motor act of voice production and regulation may contribute to ERPs measured during vocal production.
In summary, the goal of the present study was to determine the relative contribution of acoustical complexity of auditory feedback for vocal pitch error detection and correction. We suggest that increasing the acoustical complexity facilitates this process possibly because complex sounds such as the human voice carry species-specific spectral information for the system. Active vocal production is also suggested to enhance vocal control by facilitating the detection of disruptive effects such as pitch perturbations in voice feedback compared with complex or pure tone auditory stimuli. However, besides spectral complexity, other physical (e.g. spectro-temporal modulations) or psychophysical (e.g. self-identification) factors may also play a role in enhancing the auditory processing of pitch perturbations in voice feedback compared with complex and pure tone stimuli. Although the extent of contribution by these factors remains unknown, results of the present study provide supporting evidence for the fact that the importance of auditory feedback processing is emphasized during vocal production presumably because the audio-vocal system tends to maintain an intended vocal output by detecting and correcting for unexpected errors in voice feedback.
Acknowledgments
This research was supported by a grant from NIH, Grant No. 1R01DC006243.
Footnotes
Publisher's Disclaimer: This is a PDF file of an unedited manuscript that has been accepted for publication. As a service to our customers we are providing this early version of the manuscript. The manuscript will undergo copyediting, typesetting, and review of the resulting proof before it is published in its final citable form. Please note that during the production process errors may be discovered which could affect the content, and all legal disclaimers that apply to the journal pertain.
References
- Bauer JJ, Mittal J, Larson CR, Hain TC. Vocal responses to unanticipated perturbations in voice loudness feedback: An automatic mechanism for stabilizing voice amplitude. J Acoust Soc Am. 2006;119:2363–71. doi: 10.1121/1.2173513. [DOI] [PMC free article] [PubMed] [Google Scholar]
- Behroozmand R, Karvelis L, Liu H, Larson CR. Vocalization-induced enhancement of the auditory cortex responsiveness during voice F0 feedback perturbation. Clin Neurophysiol. 2009a;120:1303–12. doi: 10.1016/j.clinph.2009.04.022. [DOI] [PMC free article] [PubMed] [Google Scholar]
- Behroozmand R, Karvelis L, Liu H, Larson CR. Vocalization-induced enhancement of the auditory cortex responsiveness during voice F0 feedback perturbation. Clinical Neurophysiol. 2009b;120:1303–12. doi: 10.1016/j.clinph.2009.04.022. [DOI] [PMC free article] [PubMed] [Google Scholar]
- Bendor D, Wang X. The neuronal representation of pitch in primate auditory cortex. Nature. 2005;436:1161–5. doi: 10.1038/nature03867. [DOI] [PMC free article] [PubMed] [Google Scholar]
- Blakemore SJ, Goodbody SJ, Wolpert DM. Predicting the consequences of our own actions: The role of sensorimotor context estimation. Journal of Neuroscience. 1998a;18:7511–8. doi: 10.1523/JNEUROSCI.18-18-07511.1998. [DOI] [PMC free article] [PubMed] [Google Scholar]
- Blakemore SJ, Wolpert D, Frith C. Why can’t you tickle yourself? Neuroreport. 2000;11:R11–R6. doi: 10.1097/00001756-200008030-00002. [DOI] [PubMed] [Google Scholar]
- Blakemore SJ, Wolpert DM, Frith CD. Central cancellation of self-produced tickle sensation. Nature Neuroscience. 1998b;1:635–40. doi: 10.1038/2870. [DOI] [PubMed] [Google Scholar]
- Boersma P. Praat, a system for doing phonetics by computer. Glot International. 2001;5:341–5. [Google Scholar]
- Burkard RF, Don M, Eggermont JJ. Auditory Evoked Potentials: Basic Principles and Clinical Application. 1. Lippincott Williams & Wilkins; 2006. [Google Scholar]
- Burnett TA, Freedland MB, Larson CR, Hain TC. Voice F0 Responses to Manipulations in Pitch Feedback. J Acoust Soc Am. 1998;103:3153–61. doi: 10.1121/1.423073. [DOI] [PubMed] [Google Scholar]
- Chase RA, Sutton S, First D, Zubin J. A developmental study of changes in behavior under delayed auditory feedback. J Genet Psychol. 1961;99:101–12. doi: 10.1080/00221325.1961.10534396. [DOI] [PubMed] [Google Scholar]
- Chen SH, Liu H, Xu Y, Larson CR. Voice F0 responses to pitch-shifted voice feedback during English speech. J Acoust Soc Am. 2007;121:1157–63. doi: 10.1121/1.2404624. [DOI] [PubMed] [Google Scholar]
- Cowie RI, Douglas-Cowie E. Speech production in profound post-lingual deafness. In: LM E, HM P, editors. Hearing Science and Hearing Disorders. New York: Academic Press; 1983. [Google Scholar]
- Davis PJ, Bartlett DJ, Luschei ES. Coordination of the respiratory and laryngeal systems in breathing and vocalization. In: Titze IR, editor. Vocal Fold Physiology Frontiers in Basic Science. San Diego: Singular; 1993. pp. 189–226. [Google Scholar]
- Decety J. Neural representations for action. Rev Neurosci. 1996;7:285–97. doi: 10.1515/revneuro.1996.7.4.285. [DOI] [PubMed] [Google Scholar]
- Donath TM, Natke U, Kalveram KT. Effects of frequency-shifted auditory feedback on voice F0 contours in syllables. J Acoust Soc Am. 2002;111:357–66. doi: 10.1121/1.1424870. [DOI] [PubMed] [Google Scholar]
- Eliades SJ, Wang X. Sensory-motor interaction in the primate auditory cortex during self-initiated vocalizations. J of Neurophysiology. 2003;89:2194–207. doi: 10.1152/jn.00627.2002. [DOI] [PubMed] [Google Scholar]
- Eliades SJ, Wang X. Neural substrates of vocalization feedback monitoring in primate auditory cortex. Nature. 2008;453:1102–6. doi: 10.1038/nature06910. [DOI] [PubMed] [Google Scholar]
- Hain TC, Burnett TA, Kiran S, Larson CR, Singh S, Kenney MK. Instructing subjects to make a voluntary response reveals the presence of two components to the audio-vocal reflex. Experimental Brain Research. 2000;130:133–41. doi: 10.1007/s002219900237. [DOI] [PubMed] [Google Scholar]
- Hari R, Aittoniemi K, Jarvinen ML, Katila T, Varpula T. Auditory Evoked Transient and Sustained Magnetic-Fields of the Human-Brain - Localization of Neural Generators. Experimental Brain Research. 1980;40:237–40. doi: 10.1007/BF00237543. [DOI] [PubMed] [Google Scholar]
- Heinks-Maldonado TH, Mathalon DH, Gray M, Ford JM. Fine-tuning of auditory cortex during speech production. Psychophysiology. 2005;42:180–90. doi: 10.1111/j.1469-8986.2005.00272.x. [DOI] [PubMed] [Google Scholar]
- Heinks-Maldonado TH, Nagarajan SS, Houde JF. Magnetoencephalographic evidence for a precise forward model in speech production. Neuroreport. 2006;17:1375–9. doi: 10.1097/01.wnr.0000233102.43526.e9. [DOI] [PMC free article] [PubMed] [Google Scholar]
- Houde JF, Jordan MI. Sensorimotor adaptation in speech production. Science. 1998;279:1213–6. doi: 10.1126/science.279.5354.1213. [DOI] [PubMed] [Google Scholar]
- Houde JF, Nagarajan SS, Sekihara K, Merzenich MM. Modulation of the auditory cortex during speech: An MEG study. Journal of Cognitive Neuroscience. 2002;14:1125–38. doi: 10.1162/089892902760807140. [DOI] [PubMed] [Google Scholar]
- Jeannerod M. The Neural and Behaviourial Organisation of Goal-Directed Movements. Oxford Univ Press; 1988. [Google Scholar]
- Jones JA, Munhall KG. Perceptual calibration of F0 production: Evidence from feedback perturbation. J Acoust Soc Am. 2000;108:1246–51. doi: 10.1121/1.1288414. [DOI] [PubMed] [Google Scholar]
- Jurgens U. The Neural Control of Vocalization in Mammals: A Review. J Voice. 2008 doi: 10.1016/j.jvoice.2007.07.005. [DOI] [PubMed] [Google Scholar]
- Kalinowski J, Armson J, Roland-Mieszkowski M, Stuart A, Gracco VL. Effects of alterations in auditory feedback and speech rate on stuttering frequency. Lang Speech. 1993;36 ( Pt 1):1–16. doi: 10.1177/002383099303600101. [DOI] [PubMed] [Google Scholar]
- Kawahara H, Aikawa K. Contributions of auditory feedback frequency components on F0 fluctuations. J Acoust Soc Am. 1996;100:2825 (A). [Google Scholar]
- Kiran S, Larson CR. Effect of duration of pitch-shifted feedback on vocal responses in patients with Parkinson’s disease. J Speech Lang Hear Res. 2001;44:975–87. doi: 10.1044/1092-4388(2001/076). [DOI] [PubMed] [Google Scholar]
- Larson CR. On the relation of PAG neurons to laryngeal and respiratory muscles during vocalization in the monkey. Brain Res. 1991;552:77–86. doi: 10.1016/0006-8993(91)90662-f. [DOI] [PubMed] [Google Scholar]
- Larson CR, Sun J, Hain TC. Effects of simultaneous perturbations of voice pitch and loudness feedback on voice F0 and amplitude control. J Acoust Soc Am. 2007;121:2862–72. doi: 10.1121/1.2715657. [DOI] [PubMed] [Google Scholar]
- Liu H, Behroozmand R, Larson CR. Enhanced neural responses to self-triggered voice pitch feedback perturbations. Neuroreport. 2010;21:527–31. doi: 10.1097/WNR.0b013e3283393a44. [DOI] [PMC free article] [PubMed] [Google Scholar]
- Ludlow CL. Central nervous system control of the laryngeal muscles in humans. Respir Physiol Neurobiol. 2005;147:205–22. doi: 10.1016/j.resp.2005.04.015. [DOI] [PMC free article] [PubMed] [Google Scholar]
- Maidhof C, Vavatzanidis N, Prinz W, Rieger M, Koelsch S. Processing expectancy violations during music performance and perception: an ERP study. J Cogn Neurosci. 2010a;22:2401–13. doi: 10.1162/jocn.2009.21332. [DOI] [PubMed] [Google Scholar]
- Maidhof C, Vavatzanidis N, Prinz W, Rieger M, Koelsch S. Processing expectancy violations during music performance and perception: an ERP study. Journal of Cognitive Neuroscience. 2010b;22:2401–13. doi: 10.1162/jocn.2009.21332. [DOI] [PubMed] [Google Scholar]
- Müller-Preuss P, Newman JD, Jürgens U. Anatomical and physiological evidence for a relationship between the ‘cingular’ vocalization area and the auditory cortex in the squirrel monkey. Brain Research. 1980;202:307–15. doi: 10.1016/0006-8993(80)90143-2. [DOI] [PubMed] [Google Scholar]
- Muller-Preuss P, Ploog D. Inhibition of auditory cortical neurons during phonation. Brain Research. 1981;215:61–76. doi: 10.1016/0006-8993(81)90491-1. [DOI] [PubMed] [Google Scholar]
- Munhall KG, MacDonald EN, Byrne SK, Johnsrude IS. Talkers alter vowel production in response to real-time formant perturbation even when instructed not do compehsate. J Acoust Soc Am. 2009;125:384–90. doi: 10.1121/1.3035829. [DOI] [PMC free article] [PubMed] [Google Scholar]
- Naatanen R, Kujala T, Winkler I. Auditory processing that leads to conscious perception: A unique window to central auditory processing opened by the mismatch negativity and related responses. Psychophysiology. 2010 doi: 10.1111/j.1469-8986.2010.01114.x. [DOI] [PubMed] [Google Scholar]
- Naatanen R, Picton T. The N1 wave of the human electric and magnetic response to sound: a review and an analysis of the component structure. Psychophysiology. 1987;24:375–425. doi: 10.1111/j.1469-8986.1987.tb00311.x. [DOI] [PubMed] [Google Scholar]
- Natke U, Grosser J, Sandrieser P, Kalveram KT. The duration component of the stress effect in stuttering. J Fluency Disord. 2002;27:305–17. doi: 10.1016/s0094-730x(02)00163-8. quiz 18. [DOI] [PubMed] [Google Scholar]
- Oostenveld R, Praamstra P. The five percent electrode system for high-resolution EEG and ERP measurements. Clin Neurophysiol. 2001;112:713–9. doi: 10.1016/s1388-2457(00)00527-7. [DOI] [PubMed] [Google Scholar]
- Purcell DW, Munhall KG. Compensation following real-time manipulation of formants in isolated vowels. J Acoust Soc Am. 2006;119:2288–97. doi: 10.1121/1.2173514. [DOI] [PubMed] [Google Scholar]
- Russo N, Larson C, Kraus N. Audio-vocal system regulation in children with autism spectrum disorders. Experimental Brain Research. 2008;188:111–24. doi: 10.1007/s00221-008-1348-2. [DOI] [PMC free article] [PubMed] [Google Scholar]
- Sadagopan S, Wang X. Nonlinear spectrotemporal interactions underlying selectivity for complex sounds in auditory cortex. J Neurosci. 2009;29:11192–202. doi: 10.1523/JNEUROSCI.1286-09.2009. [DOI] [PMC free article] [PubMed] [Google Scholar]
- Sivasankar M, Bauer JJ, Babu T, Larson CR. Voice responses to changes in pitch of voice or tone auditory feedback. J Acoust Soc Am. 2005;117:850–7. doi: 10.1121/1.1849933. [DOI] [PMC free article] [PubMed] [Google Scholar]
- Sperry R. Neural basis of the spontaneous optokinetic response produced by visual inversion. J Compl Physiol Psychol. 1950;43:482–9. doi: 10.1037/h0055479. [DOI] [PubMed] [Google Scholar]
- Stufflebeam SM, Poeppel D, Rowley HA, Roberts TP. Peri-threshold encoding of stimulus frequency and intensity in the M100 latency. Neuroreport. 1998;9:91–4. doi: 10.1097/00001756-199801050-00018. [DOI] [PubMed] [Google Scholar]
- Tervaniemi M, Ilvonen T, Sinkkonen J, Kujala A, Alho K, Huotilainen M, et al. Harmonic partials facilitate pitch discrimination in humans: electrophysiological and behavioral evidence. Neurosci Lett. 2000a;279:29–32. doi: 10.1016/s0304-3940(99)00941-6. [DOI] [PubMed] [Google Scholar]
- Tervaniemi M, Schroger E, Saher M, Naatanen R. Effects of spectral complexity and sound duration on automatic complex-sound pitch processing in humans - a mismatch negativity study. Neurosci Lett. 2000b;290:66–70. doi: 10.1016/s0304-3940(00)01290-8. [DOI] [PubMed] [Google Scholar]
- Titze IR. Principles of Voice Production. Englewood Cliffs: Prentice hall; 1994. [Google Scholar]
- von Helmholtz H. Handbook of physiological optics. 1. Hamburg: Voss; 1867. [Google Scholar]
- von Holst E. Relations between the central nervous system and the peripheral organ. Br J Animal Behavior. 1954;2:89–94. [Google Scholar]
- Winkler I, Denham SL, Nelken I. Modeling the auditory scene: predictive regularity representations and perceptual objects. Trends Cogn Sci. 2009;13:532–40. doi: 10.1016/j.tics.2009.09.003. [DOI] [PubMed] [Google Scholar]
- Winkler I, Tervaniemi M, Naatanen R. Two separate codes for missing-fundamental pitch in the human auditory cortex. J Acoust Soc Am. 1997;102:1072–82. doi: 10.1121/1.419860. [DOI] [PubMed] [Google Scholar]
- Wolpert D. Computational approaches tomotor control. Trends in Cognitive Science. 1997;1:209–16. doi: 10.1016/S1364-6613(97)01070-X. [DOI] [PubMed] [Google Scholar]
- Wolpert DM, Ghahramani Z, Jordan MI. An internal model for sensorimotor integration. Science. 1995;269:1880–2. doi: 10.1126/science.7569931. [DOI] [PubMed] [Google Scholar]
- Xu Y, Larson C, Bauer J, Hain T. Compensation for pitch-shifted auditory feedback during the production of Mandarin tone sequences. J Acoust Soc Am. 2004;116:1168–78. doi: 10.1121/1.1763952. [DOI] [PMC free article] [PubMed] [Google Scholar]