Abstract
Understanding relationships between the sequence and timing of brain developmental events across a given set of mammalian species can provide information about both neural development and evolution. Yet neuro-developmental event timing data available from the published literature are incomplete, particularly for humans. Experimental documentation of unknown event timings requires considerable effort that can be expensive, time consuming, and for humans, often impossible. Application of suitable statistical models for translating neurodevelopmental event timings across mammalian species is essential. The present study implements an established statistical model and related functions as an open-source R package (ttime, translating time). The model incorporated into ttime allows predictions of unknown neurodevelopmental timings and explorations of phylogenetic relationships. The open-source package will enable transparency and reproducibility while minimizing redundancy. Sustainability and widespread dissemination will be guaranteed by the active CRAN (Comprehensive R Archive Network) community. The package updates the web-service (Clancy et al. 2007b) www.translatingtime.net by permitting predictions based on curated event timing databases which may include species not yet incorporated in the current model. The R package can be integrated into complex workflows that use the event predictions in their analyses. The package ttime is publicly available and can be downloaded from http://cran.r-project.org/web/packages/ttime/index.html.
Keywords: Open-source, R package, Cross-species modeling, Cross-species comparisons, Neurodevelopment
Introduction
Understanding similarities and variations in the sequence of neurodevelopmental events across mammalian species can provide critical insight into brain development and evolution (Finlay et al. 1998; Finlay et al. 2001). However, the distribution of empirically derived data across the various species is skewed. While many neurodevelopmental events are documented for certain species (e.g. rats, mice, macaques), less information is available for others (e.g. rabbits, cats, humans). Experimental documentation demands expensive, dedicated efforts, and for humans the ethical constraints are considerable. A solution to this challenge is to translate the neurodevelopmental timing data from species in which they were empirically derived to species in which they are not known using suitable models. This is possible because prior research has demonstrated the event timing sequences to be surprisingly conserved across mammalian species (Finlay and Darlington 1995). The present study implements the current version of a statistical model developed over the past years (Finlay and Darlington 1995; Darlington et al. 1999; Clancy et al. 2000, 2001, 2007a; Clancy 2006) in the open-source environment R (R Core Development Team). ttime is useful in predicting unknown events from neurodevelopmental event data documented in the literature, and investigating the nexus between neurodevelopmental event timing and phylogenetic proximity from the known and predicted events (Nagarajan and Clancy 2008). It should be noted that this model contains assumptions that are specific to the species and events in the current database. However, ttime is inherently flexible, and will allow expansion of the existing model as more data are accumulated. The package also permits researchers to apply the model with respect to in-house curated databases consisting of a selected group of events, species and their strains. ttime complements the existing web-service (Clancy et al. 2007b) www.translatingtime.net.
Implementation and Functions
Recently, we reported development of a web-service www.translatingtime.net (Clancy et al. 2007b) that utilizes detailed documentation of neurodevelopmental events retrieved from published literature across a number of species. The web-service applies parameters estimated from the empirical data set using the translating time statistical model and subsequently predicts unknown event timings and cross-species comparisons. The frequent use of the web-service (>40,000 page accesses) by the research community since its publication (Clancy et al. 2007b) establishes its usefulness. The web-service and data sets (Clancy et al. 2007a, b) have been cited widely (> 100 citations) across varied scientific disciplines including neuropharmacology (Vorhees et al. 2007; Skelton et al. 2008; Meyer et al. 2010), perinatal pain and anesthesia (Rothstein et al. 2008; Sanders et al. 2008; Fitzgerald and Walker 2009; McCann and Soriano 2009), neuromodulator development (Thompson and Stanwood 2009; Nordquist and Oreland 2010) and nutrition (Rosales et al. 2009). Our tracking statistics indicate over 500 national and international universities, medical centers, and research labs have accessed the web-service, and many of these use the site on a regular basis. The site was hyperlinked to the Society for Neuroscience—Neuroscience Database Gateway (Neuroscience Information Framework) following an evaluation using criteria including substantiality and relevance http://www.neuinfo.org/nif/registry/nif-0000-00533.
The package ttime updates the existing web-service by deriving the model parameters from any given data set. Subsequently, it predicts unknown event timings using these estimated model parameters. Implementing the model in the open-source R enables transparency, reproducibility, and sustainability while minimizing redundancy. Transparency and reproducibility are guaranteed by the R open-source environment where the source code of the implemented functions is available as a part of the package. Sustainability of the package is guaranteed by the active R user group and CRAN with several mirror sites across the world http://cran.r-project.org/mirrors.html. R packages also can be installed across a number of popular operating systems (Windows, Mac, Linux). R interfaces to several established statistical packages and web-browsers are readily available. These in turn minimize redundancy. More importantly, ttime can be useful in developing customized workflows where the user can use ttime functions for the analysis of in-house event timing data sets that may contain species not yet incorporated in our web-service.
Loading the ttime Package in the R Environment
The R base package version (R Core Development Team) can be downloaded and installed from CRAN (http://cran.rproject.org/). The base package version for proper functioning of ttime must be either R 2.11.1 or a later version (i.e. >=R 2.11.1). ttime was built using package.skeleton (Writing R Extension Manual). In order to invoke the functions in ttime, the package should be loaded into the R environment as follows:
-
➢
library(ttime);
Loading the neurodevelopmental event timing data
Neurodevelopmental event timing data (in post-conceptional days) obtained from documented literature (106 events in 10 species; hamster, mouse, rat, rabbit, spiny mouse, guinea pig, ferret, cat, macaque, and humans) are provided as test data set along with the package (Clancy et al. 2001, 2007b). Each of the 106 events has been documented in at least one of the ten species. Information as to whether a given event is cortical or limbic is also provided in order to accommodate primate-cortical and primate-limbic interaction terms in the model (Clancy et al. 2007a). These terms reflect slight shifts in the timing of limbic and cortical brain regions when primate development is compared to development in non-primates (Clancy et al. 2001). The ordering of the columns in the data set is as follows: event name (text), non-primate species event timing (real number), primate species event timing (real number), cortical (binary), limbic (binary), bibliographic reference (text). It is important to note that the non-primate species event timings precede the primate species event timings. The data set event_data provided with the package is in tab-delimited format such that the rows represent the various events and the columns represent the species. A screen shot of representative neurodevelopmental event data generated using Microsoft Excel 2007 is shown in Fig. 1. The data set can be loaded into the R environment as follows:
-
➢
data(event_data)
Fig. 1.
Two representative events across ten species (8 non-primates, 2 primates) from event_data. The ordering of the columns are as follows: event name (text), event timing across non-primate and primate species (real number), cortical event (binary), limbic event (binary), bibliographic reference (text)
The data set resides as an R data file (event_data.rda) under the directory /R-2.11.1/library/ ttime/data and also can be loaded as load(‘event_data.rda’) in the R environment after specifying the appropriate path.
Predicting Unknown Event Timings
The translating time model described in incorporating the primate-cortical and primate-limbic interaction terms was implemented to predict unknown event timings across species (Finlay and Darlington 1995; Clancy et al. 2001, 2007a, b). This model is essentially a dummy variable regression model whose parameters correspond to the events and species in the given data set. In order to avoid singularity, one species and one event are deemed as the base-species and base-event and dropped from the estimation (Darlington et al. 1999; Clancy et al. 2001, 2007a). The choice of base-species and base-event can be arbitrary and does not affect the prediction results. An additional column is coded with 1 for cortical events in primates and 0 for all other cases, and another column is coded with 1 for limbic events in primates and 0 for all other cases. These columns represent respectively (cortical, primate) and (limbic, primate) interaction terms. The constant k was determined as the value that maximizes the correlation between the given data and its predicted counterpart. The constant likely represents early neural organization event timings that do not vary across species. In ttime, the function translate implements the above regression model with arguments event_data and npsp (number of nonprimate species) and can be invoked as follows:
-
➢
npsp<- 8;
-
➢
results<- translate(event_data, npsp);
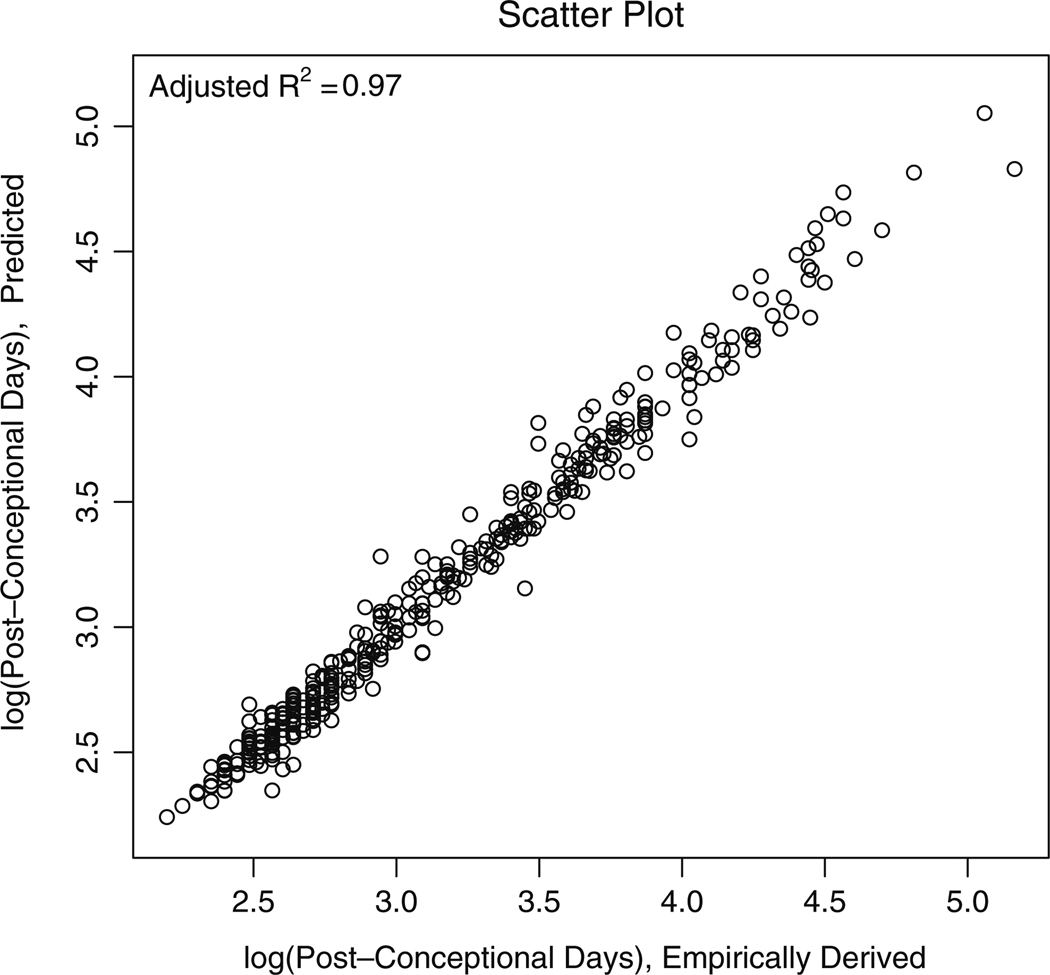
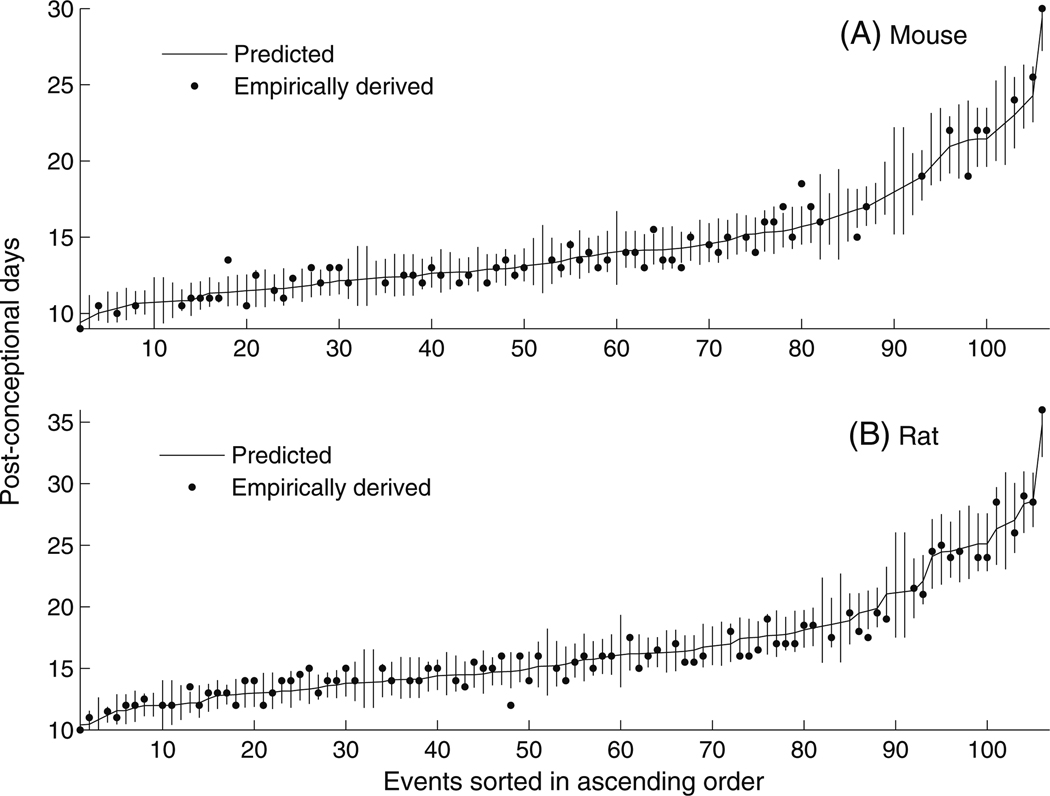
Windows users can uncheck the Buffered Output under the menu Misc in the R GUI to see the progress on the screen. The data frame res consists of known and predicted events along with their 95% confidence intervals. The order of the species in results is the same as that of the input file event_data. The correlation between the given event timing data and its predicted counterpart from res is shown in Fig. 2 (adjusted R2~0.97). This figure was generated by the function translate. The predicted event timing (post-conceptional day) along with 95% confidence interval for two of the species (rat and mouse) obtained from results are shown in Fig. 3 as additional information. The 106 event-timing values are sorted in the ascending order (post-conceptional days) for clarity. It should be noted that Fig. 3 is not an essential part of the proposed package and was generated using MATLAB 7.7 (Mathworks Inc., MA).
Fig. 2.
A scatter plot of the empirically-derived events and their corresponding predicted counterparts in the log-scale. The correlation between the empirically-derived and the predicted events (adjusted R2) is also shown
Fig. 3.
Empirically-derived event timings (post-conceptional days, dark circles) and the corresponding predicted counterparts (curve) returned by translate. Event data from mouse and rat are depicted in (a) and (b) respectively. The events are numbered (1…106) and plotted in ascending order for clarity. The vertical lines represent the 95% confidence interval of the predicted values
Phylogenetic Proximity of the Species
Hierarchical clustering with complete linkage and euclidean metric was used to investigate possible nexus between phylogenetic proximity and neurodevelopmental event timing (Nagarajan and Clancy 2008) using the function phylo:
-
➢
phylo(res)
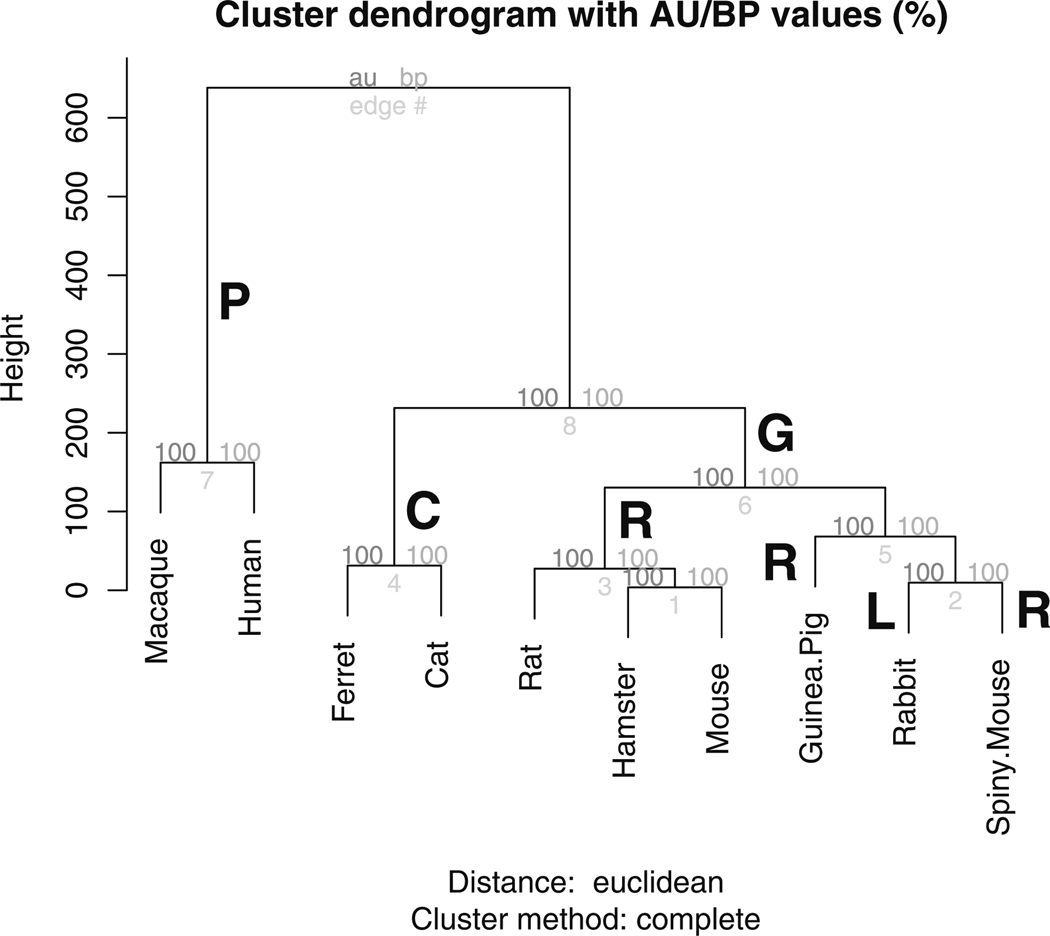
The R package pvclust (Suzuki and Shimodaira 2006) was used to investigate the uncertainty in the hierarchical clustering results using bootstrap samples. The function phylo does not return any values (NULL) and is used to generate the phylogenetic profile by hierarchical clustering of the predicted and known events across the ten species. This revealed four major orders, namely primates (P: human, macaque), carnivores (C: cat, ferret), rodents (R: rat, hamster, mouse, guinea pig, spiny mouse) and lagomorphs (L: rabbit), with rodents (R) and lagomorphs (L) under the monophyletic group glires (G), (Murphy et al. 2001), Fig. 4. This figure was generated by the function phylo. Uncertainty in the clustering results in Fig. 4 is captured by the approximately unbiased probabilities (au) and the bootstrap probabilities (bp) (Suzuki and Shimodaira 2006).
Fig. 4.
Phylogenetic proximity between the ten species based on the empirically-derived and predicted neurodevelopmental event timings using phylo revealed four prominent orders: primates (P), carnivores (C), rodents (R) and lagomorphs (L), with lagomorphs and rodents under the monophyletic order glires (G). Euclidean metric and complete linkage were used to generate the clusters. The approximately unbiased probabilities (au) and bootstrap probabilities (bp) are also shown
Conclusion
The package ttime is implemented in open-source R package in order to enable transparency and reproducibility of the translating time model. The CRAN environment is also likely to enhance sustainability and widespread dissemination of the package to the neuroinformatics research community. The functions incorporated in ttime derive the model and phylogenetic profiles from the given event-timing data set. It lends itself to be incorporated across customized workflows that may include more advanced analysis of the predicted event timing data and enable prediction of new events not yet incorporated in the existing web-service. It is important to note that not all event data produced by the user may necessarily fit the model. Appropriate evaluation of the prediction results using suitable statistical measures is encouraged.
Information Sharing Statement
The data set, functions, and the manual of the ttime package are available publicly through the open-source CRAN (Comprehensive R Archive Network) with mirror sites across the world http://cran.r-project.org/web/packages/ttime/index.html. Redistribution and modification of the ttime package is permitted under the terms of the GNU General Public License http://www.r-project.org/.
Acknowledgements
Supported by NSF DBI-0849684 to RN, NSF DBI-0849627 to BC, NSF DBI-0848612 to BLF, and NIH Grant Number P20 RR-16460 from the IDeA Networks of Biomedical Research Excellence (INBRE) Program of the National Center for Research Resources to RN and BC.
Contributor Information
Radhakrishnan Nagarajan, Email: nagarajanradhakrish@uams.edu, Division of Biomedical Informatics, University of Arkansas for Medical Sciences, COPH/UAMS, Room 3234, 4301W Markham, Slot 781, Little Rock, AR 72205-7199, USA.
Richard B. Darlington, Department of Psychology, Cornell University, Ithaca, NY, USA
Barbara L. Finlay, Department of Psychology, Cornell University, Ithaca, NY, USA
Barbara Clancy, Department of Biology, University of Central Arkansas, ConWay, AR, USA.
References
- Ashwell KW, Waite PM, Marotte L. Ontogeny of the projection tracts and commissural fibres in the forebrain of the tammar wallaby (Macropus eugenii): timing in comparison with other mammals. Brain, Behavior and Evolution. 1996;47:8–22. doi: 10.1159/000113225. [DOI] [PubMed] [Google Scholar]
- Clancy B. Practical use of evolutionary neuroscience principles. The Behavioral and Brain Sciences. 2006;29:14–15. [Google Scholar]
- Clancy B, Darlington RB, Finlay BL. The course of human events: predicting the timing of primate neural development. Developmental Science. 2000;3:57–66. [Google Scholar]
- Clancy B, Darlington RB, Finlay BL. Translating developmental time across mammalian species. Neuroscience. 2001;105:7–17. doi: 10.1016/s0306-4522(01)00171-3. [DOI] [PubMed] [Google Scholar]
- Clancy B, Finlay BL, Darlington RB, Anand KJ. Extrapolating brain development from experimental species to humans. Neurotoxicology. 2007a;28:931–937. doi: 10.1016/j.neuro.2007.01.014. [DOI] [PMC free article] [PubMed] [Google Scholar]
- Clancy B, Kersh B, Hyde J, Darlington RB, Anand KJ, Finlay BL. Web-based method for translating neurodevelopment from laboratory species to humans. Neuroinformatics. 2007b;5:79–94. doi: 10.1385/ni:5:1:79. [DOI] [PubMed] [Google Scholar]
- Darlington RB, Dunlop SA, Finlay BL. Neural development in metatherian and eutherian mammals: variation and constraint. The Journal of Comparative Neurology. 1999;411:359–368. [PubMed] [Google Scholar]
- Finlay BL, Darlington RB. Linked regularities in the development and evolution of mammalian brains. Science. 1995;268:1578–1584. doi: 10.1126/science.7777856. [DOI] [PubMed] [Google Scholar]
- Finlay BL, Darlington RB, Nicastro N. Developmental structure in brain evolution. The Behavioral and Brain Sciences. 2001;24:263–307. [PubMed] [Google Scholar]
- Finlay BL, Hersman MN, Darlington RB. Patterns of vertebrate neurogenesis and the paths of vertebrate evolution. Brain, Behavior and Evolution. 1998;52:232–242. doi: 10.1159/000006566. [DOI] [PubMed] [Google Scholar]
- Fitzgerald M, Walker SM. Infant pain management: a developmental neurobiological approach. Nature Clinical Practice. Neurology. 2009;5:35–50. doi: 10.1038/ncpneuro0984. [DOI] [PubMed] [Google Scholar]
- McCann ME, Soriano SG. Is anesthesia bad for the newborn brain? Anesthesiology Clinics. 2009;27:269–284. doi: 10.1016/j.anclin.2009.05.007. [DOI] [PubMed] [Google Scholar]
- Meyer U, Knuesel I, Nyffeler M, Feldon J. Chronic clozapine treatment improves prenatal infection-induced working memory deficits without influencing adult hippocampal neurogenesis. Psychopharmcology. 2010;208:531–543. doi: 10.1007/s00213-009-1754-6. [DOI] [PubMed] [Google Scholar]
- Murphy, et al. Resolution of the early placental mammal radiation using bayesian phylogenetics. Science. 2001;294:2348–2351. doi: 10.1126/science.1067179. [DOI] [PubMed] [Google Scholar]
- Nagarajan R, Clancy B. Phylogenetic proximity revealed by neurodevelopmental event timings. Neuroinformatics. 2008;6:71–79. doi: 10.1007/s12021-008-9013-2. [DOI] [PMC free article] [PubMed] [Google Scholar]
- Nordquist N, Oreland L. Serotonin, genetic variability, behaviour, and psychiatric disorders—a review. Upsala Journal of Medical Sciences. 2010;115:2–10. doi: 10.3109/03009730903573246. [DOI] [PMC free article] [PubMed] [Google Scholar]
- Rosales FJ, Reznick JS, et al. Understanding the role of nutrition in the brain & behavioral development of toddlers and preschool children: identifying and overcoming methodological barriers. Nutritional Neuroscience. 2009;12:190. doi: 10.1179/147683009X423454. [DOI] [PMC free article] [PubMed] [Google Scholar]
- Rothstein S, Simkinsa T, Nuñez JL. Response to neonatal anesthesia: effect of sex on anatomical and behavioral outcome. Neuroscience. 2008;152:959–969. doi: 10.1016/j.neuroscience.2008.01.027. [DOI] [PMC free article] [PubMed] [Google Scholar]
- Sanders RD, Ma D, Brooks P, Maze M. Balancing paediatric anaesthesia: preclinical insights into analgesia, hypnosis, neuroprotection, and neurotoxicity. British Journal of Anaesthesia. 2008;101:597–609. doi: 10.1093/bja/aen263. [DOI] [PubMed] [Google Scholar]
- Skelton MR, Williams MT, Vorhees CV. Developmental effects of 3, 4-methylenedioxymethamphetamine: a review. Behavioural Pharmacology. 2008;19:91–111. doi: 10.1097/FBP.0b013e3282f62c76. [DOI] [PMC free article] [PubMed] [Google Scholar]
- Suzuki R, Shimodaira H. Pvclust: an R package for assessing the uncertainty in hierarchical clustering. Bioinformatics. 2006;22:1540–1542. doi: 10.1093/bioinformatics/btl117. [DOI] [PubMed] [Google Scholar]
- Thompson BL, Stanwood GD. Pleiotropic effects of neurotransmission during development: modulators of modularity. Journal of Autism and Developmental Disorders. 2009;39:260–268. doi: 10.1007/s10803-008-0624-0. [DOI] [PMC free article] [PubMed] [Google Scholar]
- Vorhees CV, Schaefer TL, Williams MT. Developmental effects of ±3, 4-methylenedioxy ethamphetamine on spatial versus path integration learning: effects of dose distribution. Synapse. 2007;61:488–499. doi: 10.1002/syn.20379. [DOI] [PMC free article] [PubMed] [Google Scholar]


