

Abstract
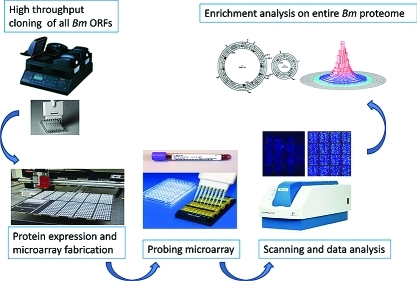
A complete understanding of the factors that determine selection of antigens recognized by the humoral immune response following infectious agent challenge is lacking. Here we illustrate a systems biology approach to identify the antibody signature associated with Brucella melitensis (Bm) infection in humans and predict proteomic features of serodiagnostic antigens. By taking advantage of a full proteome microarray expressing previously cloned 1406 and newly cloned 1640 Bm genes, we were able to identify 122 immunodominant antigens and 33 serodiagnostic antigens. The reactive antigens were then classified according to annotated functional features (COGs), computationally predicted features (e.g., subcellular localization, physical properties), and protein expression estimated by mass spectrometry (MS). Enrichment analyses indicated that membrane association and secretion were significant enriching features of the reactive antigens, as were proteins predicted to have a signal peptide, a single transmembrane domain, and outer membrane or periplasmic location. These features accounted for 67% of the serodiagnostic antigens. An overlay of the seroreactive antigen set with proteomic data sets generated by MS identified an additional 24%, suggesting that protein expression in bacteria is an additional determinant in the induction of Brucella-specific antibodies. This analysis indicates that one-third of the proteome contains enriching features that account for 91% of the antigens recognized, and after B. melitensis infection the immune system develops significant antibody titers against 10% of the proteins with these enriching features. This systems biology approach provides an empirical basis for understanding the breadth and specificity of the immune response to B. melitensis and a new framework for comparing the humoral responses against other microorganisms.
Keywords: Brucella melitensis, enriching features, immune response, protein microarray
Short abstract
We describe a system biology approach using full proteome Brucella melitensis protein microarray and identified reactive antigens. Analysis on all reactive antigens revealed certain enriching features, and one-third of the proteome contains the enriching features that account for 91% of the differentially reactive antigens recognized. This approach substantially enhances the understanding of the immune response to Bm and provides a systems biology foundation for comparing antigenicity of other pathogens.
Introduction
A major component of the adaptive immune response to infection is the generation of protective and long-lasting humoral immunity, but factors governing selection of the particular antigens recognized are unclear.1,2 It is not uncommon for viruses encoding a small number of proteins to generate antibodies against each encoded protein. But for infectious agents containing hundreds or thousands of proteins only a subset of the proteome is recognized and little is known about the extent or the characterisitics of this subset of antigens. Methods for making a complete empirical accounting of the immunoproteome have limitations, particularly when the genome of the organism is large. Here we describe a B. melitensis proteome microarray that enables this problem to be directly addressed by applying an unbiased systems biology approach to identify immunodominant and serodiagnostic antigens and to classify the reactive antigens based on functional and physical properties.
Protein microarrays can be used with relative ease to probe the entire proteome of different infectious microorganisms including bacteria, viruses and parasites.3−13 This approach permits assessing the repertoire of antibodies produced in response to infections or vaccinations from large collections of individual patient sera, and can be used to perform large-scale sero-epidemiological and sero-surveillance analyses not possible with other technologies, while consuming small quantities (<2 μL) of each serum sample. Probing large numbers of patient specimens empowers the statistical tests resulting in more reliable conclusions while correcting for false discovery required for multiple comparison testing inherent in microarray analysis.3,5,7,9 Moreover, microarrays can display all proteins of an infectious agent and may allow for identification of novel antigens, otherwise undetectable by methods like 2-D gels that are highly biased by microbial protein expression patterns.
Brucellosis is a worldwide zoonosis caused by bacteria of the genus Brucella. Brucella melitensis, the most virulent species infecting humans, also infects goats, sheep and cattle,14−16 in Central and South America, the Middle East, East Asia, and some southern European countries.17,18 Consumption of animal products, direct animal contact and inhalation of aerosolized bacteria in the laboratory setting (indicating the potential for air-borne spread via a bioterrorism-type attack) are well-recognized routes of infection. The current knowledge of protein antigens recognized by humans and reservoir animals is based on limited numbers of studies on Brucella melitensis and Brucella abortus.19−31
We recently constructed a pilot proteome array consisting of 1406 B. melitensis proteins and observed marked differences in immune responses between humans and goats.5 Here we have expanded our previous study to the full proteome microarray consisting of 3046 B. melitensis proteins, by including expression of newly cloned 1640 Bm genes. In addition to developing a better classifier capable of predicting disease based on serological response, more importantly, this study allows an estimate of the extent of immune reactivity against the whole proteome, and prediction of proteomic features that may dictate immune recognition for other yet uncharacterized gram-negative bacteria.
Materials and Methods
Ethics Statement
Human sera were obtained from patients enrolled in a prospective clinical study of brucellosis in Lima, Peru. The human subjects part of the study was approved by the Humans Research Protections Committee of the University of California San Diego, the Comite de Ética of Universidad Peruana Cayetano Heredia, Lima, Peru and the Comite de Ética of Asociación Benéfica PRISMA, Lima, Peru, all of whom have maintained federal wide assurances with the United States Department of Health and Human Services. All patients provided written informed consent prior to enrollment in the study, and signed consent forms have been stored in locked files in study offices at UPCH and AB PRISMA, Lima, Peru.
Human Serum Samples
Human sera were obtained from patients in Lima, Peru. All patients in this studywere infected with B. melitensis biovar 1. Forty- two patients were confirmed to have acute brucellosis by positive culture, positive Rose Bengal test and by tube agglutination tests titers ≥1/160. Eighteen patients presenting with brucellosis-compatible syndromes were culture negative and Rose Bengal positive, and treated according to standard antibiotic therapy within 2 days of serum sampling. Additional control patient samples included 13 sera from Rose Bengal-negative patients, 44 samples from ambulatory healthy controls from north Lima where brucellosis occasionally affects patients, and sera from humans in the U.S. where brucellosis is not found.
Brucella melitensis Lipopolysaccharide Purification
Approximately 10 g of autoclaved pellet of B. melitensis 16 M were used to isolate LPS using the hot phenol-water method.32 The purified LPS was treated with RNase, DNase and Proteinase-K, and the hot phenol-water treament was repeated. B. melitensis LPS obtained from both upper phenol saturated aqueous layer (aqueous phase) and lower water saturated phenol layer (phenol phase) were pooled. LPS from E. coli 055:B5 was purchased from Sigma Chemicals (St. Louis, MO). The LPS from E. coli 055:B5 and B. melitensis 16 M were analyzed on a gradient 4–12% Tris-Glycine sodium dodecyl sulfate (SDS) polyacrylamide gel (Invitrogen Corp., Carlsbad, CA) under reducing conditions. The presence of LPS in the gels was detected with a periodic acid silver stain33 and protein using Coomassie blue stain. B. melitensis LPS was quantified using a colorimetric assay to measure 2-keto-3-deoxyoctonate (KDO) concentration.34E. coli 055: B5 LPS (Sigma, St. Louis, MO) was used as standard.
Microarray Fabrication, Probing and Immunostrips Probing
All ORFs from Brucella melitensis 16 M genomic DNA were identified using GenBank NC_003317 and NC_003318, and 1640 ORFs that were absent from pilot chip were amplified and cloned using a high-throughput PCR and recombination cloning method described previously.5 Microarrays and immunostrips were fabricated and probed as described before.5 Plasmids were expressed at 24 °C for 16 h in in vitro transcription/translation E. coli reactions (Expressway Maxi kits from Invitrogen), according to the manufacturer’s instructions. For microarrays, 10 μL of reaction was mixed with 3.3 μL 0.2% Tween 20 to give a final concentration of 0.05% Tween 20, and printed onto nitrocellulose coated glass FAST slides (Whatman) using an Omni Grid 100 microarray printer (Genomic Solutions). For immunostrips, B. melitensis LPS was printed at 0.01 mg/mL. All antigens were printed on Optitran BA-S 85 0.45 μm Nitrocellulose membrane (Whatman) using BioJet dispenser (BioDot) at 1 μL/cm, and cut into 3 mm strips. Human sera samples were diluted to 1:200 with 10 mg/mL E. coli lysate (Mclab). Microarray slides were incubated in biotin-conjugated secondary antibody (Jackson ImmunoResearch) diluted 1/200 in blocking buffer, and detected by incubation with streptavidin-conjugated SureLight P-3 (Columbia Biosciences). The slides were washed and air-dried by brief centrifugation. Microarray slides were scanned and analyzed using a Perkin-Elmer ScanArray Express HT microarray scanner. Intensities were quantified using QuantArray software. All signal intensities were corrected for spot-specific background. For immunostrips probing, human sera were diluted to 1/200 in 5% BSA solution containing 20% E. coli lysate (McLab). Strips were then incubated in alkaline phosphatase conjugated donkey antihuman immunoglobulin (anti-IgG, Fcγ fragment-specific, Jackson ImmunoResearch) secondary antibody, diluted to 1/2000, and reactive bands were visualized by incubating with 1-step Nitro-Blue Tetrazolium Chloride/5-Bromo-4-Chloro-3′-Indolyphosphate p-Toluidine Salt (NBT/BCIP) developing buffer (Thermo Fisher Scientific). Immunostrips were scanned with Hewlett-Packard document scanner, and were quantified using Image J software.
Mass Spectrometry Data Set from Pathogen Portal Web Site
The mass spectrometry data set “characterization of host and pathogen proteins affected by Brucella abortus infection” was from Caprion Proteomics studies of B abortus, downloadable from pathogen portal web site hosted by proteomics resource center at http://www.pathogenportal.org/portal/portal/PathPort/Home. Samples were processed for “intact bacteria” or “cell envelope” preparations from exponentially growing bacteria according to the Caprion protocol 24401 and 24302, as described before.23,35 Briefly, to process intact bacteria for MS analysis,
50 μL aliquots of 20 μg protein samples were denatured in 50 mM ammonium bicarbonate (Sigma-Aldrich, St. Louis, MO) containing 8 M urea. After sonication, samples were centrifuged at 2000× g for 1 min and a 950 μL cold (−20 °C) chloroform/methanol solution (2:1 v/v) were added. Samples were vortex mixed and incubated at −20 °C for 2 h. Subsequently, 100 μL cold (−20 °C) methanol was added and samples were clarified by centrifugation at 21 000× g for 10 min at 4 °C. The supernatants were dried under vacuum, resuspended in 100 mM ammonium bicarbonate containing 8 M urea and 1% (w/v) of acid-labile surfactant (ALS; Waters, Milford, MA) and sonicated for 10 min. After centrifugation for 20 s at 2000× g, samples were incubated for 1 h at ambient temperature. A volume of 450 μL of 100 mM ammonium bicarbonate containing 5% (v/v) of acetonitrile was added. Lys-C (Wako, Richmond, VA) was added to yield a 1:50 enzyme to protein ratio. The samples were incubated for 3 h at 37 °C. Trypsin (Promega, Madison, WI) was then added at a 1:50 enzyme to protein ratio and samples were incubated for an additional 16 h. Following proteolysis, TCEP (Pierce, Rockford, IL) was added to a final concentration of 10 mM and samples were incubated for 30 min at ambient temperature and then lyophilized. To cleave the acid labile surfactant, samples were incubated for 30 min at ambient temperature in 100 μL of 1 N HCl and 100 μL of water were added into each sample with subsequent incubation for another half hour at ambient temperature. To process cell envelope for MS analysis, supernatants of exponentially growing B. abortus strains were clarified, centrifuged at 100 000× g for 6 h at 4 °C, pellets resuspended in double distilled water. The sample was sonicated, and 50 mM ammonium bicarbonate containing 2% acid-labile surfactant and 8 M urea were added. The sample was vortex mixed for 1 h. A sample of 50 μL of the OM suspension was added to a final volume of 1 mL of a chloroform/methanol solution (2:1 v/v). The sample was vortex mixed and incubated at −20 °C for 2 h. Subsequently, 100 μL of cold methanol (−20 °C) was added, and the sample was cleared by centrifugation for 10 min at 21 000× g. The supernatant was dried under vacuum and resuspended in 4 M urea; 50 mM ammonium bicarbonate pH 8.0. Lys-C was added at a 1:50 protein ratio. The samples were then diluted 4:1 with 50 mM ammonium bicarbonate buffer pH 8.0, and trypsin was added at a 1:25 protein ratio for an additional 16 h. Following proteolysis, the samples were distributed into 96-well plates for mass spectrometry analysis.
Peptide digests were analyzed by liquid chromatography coupled to mass spectrometry (LC-MS) as described.23,35,36 The LC–MS system consisted of a CapLC (Waters, Milford, MA) with a cooled autosampler and a QTOF Ultima (Waters, Milford, MA) controlled by MassLynx version 4.0 software. The peptide concentrations were normalized and the samples were injected into a reversed-phase column (Jupiter C18, Phenomenex, Torrance, CA) for HPLC separation. Protein identification was done by submitting LC–MS spectra to Mascot software (MatrixScience, Boston, MA) for searching against the National Center for Biotechnology Information protein database (NCBI). The parameters used for Mascot search and protein homology clustering were previously detailed.23,35 Numbers of different peptides for each identified protein were counted and listed in Table S4 (Supporting Information).
Data Analysis
Data analysis was performed using the R (http://www.r-project.org) and SAS (http://www.sas.com/) statistical software. It has been noted in literature that data derived from microarray platforms is heteroskedatic.37−39 To stabilize the variance,40,41 the vsn normalization method implemented as part of the Bioconductor suite (www.bioconductor.org) was applied to the quantified array intensities. In addition to removing heteroskedacity, this procedure corrects for nonspecific noise effects by finding maximum likelihood shifting and scaling parameters for each array such that control probe variance is minimized. This calibration has been shown to be effective on a number of platforms.42
Differentially reactive proteins between groups were determined using a Bayes regularized t test adapted from Cyber-T for protein arrays,37,43 which has been shown to be more effective than other differential expression techniques.44 To account for multiple comparison conditions, the Benjamini and Hochberg (BH) method was used to control the false discovery rate.45 After Benjamini and Hochberg correction, p-value smaller than 0.05 was considered significant, and the corresponding protein was considered differentially reactive and serodiagnostic. Multiplex classifiers were constructed using linear and nonlinear Support Vector Machines (SVMs) using the “e1071” R package. Plots of receiver operating characteristic (ROC) curves were made with the “ROCR” R package. Sensitivity specificity and Area Under the Curve (AUC) were determined from the resulting ROC curves. Principle Component Analysis (PCA) to visually reduce and summarize signal intensity variance among the subjects was conducted in JMP software (www.JMP.com).
Hierarchical clustering was used to group sera samples into subsets, such that those within each cluster (subset) are more closely related to one another than samples assigned to other clusters. Clustering is based on the degree of similarity between the protein intensity for each individual. MeV v4.6 (TM4Microarray Software Suite, www.tm4.org) was used to perform the clustering analysis.
The following programs were utilized for computational prediction. TMHMM v2.0 was utilized for transmembrane domains prediction46 (http://www.cbs.dtu.dk/services/TMHMM/), SignalP v3.0 for signal peptide prediction47 (http://www.cbs.dtu.dk/services/SignalP/), PSORTb v3.0. software for cellular location prediction48 (http://www.psort.org/psortb/). PI/MW tool from Swiss Institute of Bioinformatics was used to determine isolectric point (http://ca.expasy.org/tools/pi_tool.html). P value for enrichment statistical analysis was calculated using Fisher’s exact test in the R environment.
Results
Gene Amplification, Cloning and Protein Expression
The 3198 predicted ORFs of B. melitensis (Bm) 16 M were subjected to amplification from genomic DNA, and 1406 ORFs were cloned and printed on pilot chip.5 In this study, another 1640 ORFs were successfully cloned using our high throughput recombination method. About one-fourth of the cloned genes were sequenced and >99% of sequenced clones had the correct sequence. All 3046 Bm ORFs cloned in pXT7 vector (>95% of proteome) were expressed under T7 promoter in the E. coli in vitro transcription/translation system, and printed on microarrays. Over 98% of protein spots were confirmed positive for expression (Figure S1A, Supporting Information).
Human Antibody Profile
Bm protein arrays were probed with sera from acute brucellosis patients in Lima, Peru obtained within 1–3 weeks of the onset of symptoms, and sera from Bm culture-positive humans (Figure S1B, Supporting Information) showed robust reactivity against a collection of antigens compared to unexposed individuals. Among the 3046 antigens tested, 1464 antigens reacted with at least one culture positive individual, accounting for 48% of the proteome (Figure 1). Within this immunoproteome, 122 protein antigens were defined “serodominant”, with mean reactivity greater than the mean of the no DNA controls plus 2.5 standard deviations among culture positive individuals (Figure 2, Figure S2 and Table S1, Supporting Information). Of these, 33 protein antigens were serodiagnostic, and were significantly differentially reactive between naïve and culture positive patients from Peru (Benjamini and Hochberg adjusted Cyber-T p-value <0.05). Most of these antigens also reacted strongly with sera from brucellosis cases that were culture negative but positive for the Rose Bengal diagnostic test. An unbiased hierarchical clustering analysis segregated most of the individual specimens into two groups, with a few infected cases with weak reactivity sporadically clustered among samples diagnosed as uninfected (Figure S2, Supporting Information). Peruvian naïve samples exhibited very low responses to this collection of antigens. We also identified 90 cross-reactive antigens that reacted similarly among all human samples, whether from naïve individuals or individuals diagnosed to be infected.
Figure 1.

Reactivity of the Immunoproteome. Each bar represents one of the 3046 proteins of B.melitensis. The bar height reflect the number of sera reactive to each protein. Nonreactive proteins account for approximately 52% of the proteome. The raised bars of any color represent 1464 reactive proteins, which define the immunoproteome (approximately 48% of the proteome). There are 538 antigens reactive in 1 sample, 648 antigens reactive in 2–5 samples, 143 antigens reactive in 6–9 samples and 135 antigens reactive in 10–42 samples. BMEI0536 and BMEI1079 reacted in all 42 Bm culture positive samples. All serodiagnostic antigens except BMEI0503 reacted in 10–42 samples; BMEI0503 reacted in 9 samples.
Figure 2.

Discovery of new human serodiagnostic antigens by probing the full B. melitensis proteome arrays with a collection of B. melitensis Peruvian naïve and culture positive human sera. The mean sera reactivity of the 3046 antigens was compared between the culture positive and Peruvian naive groups. Antigens with Benjamini Hochberg corrected p-value less than 0.05 (serodiagnostic) are organized to the left and cross-reactive (BH_p > 0.05) antigens to the right. Shown are the 33 serodiagnostic protein antigens, Bm LPS, and a subset of cross-reactive antigens.
Classifier of Serodiagnostic Antigens
We performed unsupervised principal component analysis and showed that the 33 serodiagnostic antigens clearly separated the Peruvian naive from culture positive groups (Figure 3A). To further determine the accuracy of distinguishing brucellosis cases from controls, cross-validation receiver operating characteristic (ROC) curves and area under the curve (AUC) boxplots were generated (Figure 3). The serodiagnostic antigens were ranked by decreasing single antigen AUC. The top four ORFs, BMEI0536 (bp26), BMEI0805 (hypothetical protein), BMEI1330 (protease Do), and BMEI 1890 (transporter), as wells as Bm LPS, all have an individual antigen AUC greater than 0.90 (Table S1, Supporting Information). Three of the antigens were identified previously on microarrays.5 Antigen bp26 (BMEI0536; AUC 0.991; BH p-value < 1 × 10–16) gave the best single antigen discrimination with 95% sensitivity and specificity rate. We used kernel methods and support vector machines43,49 to build linear and nonlinear classifiers. Variability and mean value of accuracy from this model has been shown in the AUC boxplot. The top 5 antigens all produced sensitivity and specificity over 96% (Figure 3C). With the top 3 antigens, this classifier yielded a highest sensitivity and specificity rate of 98.6 and 98.6%, respectively. Altogether 33 protein antigens plus LPS produced sensitivity and specificity over 93%.
Figure 3.

Statistical presentation of principal component analysis and multiple antigens AUC. (A) Unsupervised principal component analysis of the signal intensity for samples from Peruvian naives and culture positive groups revealed that these two groups could be segregated on the basis of 33 selected serodianosis protein antigens and 2 Bm LPS (at 0.1 mg/mL or 0.01 mg/mL). The serodiagnostic antigens were ranked by single antigen AUC. (B) Cross-validation AUC boxplot with variance and mean value and (C) cross-validation ROC graphs show classifiers with increasing number of human serodiagnostic antigens. With the top 3 antigens, this classifier yielded a highest sensitivity and specificity rate of 98.6% and 98.6%, respectively. All 33 antigens plus Bm LPS also produced sensitivity and specificity over 93%.
Validation of Serodiagnostic Accuracy with Immunostrips
Eighteen serodiagnostic proteins and Bm LPS were printed onto nitrocellulose membranes using a BioDot jet dispenser. The membrane was then cut into 3 mm strips. The individual strips were probed with 31 different randomly selected culture positive sera and 31 Peruvian naive sera. Brucellosis patients reacted strongly against the serodiagnostic antigens with variable signal intensities among the patients. Naïve samples showed much lower reactivity against these serodiagnostic antigens (Figure 4A). The ROC curve (Figure 4B) shows that this immunostrip test yielded a high AUC of 0.97, with sensitivity rate of 96.7% and specificity rate of 96.7%.
Figure 4.

Immunostrips probing. (A) Eineteen serodiagnostic antigens and Bm LPS at 0.01 mg/mL were printed onto nitrocellulose membrane in adjacent stripes using a BioDot jet dispenser as described in Materials and Methods. Strips were probed with culture positive or Peruvian naive sera diluted 1/200 followed by alkaline phosphatase conjugated secondary antibody and enzyme substrate. Weak reactivity in the naïve healthy controls can be distinguished from the strong reactivity in the infected group. (B) Cross-validation ROC curve was generated and sensitivity and specificity of immunostrips test is 96% and 96%, respectively.
Comparing Blood Culture and Serological Testing by Agglutination
Serological tests are routinely used to diagnose brucellosis. While the qualitative agglutination test (Rose Bengal) is ∼90% sensitive for screening for acute/subacute brucellosis,50,51 quantitative agglutination testing (e.g., tube agglutination test (TAT)) with titer typically greater than 1/160 used as a more precise diagnostic criterion, can also be used to diagnose relapse. Often blood cultures are negative at the time of initial presentation or relapse, possibly because of low levels of bacteremia or antecedent use of antibiotics. Without being able to ascertain whether the sera used in this study were obtained from patients who might have taken antibiotics prior to blood cultures, we queried our data set to determine whether sera from blood culture-positive, Rose Bengal positive brucellosis patients (gold standard diagnosis) vs blood culture-negative, Rose Bengal positive (TAT not done) subjects (presumptive positive, unconfirmed) recognized different proteins on the protein microarrays. Sera from blood culture-negative, Rose Bengal positive subjects reacted with 10 B. melitensis antigens much more strongly than blood culture-positive, Rose Bengal positive individuals (Figure S3, Supporting Information). This unique set of 10 antigens was distinct from the 33 antigens that distinguish culture positive cases from Peruvian naïves. (Table S2, Supporting Information). These results indicate that protein microarray analysis was able to delineate distinct antibody profiles in blood culture positive and negative patients, which has the potential to identify antigens capable of differentiating active acute/subacute brucellosis from previously exposed patients. These findings may suggest novel biological interactions between bacteria and host that need to be further explored because culture negativity/Rose Bengal seropositivity might be associated with some biological difference between human hosts, perhaps an immune response that might lower bacterial loads to levels difficult to culture from blood. Alternatively, it is possible that antibiotic use might lead to an altered host immune response to killed bacteria that no longer would subvert the host immune responses (typical of intracellular pathogens such as Brucella).52−54
Enrichment Analysis
To better understand the determinants of antigenicity in bacteria, we performed a functional enrichment analysis of the serodominant and serodiagnostic antigens identified in this study. Bm proteins are annotated with NCBI Clustered Orthologous Group (COG) functional category. A total of 543 proteins are unassociated with COGs, and 39 proteins are associated with COGs but have not been assigned to a category, shown as “Other COGs”. Some proteins have multiple COG assignments so there are 3,291 COGs in total for 3046 proteins on chip.
Proteins with predicted COG- U function, involved in intracellular trafficking and secretion, were 6.2- fold enriched in serodiagnostic antigens and 4.3- fold enriched in serodominant antigens. The enrichment was significant with p value <0.05. Proteins in the COG-M category, cell envelope biogenesis and outer membrane, were 2-fold enriched in serodominant antigens (p-value 0.01). Proteins in COG-N category, cell motility and secretion, were 3.5-fold enriched in serodominant antigens (p = 0.027). Proteins with predicted COG-O function, posttranslational modification, protein turnover, chaperones, were also significantly enriched at 3.0-fold in serodominant antigens. There was only 1 serodominant antigen out of 176 COG-K category proteins, predicted to be involved in transcription and identified as serodominant, which was 0.1- fold enrichment and significantly underrepresented with p value of 0.014 (Figure 5A, Table S3A, Supporting Information).
Figure 5.

Overview of an enrichment analysis of Bm proteome classified with COGs and computational predictions categories. (A) Overview of Bm proteome classified with a total of 3291 COGs. The size of each slice represents the number of proteins assigned to each COG category. Proteins classified with COGs-U, M, N, O categories are significantly overrepresented in serodominant antigens and shown in extracted red. COG-K proteins are significantly underrepresented in serodominant antigens are shown in extracted black. COG categories with <5 proteins were not included in the figure (COGs-B, W). (B) Computational predictions for the Bm proteome are shown. Significant over- and under-representations are shown in extracted red or black, respectively. Numbers of serodominant antigens within these categories/number of total proteins within these categories are in parentheses in the legend. Results of the complete COG analysis and computational predictions are in Table S3 (Supporting Information). (C) Correlation between enrichment fold and peptide numbers detected by Mass Spectrometry. As peptide numbers for serdiagnostic antigens increase, enrichment fold for serodiagnostic antigens also increases. In contrast, enrichment fold for cross-reactive antigens decreases as peptide numbers for cross-reactive antigens increase.
We also looked at enrichment of antigens using computationally predicted features. As shown in Figure 5B and Table S3B (Supporting Information), proteins with 1 transmembrane domain were significantly enriched in serodominant, serodiagnostic and cross-reactive antigens groups, with enrichment fold at 4.3, 5.0, and 4.0, respectively. Proteins lacking transmembrane domains were significantly underrepresented. Interestingly, proteins with more than 1 transmembrane domain were also significantly underrepresented among the serodominant and cross-reactive antigens. Proteins with predicted signal peptides (SignalP score > 0.7) were significantly enriched in all three groups at a range of 2.8- to 3.6-fold. Conversely, proteins without signal peptides (SignalP score < 0.7) were significantly underrepresented. pSortb predicted 4 serodiagnostic and 5 serodominant outermembrane antigens, resulting in 11.5- and 3.9-fold enrichment, respectively. pSortb periplasmic proteins were also significantly enriched, from 3.1- to 4.2-fold. However, pSortb cytoplasmic proteins were 0.5- to 0.7-fold underrepresented in serodominant and serodiagnostic antigens groups. We also found that proteins with isoelectric points lower than 5 were 1.7- to 2.0-fold enriched in serodominant and cross-reactive antigen groups, whereas, proteins with pI = 9 to 14 were 0.6- and 0.5-fold underrepresented in these two groups.
Another potential feature that could account for protein antigenicity is the level of in vivo expression; proteins expressed at a high level in vivo would be expected more likely to be seen by the immune system than proteins expressed at a low level. To test this hypothesis, we compared the group of antigenic B. melitensis proteins with an existing data set of expressed protein peptide data from a very closely related species, B. abortus.23,35,36 In this study, cytosolic proteins and cell envelope proteins from B. abortus in the log phase of in vitro growth, were extracted and subjected to LC–Mass spectrometry (MS) analysis as described in Materials and Methods. The number of different peptides identified for each protein was listed in Table S4 (Supporting Information). Two-hundred forty proteins were exclusively expressed in the cytosol of B. abortus with 1 to12 detected peptides, and 53 proteins exclusively expressed in the cell envelope of B. abortus with 1 to 15 detected peptides, and 80 overlapping proteins expressed in both conditions. Of these, 356 proteins were printed on our proteome chip. Not surprisingly, expression was a significant enriching feature with 5.2-fold enrichment among serodiagnostic antigens (p-value 1.87 × 10⁻¹¹), and 2.9-fold in serodominant antigens (p-value 5.28 × 10⁻¹¹) (Table 1). Interestingly, the fold enrichment was directly proportional to the number of peptides detected (Figure 5C). There was 8.4- fold enrichment of serodiagnostic antigens in proteins detected with more than 1 peptide (p-value 3.56 × 10⁻¹²), 16.2- fold in proteins detected with 5 or more peptides (p-value 1.30 × 10⁻⁷), 23.1- fold enrichment in proteins detected with 7 or more peptides (p-value 1.90 × 10⁻⁵), and 20.5-fold enrichment in proteins detected with 9 or more peptides (p-value 3.91 × 10⁻³). Conversely, proteins that were not identified by MS were significantly underrepresented at 0.4-fold among the serodiagnostic and 0.8-fold among serodominant antigens. The data suggests that protein expression level is an important factor contributing to antigenicity of protein antigens. This was also supported by data in other experimental systems from different research groups.55
Table 1. Enrichment Analysis for B. abortus Homolog Proteins Expressed during in vitro Growth As Detected by Mass Spectrometrya.
| proteins | serodominant |
serodiagnostic |
cross-reactive |
|||||||
|---|---|---|---|---|---|---|---|---|---|---|
| B. abortus homologs expression | on chip | hits | FoldEnrich | p-value | hits | FoldEnrich | p-value | hits | FoldEnrich | p-value |
| Expressed and detected with at least 1 peptide | 356 | 41 | 2.9 | 5.28E-11 | 20 | 5.2 | 1.87E-11 | 21 | 2.0 | 0.001 |
| Expressed and detected with at least 2 peptides | 175 | 23 | 3.3 | 2.04E-07 | 16 | 8.4 | 3.56E-12 | 7 | 1.4 | 0.353 |
| Expressed and detected with at least 5 peptides | 40 | 8 | 5.0 | 1.38E-04 | 7 | 16.2 | 1.30E-07 | 1 | 0.9 | 1.000 |
| Expressed and detected with at least 7 peptides | 16 | 4 | 6.2 | 3.07E-03 | 4 | 23.1 | 1.90E-05 | 0 | 0.0 | 1.000 |
| Expressed and detected with at least 9 peptides | 9 | 2 | 5.5 | 4.76E-02 | 2 | 20.5 | 3.91E-03 | 0 | 0.0 | 1.000 |
| Not expressed | 2690 | 81 | 0.8 | 5.28E-11 | 13 | 0.4 | 1.87E-11 | 68 | 0.9 | 0.001 |
| Total ORFs | 3046 | 122 | 33 | 89 | ||||||
Significant enrichment or underrepresentation for certain features are underlined and bold.
There are a total of 10 enriching features that fall into 3 categories: (i) functionally annotated COGs U, M, N and O, (ii) computationally predicted features (TMHMM = 1, SignalP > 0.7, pSort Outermembrane, pSort Periplasmic, and pI < 5), and (iii) MS evidence of expression. The Venn diagrams summarize the number of enriched proteins found in each of these 3 categories, showing overlap among the proteins found in each category (Figure 6). There are 338 proteins in the enriched COG categories, 696 computationally predicted proteins, and 356 proteins that were positive by MS (Table 2). Accounting for the overlap between categories, 1128 proteins in all enriched categories represented 37% of the proteome. The microarray results empirically identified 33 serodiagnostic antigens and 89 cross-reactive antigens. COGs accounted for 30% of the serodiagnostic hits, the computationally predicted features accounted for 61% of the hits, and MS positive proteins contained 61% of the hits. All together the three categories account for 37% of the proteome and include 91% of the serodiagnostic antigens. But there is only 1 unique serodiagnostic COG antigen that is not represented in either the computationally predicted or MS+ categories (BMEI1060, Table S1, Supporting Information). So by combining the pool of computationally predicted and MS+ proteins representing 30% of the proteome, 88% of the serodiagnostic antigens can be predicted.
Figure 6.

Venn diagram of numbers of antigens with categorized enriching features. Enriching features are classified into three categories: (1) COGs-UMNO, for proteins assigned to one or more of these four COGs; (2) Computational predictions with enriching features, for proteins predicted to have one or more of the following features, that is, TMHMM = 1, SignalP > 0.7, pSort Outermembrane, pSort Periplasmic, or pI < 5, and (3) Protein expression as detected by peptide presence in Mass Spectrometry. Separately shown are numbers of antigens with enriching features, including all such 1128 antigens on chip, 99 serodominant, and 30 serodiagnostic antigens. Numbers of antigens having more than one category of enriching features are also presented in the overlapping region of such categories.
Table 2. Enrichment Summary for Antigens with Categorized Enriching Featuresa.
| whole genome (3046 on chip) |
cross-reactive (89 total) |
serodiagnostic (33 total) |
||||
|---|---|---|---|---|---|---|
| enriching features | predicted | % of total | predicted | % of total | predicted | % of total |
| COGs-U, M, N, O | 338 | 11% | 27 | 30% | 10 | 30% |
| Computationally Predicted | 696 | 23% | 47 | 53% | 20 | 61% |
| Mass Spectrometry Positive (MS+) | 356 | 12% | 21 | 24% | 20 | 61% |
| COGs + Predicted | 919 | 30% | 60 | 67% | 22 | 67% |
| COGs + Predicted + MS+ | 1128 | 37% | 69 | 78% | 30 | 91% |
| Predicted + MS+ | 925 | 30% | 58 | 65% | 29 | 88% |
Enriching features are classified into three categories: (1) COGs-UMNO, for proteins assigned to one or more of these four COGs; (2) Computational predictions with enriching features, for proteins predicted to have one or more of the following features, i.e., TMHMM = 1, SignalP > 0.7, pSort Outermembrane, pSort Periplasmic, or pI < 5; and (3) Protein expression as detected by mass spectrometry. Numbers of overlapping antigens for two or three categories are shown in Figure 6.
Discussion
Today with increasing efficiency, accuracy and speed we access completed genome sequences from thousands of infectious microorganisms. However, systems- level studies to understand the complete network of antibody responses have not been widely performed. This work was motivated by the disturbing lack of a detailed scientific understanding of the antibody responses to infectious diseases. We have been taking a systems biology approach to account for all of the antibodies that develop after exposure to infectious microorganisms and to identify specific antibody signatures associated with each disease, in order to understand the molecular basis for antigen selection by the immune system and to predict serodiagnostic and vaccine antigens targets.
This study is the first full proteome-wide serological analysis of B. melitensis. Our previous study identified a set of serodiagnostic antigens from a randomly selected half of the B. melitensis proteome. However, an important difference between the present study and this previous report is that analysis of the complete proteome not only has allowed us to delineate additional serodiagnostic antigens but, more fundamentally, also provided the basis for a rigorous, comprehensive and quantitative determination of basic biological characteristics of the entire set of the serodominant antigens on a genomic level.
The current standard serological screening assay, an agglutination test that uses tinted, killed bacteria as antigen (Rose Bengal) is based primarily on identification of antibodies to LPS in patient serum. In the present microarray study, we confirmed LPS reactivity (with purified LPS spotted onto the microarray), and identified novel protein antigens. The signature antigens were validated using traditional Western blots. Although antibody responses against all 33 protein antigens used together can predict disease with 92% accuracy, using the serological responses against the top 3 individual antigens together improves accuracy to >98% for diagnosis of acute human brucellosis. One limitation is that the humans studied here only had acute or subacute brucellosis-fever but not focal or chronic disease. Future studies are needed to assess suspected cases that are agglutination test negative, for example chronic neurobrucellosis or focal disease such as orchitis or vertebral osteomyelitis.
Eleven of the 33 serodiagnostic antigens identified in this study were also identified on the pilot array5 (Table S1, Supporting Information). Our findings are in good agreement with published studies that identified well characterized antigens from other Brucella spp, including Bp26 (BMEI0536),20,25,31,56 HtrA/DegP (BMEI1330),28 Omp16 (BMEI0340),29 the chaperonin GroEL protein (BMEII1048) and Omp 10 (BMEII0017).21,57 In addition to the well characterized antigens, we also identified 21 novel serodiagnostic antigens on the current array, including top antigen hypothetical protein BMEI0805. Two pyruvate dehydrogenase complex molecules and the associated acetyl CoA hydrolase, which together form a large multimeric structure consisting of 60 subunits, are also differentially recognized; this large enzyme complex is found in most bacteria and is frequently a target of immune recognition for other infections.6,58
Protein microarrays enable enrichment analyses to identify proteomic features that are enriched in the immunodominant antigen set, and development of protein antigenicity prediction tools based on enriched features. The prediction tools then can be applied on a high-throughput scale to existing or new proteomes to identify key antigenic proteins that may have serodiagnostic or protective characteristics. Enrichment analysis identified 10 proteomic features that are enriched in the serodiagnostic signature antigens. The proteomic features fall into 3 categories: (i) COG annotations, (ii) computationally predicted proteomic features, and (iii) proteins with MS evidence of expression in viable organisms. No single proteomic feature or category of features is sufficient to identify all these signature antigens. Our data suggests that cloning of 37% of genome with these enriching features would reveal more than 90% of serodiagnostic antigens. We have classified the reactive immunodominant antigens for numerous agents and have consistently found these features predict antigenicity.6,7,10,59
These results describe the relationship between antigenicity and in vivo expression of individual proteins. In our study, we utilized the expression of proteins quantified by MS of a closely related strain, B. abortus during in vitro growth. We found that mass spec positive antigens were significantly enriched among serodiagnostic antigens but not among the cross- reactive antigens. This validates the classification of the serodiagnostic antigens being derived from actively replicating organisms, and validates the classification of cross-reactive antigens being derived from previous exposure to nonbrucellosis infections. Although the number of peptides observed per protein has been applied to estimating protein abundance,60−62 we are aware that mass spectra of cultured organisms may not reflect the expression during infection in vivo. First, nutrients are not limiting in log phase growth in vitro, whereas in vivo, Brucella is likely to be within a nutrient-limited intracellular environment.63 Second, the MS method may not be particularly quantitative, especially for membrane proteins. Our protein array technology is also able to provide strong evidence of the comprehensive set of proteins expressed in vivo within a mammalian host by B. melitensis, by virtue of their exposure to the host immune system. The expression and abundance of proteins during in vivo growth merits further examination by other novel technologies, such as measurement of transcript abundance from RNA-seq (“deep sequencing”) technique.64
The B. melitensis immunoproteome comprises 1464 antigens that are significantly reactive in at least one of the individuals in this study. Only 122 serodominant antigens are significantly recognized by most of the individuals. Answers to questions of why and how the immune system focuses on 4% of the potential target antigens are not yet apparent from this work. One might expect that an immune response against a larger collection of antigens could result in a more effective immune response attack against the infectious agent. But antibody responses against thousands of antigens from hundreds of clinical infections could accumulate during a lifetime, leading to cross reactivity against autologous antigens and autoimmune chaos. This could provide evolutionary selection pressure favoring a more focused response to infection. The observation that dozens of organism- specific antibody responses develop after B. melitensis infection is consistent with similar observations from other infectious agents, and has implications for subunit vaccine discovery and development. Mimicking the natural response to infection could be considered a viable strategy for vaccine development but most subunit vaccines aim to derive protection from immunization with only a single antigen. Attenuated or killed whole organism vaccines produce an antibody reactivity profile against dozens of antigens more similar to natural infection.6
This systematic genome scale analysis of human antibody responses against B. melitensis proteins provides a top hit list of antigens worthy of assessing for improved diagnostics, and furthermore, enables development of a predictive model of proteomic features that determine whether a protein is antigenic and produces antibodies that confer protection. This systems biology approach provides an empirical basis for understanding the breadth and specificity of the immune response to B. melitensis and a new framework for comparing the humoral responses against other organisms.
Acknowledgments
The Brucella melitensis lipopolysaccharide was kindly provided by Kailash Patra in Joseph Vinetz lab. This work was partially supported by grants from the U.S. Public Health Service, National Institutes of Health 1U01AI075420, 1K24AI068903, and D43TW007120 (J.M.V.), U01AI078213 and U54AI065359 (P.L.F.), and 5R44AI058365-05 (D.H.D.).
Supporting Information Available
Supplementary tables and figures. This material is available free of charge via the Internet at http://pubs.acs.org.
Conflict of Interest
P.L.F. and D.H.D. have patent applications pertaining to this work and own stock in Anitigen Discovery Inc. that has licensed the technology. X.L. is an inventor on these patent applications and is employed at Anitigen Discovery Inc. W.J.W.M. is employed at Anitigen Discovery Inc.
Supplementary Material
References
- Mayers C.; Duffield M.; Rowe S.; Miller J.; Lingard B.; Hayward S.; Titball R. W. Analysis of known bacterial protein vaccine antigens reveals biased physical properties and amino acid composition. Comp. Funct. Genomics 2003, 4 (5), 468–78. [DOI] [PMC free article] [PubMed] [Google Scholar]
- Rappuoli R. Reverse vaccinology, a genome-based approach to vaccine development. Vaccine 2001, 19 (17–19), 2688–91. [DOI] [PubMed] [Google Scholar]
- Kunnath-Velayudhan S.; Salamon H.; Wang H. Y.; Davidow A. L.; Molina D. M.; Huynh V. T.; Cirillo D. M.; Michel G.; Talbot E. A.; Perkins M. D.; Felgner P. L.; Liang X.; Gennaro M. L. Dynamic antibody responses to the Mycobacterium tuberculosis proteome. Proc. Natl. Acad. Sci. U.S.A. 2010, 107 (33), 14703–8. [DOI] [PMC free article] [PubMed] [Google Scholar]
- Crompton P. D.; Kayala M. A.; Traore B.; Kayentao K.; Ongoiba A.; Weiss G. E.; Molina D. M.; Burk C. R.; Waisberg M.; Jasinskas A.; Tan X.; Doumbo S.; Doumtabe D.; Kone Y.; Narum D. L.; Liang X.; Doumbo O. K.; Miller L. H.; Doolan D. L.; Baldi P.; Felgner P. L.; Pierce S. K. A prospective analysis of the Ab response to Plasmodium falciparum before and after a malaria season by protein microarray. Proc. Natl. Acad. Sci. U.S.A. 2010, 107 (15), 6958–63. [DOI] [PMC free article] [PubMed] [Google Scholar]
- Liang L.; Leng D.; Burk C.; Nakajima-Sasaki R.; Kayala M. A.; Atluri V. L.; Pablo J.; Unal B.; Ficht T. A.; Gotuzzo E.; Saito M.; Morrow W. J.; Liang X.; Baldi P.; Gilman R. H.; Vinetz J. M.; Tsolis R. M.; Felgner P. L. Large scale immune profiling of infected humans and goats reveals differential recognition of Brucella melitensis antigens. PLoS Negl. Trop. Dis. 2010, 4 (5), e673. [DOI] [PMC free article] [PubMed] [Google Scholar]
- Eyles J. E.; Unal B.; Hartley M. G.; Newstead S. L.; Flick-Smith H.; Prior J. L.; Oyston P. C.; Randall A.; Mu Y.; Hirst S.; Molina D. M.; Davies D. H.; Milne T.; Griffin K. F.; Baldi P.; Titball R. W.; Felgner P. L. Immunodominant Francisella tularensis antigens identified using proteome microarray. Proteomics 2007, 7 (13), 2172–83. [DOI] [PubMed] [Google Scholar]
- Felgner P. L.; Kayala M. A.; Vigil A.; Burk C.; Nakajima-Sasaki R.; Pablo J.; Molina D. M.; Hirst S.; Chew J. S.; Wang D.; Tan G.; Duffield M.; Yang R.; Neel J.; Chantratita N.; Bancroft G.; Lertmemongkolchai G.; Davies D. H.; Baldi P.; Peacock S.; Titball R. W. A Burkholderia pseudomallei protein microarray reveals serodiagnostic and cross-reactive antigens. Proc. Natl. Acad. Sci. U.S.A. 2009, 106 (32), 13499–504. [DOI] [PMC free article] [PubMed] [Google Scholar]
- Beare P. A.; Chen C.; Bouman T.; Pablo J.; Unal B.; Cockrell D. C.; Brown W. C.; Barbian K. D.; Porcella S. F.; Samuel J. E.; Felgner P. L.; Heinzen R. A. Candidate antigens for Q fever serodiagnosis revealed by immunoscreening of a Coxiella burnetii protein microarray. Clin. Vaccine Immunol. 2008, 15 (12), 1771–9. [DOI] [PMC free article] [PubMed] [Google Scholar]
- Barbour A. G.; Jasinskas A.; Kayala M. A.; Davies D. H.; Steere A. C.; Baldi P.; Felgner P. L. A genome-wide proteome array reveals a limited set of immunogens in natural infections of humans and white-footed mice with Borrelia burgdorferi. Infect. Immun. 2008, 76 (8), 3374–89. [DOI] [PMC free article] [PubMed] [Google Scholar]
- Vigil A.; Ortega R.; Jain A.; Nakajima-Sasaki R.; Tan X.; Chomel B. B.; Kasten R. W.; Koehler J. E.; Felgner P. L. Identification of the feline humoral immune response to Bartonella henselae infection by protein microarray. PLoS One 2010, 5 (7), e11447. [DOI] [PMC free article] [PubMed] [Google Scholar]
- Driguez P.; Doolan D. L.; Loukas A.; Felgner P. L.; McManus D. P. Schistosomiasis vaccine discovery using immunomics. Parasit Vectors 2010, 3, 4. [DOI] [PMC free article] [PubMed] [Google Scholar]
- Davies D. H.; Molina D. M.; Wrammert J.; Miller J.; Hirst S.; Mu Y.; Pablo J.; Unal B.; Nakajima-Sasaki R.; Liang X.; Crotty S.; Karem K. L.; Damon I. K.; Ahmed R.; Villarreal L.; Felgner P. L. Proteome-wide analysis of the serological response to vaccinia and smallpox. Proteomics 2007, 7 (10), 1678–86. [DOI] [PubMed] [Google Scholar]
- Luevano M.; Bernard H. U.; Barrera-Saldana H. A.; Trevino V.; Garcia-Carranca A.; Villa L. L.; Monk B. J.; Tan X.; Davies D. H.; Felgner P. L.; Kalantari M. High-throughput profiling of the humoral immune responses against thirteen human papillomavirus types by proteome microarrays. Virology 2010, 405 (1), 31–40. [DOI] [PMC free article] [PubMed] [Google Scholar]
- Pappas G.; Akritidis N.; Bosilkovski M.; Tsianos E. Brucellosis. N. Engl. J. Med. 2005, 352 (22), 2325–36. [DOI] [PubMed] [Google Scholar]
- Young E. J. An overview of human brucellosis. Clin. Infect. Dis 1995, 21 (2), 283–9. ; quiz 290. [DOI] [PubMed] [Google Scholar]
- Franco M. P.; Mulder M.; Gilman R. H.; Smits H. L. Human brucellosis. Lancet Infect. Dis. 2007, 7 (12), 775–86. [DOI] [PubMed] [Google Scholar]
- Mantur B. G.; Amarnath S. K.; Shinde R. S. Review of clinical and laboratory features of human brucellosis. Indian J. Med. Microbiol. 2007, 25 (3), 188–202. [DOI] [PubMed] [Google Scholar]
- Pappas G.; Papadimitriou P.; Akritidis N.; Christou L.; Tsianos E. V. The new global map of human brucellosis. Lancet Infect. Dis. 2006, 6 (2), 91–9. [DOI] [PubMed] [Google Scholar]
- Al Dahouk S.; Jubier-Maurin V.; Scholz H. C.; Tomaso H.; Karges W.; Neubauer H.; Kohler S. Quantitative analysis of the intramacrophagic Brucella suis proteome reveals metabolic adaptation to late stage of cellular infection. Proteomics 2008, 8 (18), 3862–70. [DOI] [PubMed] [Google Scholar]
- Cloeckaert A.; Debbarh H. S.; Vizcaino N.; Saman E.; Dubray G.; Zygmunt M. S. Cloning, nucleotide sequence, and expression of the Brucella melitensis bp26 gene coding for a protein immunogenic in infected sheep. FEMS Microbiol. Lett. 1996, 140 (2–3), 139–44. [DOI] [PubMed] [Google Scholar]
- Connolly J. P.; Comerci D.; Alefantis T. G.; Walz A.; Quan M.; Chafin R.; Grewal P.; Mujer C. V.; Ugalde R. A.; DelVecchio V. G. Proteomic analysis of Brucella abortus cell envelope and identification of immunogenic candidate proteins for vaccine development. Proteomics 2006, 6 (13), 3767–80. [DOI] [PubMed] [Google Scholar]
- Gor D.; Mayfield J. E. Cloning and nucleotide sequence of the Brucella abortus groE operon. Biochim. Biophys. Acta 1992, 1130 (1), 120–2. [DOI] [PubMed] [Google Scholar]
- Lamontagne J.; Forest A.; Marazzo E.; Denis F.; Butler H.; Michaud J. F.; Boucher L.; Pedro I.; Villeneuve A.; Sitnikov D.; Trudel K.; Nassif N.; Boudjelti D.; Tomaki F.; Chaves-Olarte E.; Guzman-Verri C.; Brunet S.; Cote-Martin A.; Hunter J.; Moreno E.; Paramithiotis E. Intracellular adaptation of Brucella abortus. J. Proteome Res. 2009, 8 (3), 1594–609. [DOI] [PMC free article] [PubMed] [Google Scholar]
- Letesson J. J.; Tibor A.; van Eynde G.; Wansard V.; Weynants V.; Denoel P.; Saman E. Humoral immune responses of Brucella-infected cattle, sheep, and goats to eight purified recombinant Brucella proteins in an indirect enzyme-linked immunosorbent assay. Clin. Diagn. Lab. Immunol. 1997, 4 (5), 556–64. [DOI] [PMC free article] [PubMed] [Google Scholar]
- Lindler L. E.; Hadfield T. L.; Tall B. D.; Snellings N. J.; Rubin F. A.; Van De Verg L. L.; Hoover D.; Warren R. L. Cloning of a Brucella melitensis group 3 antigen gene encoding Omp28, a protein recognized by the humoral immune response during human brucellosis. Infect. Immun. 1996, 64 (7), 2490–9. [DOI] [PMC free article] [PubMed] [Google Scholar]
- Mayfield J. E.; Bricker B. J.; Godfrey H.; Crosby R. M.; Knight D. J.; Halling S. M.; Balinsky D.; Tabatabai L. B. The cloning, expression, and nucleotide sequence of a gene coding for an immunogenic Brucella abortus protein. Gene 1988, 63 (1), 1–9. [DOI] [PubMed] [Google Scholar]
- Rolan H. G.; den Hartigh A. B.; Kahl-McDonagh M.; Ficht T.; Adams L. G.; Tsolis R. M. VirB12 is a serological marker of Brucella infection in experimental and natural hosts. Clin. Vaccine Immunol. 2008, 15 (2), 208–14. [DOI] [PMC free article] [PubMed] [Google Scholar]
- Roop R. M. 2nd; Fletcher T. W.; Sriranganathan N. M.; Boyle S. M.; Schurig G. G. Identification of an immunoreactive Brucella abortus HtrA stress response protein homolog. Infect. Immun. 1994, 62 (3), 1000–7. [DOI] [PMC free article] [PubMed] [Google Scholar]
- Tibor A.; Weynants V.; Denoel P.; Lichtfouse B.; De Bolle X.; Saman E.; Limet J. N.; Letesson J. J. Molecular cloning, nucleotide sequence, and occurrence of a 16.5-kilodalton outer membrane protein of Brucella abortus with similarity to pal lipoproteins. Infect. Immun. 1994, 62 (9), 3633–9. [DOI] [PMC free article] [PubMed] [Google Scholar]
- Yang X.; Hudson M.; Walters N.; Bargatze R. F.; Pascual D. W. Selection of protective epitopes for Brucella melitensis by DNA vaccination. Infect. Immun. 2005, 73 (11), 7297–303. [DOI] [PMC free article] [PubMed] [Google Scholar]
- Rossetti O. L.; Arese A. I.; Boschiroli M. L.; Cravero S. L. Cloning of Brucella abortus gene and characterization of expressed 26-kilodalton periplasmic protein: potential use for diagnosis. J. Clin. Microbiol. 1996, 34 (1), 165–9. [DOI] [PMC free article] [PubMed] [Google Scholar]
- Baker P. J.; Wilson J. B. Hypoferremia in mice and its application to the bioassay of endotoxin. J. Bacteriol. 1965, 90 (4), 903–10. [DOI] [PMC free article] [PubMed] [Google Scholar]
- Kittelberger R.; Hilbink F. Sensitive silver-staining detection of bacterial lipopolysaccharides in polyacrylamide gels. J. Biochem. Biophys. Methods 1993, 26 (1), 81–6. [DOI] [PubMed] [Google Scholar]
- Karkhanis Y. D.; Zeltner J. Y.; Jackson J. J.; Carlo D. J. A new and improved microassay to determine 2-keto-3-deoxyoctonate in lipopolysaccharide of Gram-negative bacteria. Anal. Biochem. 1978, 85 (2), 595–601. [DOI] [PubMed] [Google Scholar]
- Lamontagne J.; Butler H.; Chaves-Olarte E.; Hunter J.; Schirm M.; Paquet C.; Tian M.; Kearney P.; Hamaidi L.; Chelsky D.; Moriyon I.; Moreno E.; Paramithiotis E. Extensive cell envelope modulation is associated with virulence in Brucella abortus. J. Proteome Res. 2007, 6 (4), 1519–29. [DOI] [PubMed] [Google Scholar]
- Lamontagne J.; Beland M.; Forest A.; Cote-Martin A.; Nassif N.; Tomaki F.; Moriyon I.; Moreno E.; Paramithiotis E. Proteomics-based confirmation of protein expression and correction of annotation errors in the Brucella abortus genome. BMC Genomics 2010, 11, 300. [DOI] [PMC free article] [PubMed] [Google Scholar]
- Baldi P.; Hatfield G. W.. DNA Microarrays and Gene Expression: From Experiments to Data Analysis and Modeling; Cambridge University Press: Oxford, 2002. [Google Scholar]
- Sundaresh S.; Doolan D. L.; Hirst S.; Mu Y.; Unal B.; Davies D. H.; Felgner P. L.; Baldi P. Identification of humoral immune responses in protein microarrays using DNA microarray data analysis techniques. Bioinformatics 2006, 22 (14), 1760–6. [DOI] [PubMed] [Google Scholar]
- Sundaresh S.; Randall A.; Unal B.; Petersen J. M.; Belisle J. T.; Hartley M. G.; Duffield M.; Titball R. W.; Davies D. H.; Felgner P. L.; Baldi P. From protein microarrays to diagnostic antigen discovery: a study of the pathogen Francisella tularensis. Bioinformatics 2007, 23 (13), i508–18. [DOI] [PubMed] [Google Scholar]
- Durbin B. P.; Hardin J. S.; Hawkins D. M.; Rocke D. M. A variance-stabilizing transformation for gene-expression microarray data. Bioinformatics 2002, 18 (Suppl 1), S105–10. [DOI] [PubMed] [Google Scholar]
- Huber W.; von Heydebreck A.; Sultmann H.; Poustka A.; Vingron M. Variance stabilization applied to microarray data calibration and to the quantification of differential expression. Bioinformatics 2002, 18 (Suppl 1), S96–104. [DOI] [PubMed] [Google Scholar]
- Kreil D. P.; Karp N. A.; Lilley K. S. DNA microarray normalization methods can remove bias from differential protein expression analysis of 2D difference gel electrophoresis results. Bioinformatics 2004, 20 (13), 2026–34. [DOI] [PubMed] [Google Scholar]
- Baldi P.; Brunak S. R.. Bioinformatics: the machine learning approach; MIT Press: Cambridge, MA, 2001. [Google Scholar]
- Long A. D.; Mangalam H. J.; Chan B. Y.; Tolleri L.; Hatfield G. W.; Baldi P. Improved statistical inference from DNA microarray data using analysis of variance and a Bayesian statistical framework. Analysis of global gene expression in Escherichia coli K12. J. Biol. Chem. 2001, 276 (23), 19937–44. [DOI] [PubMed] [Google Scholar]
- Benjamini Y.; Hochberg Y. Controlling the false discovery rate: a practical and powerful approach to multiple testing. J. Roy. Statist. Soc., Ser. B 1995, 57 (1), 289–300. [Google Scholar]
- Moller S.; Croning M. D.; Apweiler R. Evaluation of methods for the prediction of membrane spanning regions. Bioinformatics 2001, 17 (7), 646–53. [DOI] [PubMed] [Google Scholar]
- Bendtsen J. D.; Nielsen H.; von Heijne G.; Brunak S. Improved prediction of signal peptides: SignalP 3.0. J. Mol. Biol. 2004, 340 (4), 783–95. [DOI] [PubMed] [Google Scholar]
- Gardy J. L.; Laird M. R.; Chen F.; Rey S.; Walsh C. J.; Ester M.; Brinkman F. S. PSORTb v.2.0: expanded prediction of bacterial protein subcellular localization and insights gained from comparative proteome analysis. Bioinformatics 2005, 21 (5), 617–23. [DOI] [PubMed] [Google Scholar]
- Girosi F. An Equivalence Between Sparse Approximation and Support Vector Machines. Neural Comput. 1998, 10 (6), 1455–80. [DOI] [PubMed] [Google Scholar]
- Ciftci C.; Ozturk F.; Oztekin A.; Karaoglan H.; Saba R.; Gultekin M.; Mamikoglu L. Comparison of the serological tests used for the laboratory diagnosis of brucellosis. Mikrobiyol. Bul. 2005, 39 (3), 291–9. [PubMed] [Google Scholar]
- Sisirak M.; Hukic M. Evaluation and importance of selected microbiological methods in the diagnosis of human brucellosis. Bosn. J. Basic Med. Sci. 2009, 9 (3), 198–203. [DOI] [PMC free article] [PubMed] [Google Scholar]
- Dasgupta A.; Sureka K.; Mitra D.; Saha B.; Sanyal S.; Das A. K.; Chakrabarti P.; Jackson M.; Gicquel B.; Kundu M.; Basu J. An oligopeptide transporter of Mycobacterium tuberculosis regulates cytokine release and apoptosis of infected macrophages. PLoS One 2010, 5 (8), e12225. [DOI] [PMC free article] [PubMed] [Google Scholar]
- Skendros P.; Pappas G.; Boura P. Cell-mediated immunity in human brucellosis. Microbes Infect. 2011, 13 (2), 134–42. [DOI] [PubMed] [Google Scholar]
- Paschos A.; den Hartigh A.; Smith M. A.; Atluri V. L.; Sivanesan D.; Tsolis R. M.; Baron C. An in vivo high-throughput screening approach targeting the type IV secretion system component VirB8 identified inhibitors of Brucella abortus 2308 proliferation. Infect. Immun. 2011, 79 (3), 1033–43. [DOI] [PMC free article] [PubMed] [Google Scholar]
- Wick M. J.; Pfeifer J. D.; Findlay K. A.; Harding C. V.; Normark S. J. Compartmentalization of defined epitopes expressed in Escherichia coli has only a minor influence on efficiency of phagocytic processing for presentation by class I and class II major histocompatibility complex molecules to T cells. Infect. Immun. 1993, 61 (11), 4848–56. [DOI] [PMC free article] [PubMed] [Google Scholar]
- Salih-Alj Debbarh H.; Cloeckaert A.; Bezard G.; Dubray G.; Zygmunt M. S. Enzyme-linked immunosorbent assay with partially purified cytosoluble 28-kilodalton protein for serological differentiation between Brucella melitensis-infected and B. melitensis Rev.1-vaccinated sheep. Clin. Diagn. Lab. Immunol. 1996, 3 (3), 305–8. [DOI] [PMC free article] [PubMed] [Google Scholar]
- Tibor A.; Saman E.; de Wergifosse P.; Cloeckaert A.; Limet J. N.; Letesson J. J. Molecular characterization, occurrence, and immunogenicity in infected sheep and cattle of two minor outer membrane proteins of Brucella abortus. Infect. Immun. 1996, 64 (1), 100–7. [DOI] [PMC free article] [PubMed] [Google Scholar]
- Domingo G. J.; Caivano A.; Sartorius R.; Barba P.; Backstrom M.; Piatier-Tonneau D.; Guardiola J.; De Berardinis P.; Perham R. N. Induction of specific T-helper and cytolytic responses to epitopes displayed on a virus-like protein scaffold derived from the pyruvate dehydrogenase multienzyme complex. Vaccine 2003, 21 (13–14), 1502–9. [DOI] [PubMed] [Google Scholar]
- Magnan C. N.; Zeller M.; Kayala M. A.; Vigil A.; Randall A.; Felgner P. L.; Baldi P. High-throughput prediction of protein antigenicity using protein microarray data. Bioinformatics 2010, 26 (23), 2936–43. [DOI] [PMC free article] [PubMed] [Google Scholar]
- Corbin R. W.; Paliy O.; Yang F.; Shabanowitz J.; Platt M.; Lyons C. E. Jr.; Root K.; McAuliffe J.; Jordan M. I.; Kustu S.; Soupene E.; Hunt D. F. Toward a protein profile of Escherichia coli: comparison to its transcription profile. Proc. Natl. Acad. Sci. U.S.A. 2003, 100 (16), 9232–7. [DOI] [PMC free article] [PubMed] [Google Scholar]
- Ishihama Y.; Oda Y.; Tabata T.; Sato T.; Nagasu T.; Rappsilber J.; Mann M. Exponentially modified protein abundance index (emPAI) for estimation of absolute protein amount in proteomics by the number of sequenced peptides per protein. Mol. Cell. Proteomics 2005, 4 (9), 1265–72. [DOI] [PubMed] [Google Scholar]
- Ishihama Y.; Schmidt T.; Rappsilber J.; Mann M.; Hartl F. U.; Kerner M. J.; Frishman D. Protein abundance profiling of the Escherichia coli cytosol. BMC Genomics 2008, 9, 102. [DOI] [PMC free article] [PubMed] [Google Scholar]
- Kohler S.; Foulongne V.; Ouahrani-Bettache S.; Bourg G.; Teyssier J.; Ramuz M.; Liautard J. P. The analysis of the intramacrophagic virulome of Brucella suis deciphers the environment encountered by the pathogen inside the macrophage host cell. Proc. Natl. Acad. Sci. U.S.A. 2002, 99 (24), 15711–6. [DOI] [PMC free article] [PubMed] [Google Scholar]
- Bashir A.; Bansal V.; Bafna V. Designing deep sequencing experiments: detecting structural variation and estimating transcript abundance. BMC Genomics 2010, 11, 385. [DOI] [PMC free article] [PubMed] [Google Scholar]
Associated Data
This section collects any data citations, data availability statements, or supplementary materials included in this article.